

Здравейте на всички. През май OTUS стартира , както на инфраструктурата, така и на приложенията с помощта на Zabbix, Prometheus, Grafana и ELK. Във връзка с това традиционно споделяме полезен материал по темата.
за Prometheus позволява реализирането на мониторинг на външни услуги чрез HTTP, HTTPS, DNS, TCP, ICMP. В тази статия ще ви покажа как да настроите мониторинг на HTTP/HTTPS с помощта на Blackbox експортер. Ще стартираме Blackbox експортер в Kubernetes.
Околна среда
Ще ни трябват следните елементи:
- Kubernetes
- Prometheus Operator
Конфигурация на blackbox експортер
Конфигурираме Blackbox чрез ConfigMap за настройване на http модула за мониторинг на уеб услуги.
apiVersion: v1
kind: ConfigMap
metadata:
  name: prometheus-blackbox-exporter
  labels:
    app: prometheus-blackbox-exporter
data:
  blackbox.yaml: |
    modules:
      http_2xx:
        http:
          no_follow_redirects: false
          preferred_ip_protocol: ip4
          valid_http_versions:
          - HTTP/1.1
          - HTTP/2
          valid_status_codes: []
        prober: http
        timeout: 5s
Модул http_2xx се използва за проверка на това, че уеб услугата връща код на състояние HTTP 2xx. Подробности за конфигурацията на blackbox експортер са описани в .
Разгърнете blackbox експортер в Kubernetes клъстера
Опишете Deployment и Услуга за разгръщане в Kubernetes.
---
kind: Service
apiVersion: v1
metadata:
  name: prometheus-blackbox-exporter
  labels:
    app: prometheus-blackbox-exporter
spec:
  type: ClusterIP
  ports:
    - name: http
      port: 9115
      protocol: TCP
  selector:
    app: prometheus-blackbox-exporter

---
apiVersion: apps/v1
kind: Deployment
metadata:
  name: prometheus-blackbox-exporter
  labels:
    app: prometheus-blackbox-exporter
spec:
  replicas: 1
  selector:
    matchLabels:
      app: prometheus-blackbox-exporter
  template:
    metadata:
      labels:
        app: prometheus-blackbox-exporter
    spec:
      restartPolicy: Always
      containers:
        - name: blackbox-exporter
          image: "prom/blackbox-exporter:v0.15.1"
          imagePullPolicy: IfNotPresent
          securityContext:
            readOnlyRootFilesystem: true
            runAsNonRoot: true
            runAsUser: 1000
          args:
            - "--config.file=/config/blackbox.yaml"
          resources:
            {}
          ports:
            - containerPort: 9115
              name: http
          livenessProbe:
            httpGet:
              path: /health
              port: http
          readinessProbe:
            httpGet:
              path: /health
              port: http
          volumeMounts:
            - mountPath: /config
              name: config
        - name: configmap-reload
          image: "jimmidyson/configmap-reload:v0.2.2"
          imagePullPolicy: "IfNotPresent"
          securityContext:
            runAsNonRoot: true
            runAsUser: 65534
          args:
            - --volume-dir=/etc/config
            - --webhook-url=http://localhost:9115/-/reload
          resources:
            {}
          volumeMounts:
            - mountPath: /etc/config
              name: config
              readOnly: true
      volumes:
        - name: config
          configMap:
            name: prometheus-blackbox-exporter
Blackbox експортер може да бъде разположен с помощта на следната команда. Пространство за имена monitoring отнася се до Prometheus Operator.
kubectl --namespace=monitoring apply -f blackbox-exporter.yamlУверете се, че всички услуги са стартирани, като използвате следната команда:
kubectl --namespace=monitoring get all --selector=app=prometheus-blackbox-exporterПроверка на Blackbox
Можете да получите достъп до уеб интерфейса на Blackbox експортьора чрез port-forward:
kubectl --namespace=monitoring port-forward svc/prometheus-blackbox-exporter 9115:9115Свържете се с уеб интерфейса на Blackbox експортьора чрез уеб браузър на адрес :9115.
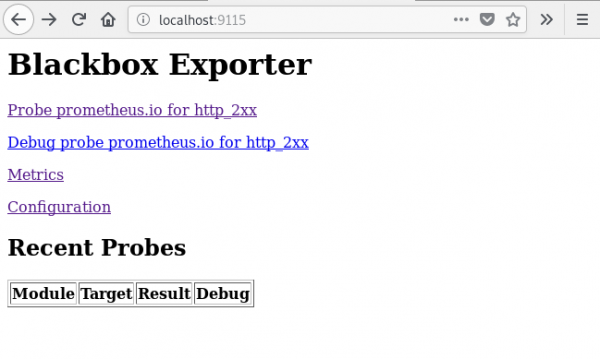
Ако посетите адреса , ще видите резултата от проверката на посочения URL ().
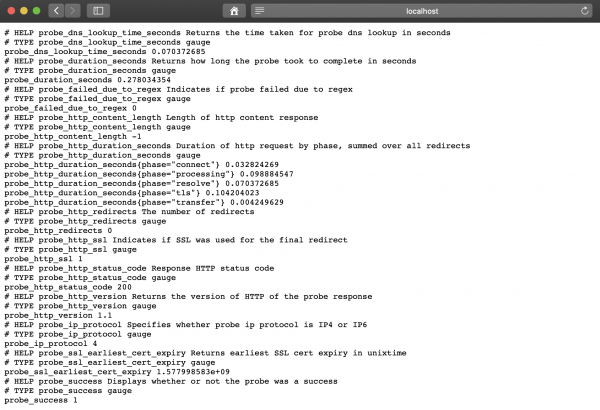
Стойността на метриката probe_success равна на 1 означава успешна проверка. Стойността 0 сигнализира за грешка.
Настройка на Prometheus
След разгръщането на BlackBox експортьора, конфигурирайте Prometheus в prometheus-additional.yaml.
- job_name: 'kube-api-blackbox'
  scrape_interval: 1w
  metrics_path: /probe
  params:
    module: [http_2xx]
  static_configs:
   - targets:
      - https://www.google.com
      - http://www.example.com
      - https://prometheus.io
  relabel_configs:
   - source_labels: [__address__]
     target_label: __param_target
   - source_labels: [__param_target]
     target_label: instance
   - target_label: __address__
     replacement: prometheus-blackbox-exporter:9115 # The blackbox exporter.
Генерираме Secret, като използваме следната команда.
PROMETHEUS_ADD_CONFIG=$(cat prometheus-additional.yaml | base64)
cat << EOF | kubectl --namespace=monitoring apply -f -
apiVersion: v1
kind: Secret
metadata:
  name: additional-scrape-configs
type: Opaque
data:
  prometheus-additional.yaml: $PROMETHEUS_ADD_CONFIG
EOF
Указваме additional-scrape-configs за Prometheus Operator, използвайки additionalScrapeConfigs.
kubectl --namespace=monitoring edit prometheuses k8s
...
spec:
  additionalScrapeConfigs:
    key: prometheus-additional.yaml
    name: additional-scrape-configs
Влизаме в уеб интерфейса на Prometheus, проверяваме метриките и целите.
kubectl --namespace=monitoring port-forward svc/prometheus-k8s 9090:9090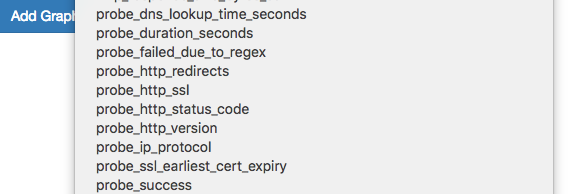
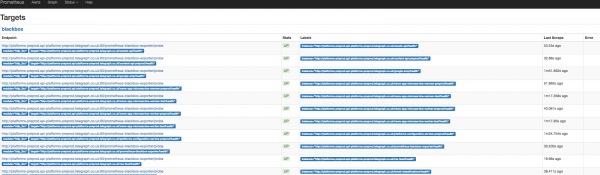
Виждаме метриките и целите на Blackbox.
Добавяне на правила за уведомления (alert)
За да получаваме известия от Blackbox експортьора, ще добавим правила в Prometheus Operator.
kubectl --namespace=monitoring edit prometheusrules prometheus-k8s-rules
...
  - name: blackbox-exporter
    rules:
    - alert: ProbeFailed
      expr: probe_success == 0
      for: 5m
      labels:
        severity: error
      annotations:
        summary: "Probe failed (instance {{ $labels.instance }})"
        description: "Probe failed
  VALUE = {{ $value }}
  LABELS: {{ $labels }}"
    - alert: SlowProbe
      expr: avg_over_time(probe_duration_seconds[1m]) > 1
      for: 5m
      labels:
        severity: warning
      annotations:
        summary: "Slow probe (instance {{ $labels.instance }})"
        description: "Blackbox probe took more than 1s to complete
  VALUE = {{ $value }}
  LABELS: {{ $labels }}"
    - alert: HttpStatusCode
      expr: probe_http_status_code = 400
      for: 5m
      labels:
        severity: error
      annotations:
        summary: "HTTP Status Code (instance {{ $labels.instance }})"
        description: "HTTP status code is not 200-399
  VALUE = {{ $value }}
  LABELS: {{ $labels }}"
    - alert: SslCertificateWillExpireSoon
      expr: probe_ssl_earliest_cert_expiry - time() < 86400 * 30
      for: 5m
      labels:
        severity: warning
      annotations:
        summary: "SSL certificate will expire soon (instance {{ $labels.instance }})"
        description: "SSL certificate expires in 30 days
  VALUE = {{ $value }}
  LABELS: {{ $labels }}"
    - alert: SslCertificateHasExpired
      expr: probe_ssl_earliest_cert_expiry - time()  1
      for: 5m
      labels:
        severity: warning
      annotations:
        summary: "HTTP slow requests (instance {{ $labels.instance }})"
        description: "HTTP request took more than 1s
  VALUE = {{ $value }}
  LABELS: {{ $labels }}"
    - alert: SlowPing
      expr: avg_over_time(probe_icmp_duration_seconds[1m]) > 1
      for: 5m
      labels:
        severity: warning
      annotations:
        summary: "Slow ping (instance {{ $labels.instance }})"
        description: "Blackbox ping took more than 1s
  VALUE = {{ $value }}
  LABELS: {{ $labels }}"
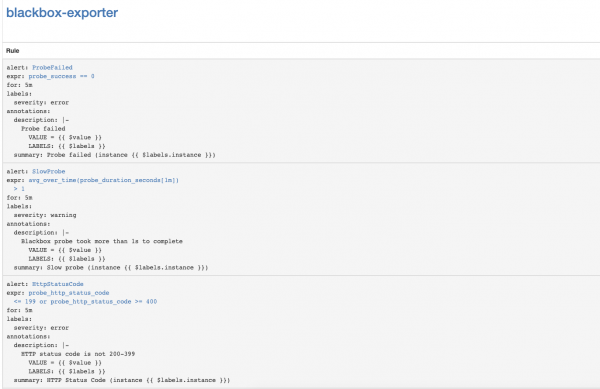
В уеб интерфейса на Prometheus отидете в секция Status => Rules и намерете правилата за известия за blackbox-exporter.
Настройка на уведомления за изтичане на срока на SSL сертификатите на Kubernetes API Server.
Нека настроим мониторинг на изтичането на срока на SSL сертификатите на Kubernetes API Server. Той ще изпраща уведомления веднъж седмично.
Добавяме модула Blackbox експортер за удостоверяване на Kubernetes API Server.
kubectl --namespace=monitoring edit configmap prometheus-blackbox-exporter
...
      kube-api:
        http:
          method: GET
          no_follow_redirects: false
          preferred_ip_protocol: ip4
          tls_config:
            insecure_skip_verify: false
            ca_file: /var/run/secrets/kubernetes.io/serviceaccount/ca.crt
          bearer_token_file: /var/run/secrets/kubernetes.io/serviceaccount/token
          valid_http_versions:
          - HTTP/1.1
          - HTTP/2
          valid_status_codes: []
        prober: http
        timeout: 5s
Добавяме конфигурация за запис на Prometheus
- job_name: 'kube-api-blackbox'
  metrics_path: /probe
  params:
    module: [kube-api]
  static_configs:
   - targets:
      - https://kubernetes.default.svc/api
  relabel_configs:
   - source_labels: [__address__]
     target_label: __param_target
   - source_labels: [__param_target]
     target_label: instance
   - target_label: __address__
     replacement: prometheus-blackbox-exporter:9115 # The blackbox exporter.
Прилагане на Prometheus Secret
PROMETHEUS_ADD_CONFIG=$(cat prometheus-additional.yaml | base64)
cat << EOF | kubectl --namespace=monitoring apply -f -
apiVersion: v1
kind: Secret
metadata:
  name: additional-scrape-configs
type: Opaque
data:
  prometheus-additional.yaml: $PROMETHEUS_ADD_CONFIG
EOF
Добавяне на правила за оповестяване
kubectl --namespace=monitoring edit prometheusrules prometheus-k8s-rules
...
  - name: k8s-api-server-cert-expiry
    rules:
    - alert: K8sAPIServerSSLCertExpiringAfterThreeMonths
      expr: probe_ssl_earliest_cert_expiry{job="kube-api-blackbox"} - time() < 86400 * 90
      for: 1w
      labels:
        severity: warning
      annotations:
        summary: "SSL сертификатът на Kubernetes API Server ще изтече след три месеца (инстанция {{ $labels.instance }})"
        description: "SSL сертификатът на Kubernetes API Server изтича след 90 дниn  VALUE = {{ $value }}n  LABELS: {{ $labels }}"
Полезни връзки
Източник: habr.com
