

Ahoj všichni. V květnu OTUS spouští , jak infrastruktury, tak aplikací pomocí Zabbix, Prometheus, Grafana a ELK. V této souvislosti tradičně sdílíme užitečné materiály k tématu.
pro Prometheus umožňuje provádět monitoring externích služeb přes HTTP, HTTPS, DNS, TCP, ICMP. V tomto článku vám ukážu, jak nastavit monitoring HTTP/HTTPS pomocí Blackbox exportera. Blackbox exporter budeme spouštět v Kubernetes.
Prostředí
Budeme potřebovat následující:
- Kubernetes
- Prometheus Operator
Konfigurace blackbox exportera
Konfigurujeme Blackbox přes ConfigMap pro nastavení http modulu monitorování webových služeb.
apiVersion: v1
kind: ConfigMap
metadata:
  name: prometheus-blackbox-exporter
  labels:
    app: prometheus-blackbox-exporter
data:
  blackbox.yaml: |
    modules:
      http_2xx:
        http:
          no_follow_redirects: false
          preferred_ip_protocol: ip4
          valid_http_versions:
          - HTTP/1.1
          - HTTP/2
          valid_status_codes: []
        prober: http
        timeout: 5s
Modul http_2xx se používá k ověření, že webová služba vrací kód stavu HTTP 2xx. Podrobnosti o konfiguraci blackbox exportera jsou popsány v .
Nasazení blackbox exportera do Kubernetes clusteru
Popište Nasazení a Služba pro nasazení v Kubernetes.
---
kind: Service
apiVersion: v1
metadata:
  name: prometheus-blackbox-exporter
  labels:
    app: prometheus-blackbox-exporter
spec:
  type: ClusterIP
  ports:
    - name: http
      port: 9115
      protocol: TCP
  selector:
    app: prometheus-blackbox-exporter

---
apiVersion: apps/v1
kind: Deployment
metadata:
  name: prometheus-blackbox-exporter
  labels:
    app: prometheus-blackbox-exporter
spec:
  replicas: 1
  selector:
    matchLabels:
      app: prometheus-blackbox-exporter
  template:
    metadata:
      labels:
        app: prometheus-blackbox-exporter
    spec:
      restartPolicy: Always
      containers:
        - name: blackbox-exporter
          image: "prom/blackbox-exporter:v0.15.1"
          imagePullPolicy: IfNotPresent
          securityContext:
            readOnlyRootFilesystem: true
            runAsNonRoot: true
            runAsUser: 1000
          args:
            - "--config.file=/config/blackbox.yaml"
          resources:
            {}
          ports:
            - containerPort: 9115
              name: http
          livenessProbe:
            httpGet:
              path: /health
              port: http
          readinessProbe:
            httpGet:
              path: /health
              port: http
          volumeMounts:
            - mountPath: /config
              name: config
        - name: configmap-reload
          image: "jimmidyson/configmap-reload:v0.2.2"
          imagePullPolicy: "IfNotPresent"
          securityContext:
            runAsNonRoot: true
            runAsUser: 65534
          args:
            - --volume-dir=/etc/config
            - --webhook-url=http://localhost:9115/-/reload
          resources:
            {}
          volumeMounts:
            - mountPath: /etc/config
              name: config
              readOnly: true
      volumes:
        - name: config
          configMap:
            name: prometheus-blackbox-exporter
Blackbox exporter lze nasadit pomocí následujícího příkazu. Jmenný prostor monitoring se vztahuje k Prometheus Operator.
kubectl --namespace=monitoring apply -f blackbox-exporter.yamlZkontrolujte, zda všechny služby běží pomocí následujícího příkazu:
kubectl --namespace=monitoring get all --selector=app=prometheus-blackbox-exporterKontrola Blackbox
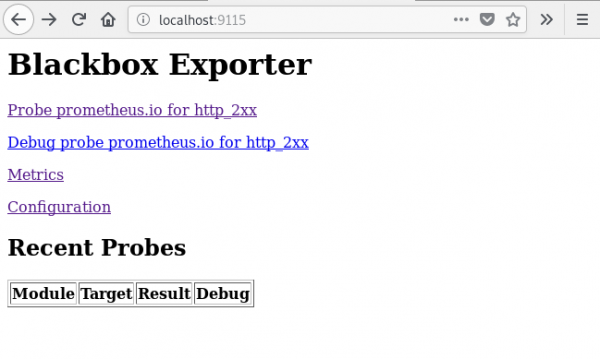
K webovému rozhraní Blackbox exportéra můžete přistupovat pomocí port-forward:
kubectl --namespace=monitoring port-forward svc/prometheus-blackbox-exporter 9115:9115Připojte se k webovému rozhraní Blackbox exportéra pomocí webového prohlížeče na adrese :9115.
Pokud přejdete na adresu , uvidíte výsledek kontroly zadaného URL ().
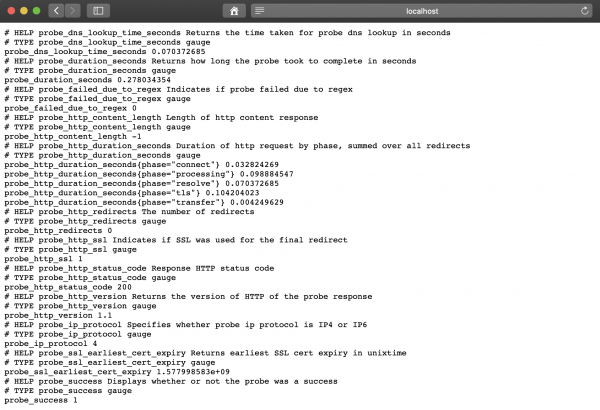
Hodnota metriky probe_success rovná 1 znamená úspěšnou kontrolu. Hodnota 0 znamená chybu.
Nastavení Prometheus
Po nasazení BlackBox exportéra nastavíme Prometheus v prometheus-additional.yaml.
- job_name: 'kube-api-blackbox'
  scrape_interval: 1w
  metrics_path: /probe
  params:
    module: [http_2xx]
  static_configs:
   - targets:
      - https://www.google.com
      - http://www.example.com
      - https://prometheus.io
  relabel_configs:
   - source_labels: [__address__]
     target_label: __param_target
   - source_labels: [__param_target]
     target_label: instance
   - target_label: __address__
     replacement: prometheus-blackbox-exporter:9115 # Blackbox exportér.
Generujeme Secret, pomocí následujícího příkazu.
PROMETHEUS_ADD_CONFIG=$(cat prometheus-additional.yaml | base64)
cat << EOF | kubectl --namespace=monitoring apply -f -
apiVersion: v1
kind: Secret
metadata:
  name: additional-scrape-configs
type: Opaque
data:
  prometheus-additional.yaml: $PROMETHEUS_ADD_CONFIG
EOF
Určte additional-scrape-configs pro Prometheus Operator, pomocí additionalScrapeConfigs.
kubectl --namespace=monitoring edit prometheuses k8s
...
spec:
  additionalScrapeConfigs:
    key: prometheus-additional.yaml
    name: additional-scrape-configs
Přejdeme do webového rozhraní Prometheus, zkontrolujeme metriky a cíle.
kubectl --namespace=monitoring port-forward svc/prometheus-k8s 9090:9090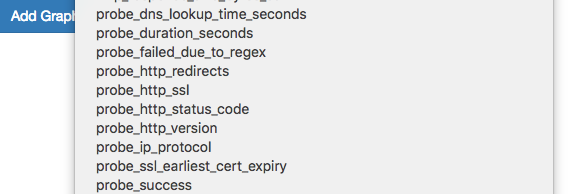
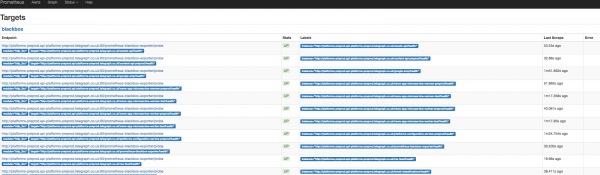
Vidíme metriky a cíle Blackbox.
Přidání pravidel pro upozornění (alert)
Pro získání upozornění od Blackbox exportéra přidáme pravidla do Prometheus Operator.
kubectl --namespace=monitoring edit prometheusrules prometheus-k8s-rules
...
  - name: blackbox-exporter
    rules:
    - alert: ProbeFailed
      expr: probe_success == 0
      for: 5m
      labels:
        severity: error
      annotations:
        summary: "Probe failed (instance {{ $labels.instance }})"
        description: "Probe failedn  VALUE = {{ $value }}n  LABELS: {{ $labels }}"
    - alert: SlowProbe
      expr: avg_over_time(probe_duration_seconds[1m]) > 1
      for: 5m
      labels:
        severity: warning
      annotations:
        summary: "Slow probe (instance {{ $labels.instance }})"
        description: "Blackbox probe took more than 1s to completen  VALUE = {{ $value }}n  LABELS: {{ $labels }}"
    - alert: HttpStatusCode
      expr: probe_http_status_code = 400
      for: 5m
      labels:
        severity: error
      annotations:
        summary: "HTTP Status Code (instance {{ $labels.instance }})"
        description: "HTTP status code is not 200-399n  VALUE = {{ $value }}n  LABELS: {{ $labels }}"
    - alert: SslCertificateWillExpireSoon
      expr: probe_ssl_earliest_cert_expiry - time() < 86400 * 30
      for: 5m
      labels:
        severity: warning
      annotations:
        summary: "SSL certificate will expire soon (instance {{ $labels.instance }})"
        description: "SSL certificate expires in 30 daysn  VALUE = {{ $value }}n  LABELS: {{ $labels }}"
    - alert: SslCertificateHasExpired
      expr: probe_ssl_earliest_cert_expiry - time()   1
      for: 5m
      labels:
        severity: warning
      annotations:
        summary: "HTTP slow requests (instance {{ $labels.instance }})"
        description: "HTTP request took more than 1sn  VALUE = {{ $value }}n  LABELS: {{ $labels }}"
    - alert: SlowPing
      expr: avg_over_time(probe_icmp_duration_seconds[1m]) > 1
      for: 5m
      labels:
        severity: warning
      annotations:
        summary: "Slow ping (instance {{ $labels.instance }})"
        description: "Blackbox ping took more than 1sn  VALUE = {{ $value }}n  LABELS: {{ $labels }}"
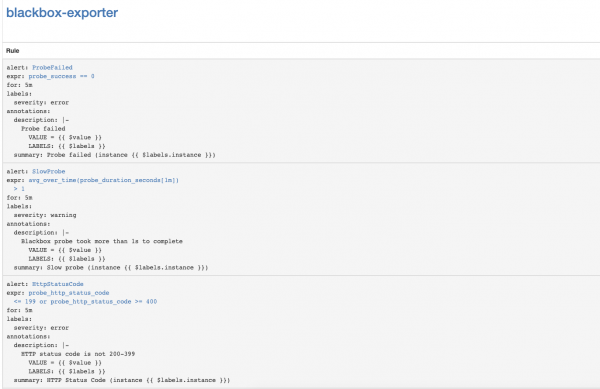
V rozhraní Prometheus přejděte na sekci Status => Rules a najděte pravidla upozornění pro blackbox-exporter.
Nastavení upozornění na vypršení platnosti SSL certifikátů Kubernetes API Serveru
Nastavíme monitorování vypršení platnosti SSL certifikátů Kubernetes API Serveru. Bude posílat upozornění jednou týdně.
Přidání modulu Blackbox exportéra pro Kubernetes API Server Authentication.
kubectl --namespace=monitoring edit configmap prometheus-blackbox-exporter
...
      kube-api:
        http:
          method: GET
          no_follow_redirects: false
          preferred_ip_protocol: ip4
          tls_config:
            insecure_skip_verify: false
            ca_file: /var/run/secrets/kubernetes.io/serviceaccount/ca.crt
          bearer_token_file: /var/run/secrets/kubernetes.io/serviceaccount/token
          valid_http_versions:
          - HTTP/1.1
          - HTTP/2
          valid_status_codes: []
        prober: http
        timeout: 5s
Přidání scrape konfigurace Prometheus
- job_name: 'kube-api-blackbox'
  metrics_path: /probe
  params:
    module: [kube-api]
  static_configs:
   - targets:
      - https://kubernetes.default.svc/api
  relabel_configs:
   - source_labels: [__address__]
     target_label: __param_target
   - source_labels: [__param_target]
     target_label: instance
   - target_label: __address__
     replacement: prometheus-blackbox-exporter:9115 # The blackbox exporter.
Používáme Prometheus Secret
PROMETHEUS_ADD_CONFIG=$(cat prometheus-additional.yaml | base64)
cat << EOF | kubectl --namespace=monitoring apply -f -
apiVersion: v1
kind: Secret
metadata:
  name: additional-scrape-configs
type: Opaque
data:
  prometheus-additional.yaml: $PROMETHEUS_ADD_CONFIG
EOF
Přidáváme upozornění
kubectl --namespace=monitoring edit prometheusrules prometheus-k8s-rules
...
  - name: k8s-api-server-cert-expiry
    rules:
    - alert: K8sAPIServerSSLCertExpiringAfterThreeMonths
      expr: probe_ssl_earliest_cert_expiry{job="kube-api-blackbox"} - time() < 86400 * 90
      for: 1w
      labels:
        severity: warning
      annotations:
        summary: "SSL certifikát Kubernetes API Serveru vyprší za tři měsíce (instance {{ $labels.instance }})"
        description: "SSL certifikát Kubernetes API Serveru vyprší za 90 dnůn  VALUE = {{ $value }}n  LABELS: {{ $labels }}"
Užitečné odkazy
Zdroj: habr.com
