

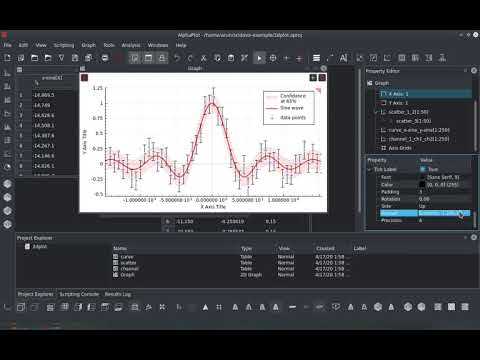
The release of AlphaPlot 1.02 has been published, providing a graphical interface for analyzing and visualizing scientific data. The project's development began in 2016 as a fork of SciDAVis 1.D009, which in turn is a fork of QtiPlot 0.9rc-2. During the development process, migration from the QWT library to QCustomPlot was carried out. The code is written in C++, uses the Qt library, and is distributed under the GPLv2 license.
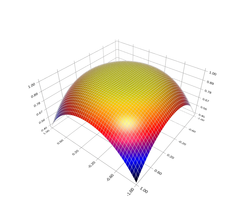
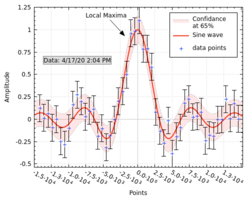
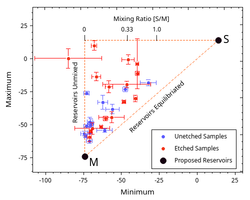
AlphaPlot aims to be a tool for data analysis and graphical representation, providing powerful mathematical processing and visualization (2D and 3D). It supports various approximation methods to given points using curves. Results can be saved in raster and vector formats such as PDF, SVG, PNG, and TIFF. The creation of automation scripts for plotting in JavaScript is supported. Plugins can be used to extend functionality.
The new version features an improved element placement management system for 2D graphs, enhanced navigation for 3D graphs, tools for saving and loading templates, a new settings dialog, as well as support for arbitrary fill templates, graph cloning, and the saving and printing of 3D graphs, vertical and horizontal panel grouping.
Source: opennet.ru
