

The release of the free and open-source monitoring system Zabbix 6.0 LTS has occurred. The 6.0 release is classified as a long-term support (LTS) version. For users on non-LTS versions, we recommend upgrading to the LTS version of the product. Zabbix is a universal system for monitoring performance and availability servers, engineering and network equipment, applications, databases, virtualization systems, containers, IT services, web services, and cloud infrastructure.
The system implements a full cycle from data collection, processing and transformation, analysis of this data to identify issues, and ends with data storage, visualization, and dispatching alerts using escalation rules. Additionally, the system provides flexible capabilities for extending data collection and alerting methods, as well as automation options through a powerful API. A unified web interface enables centralized management of monitoring configurations and role-based access rights distribution for various user groups. The project code is distributed under the GPLv2 license.
Key improvements in version 6.0 LTS:
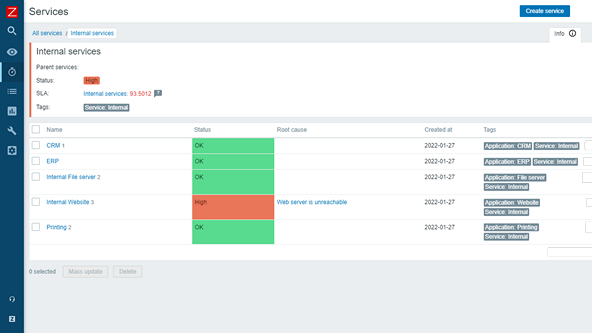
- Support for a scalable resource-service model that includes SLA reports and widgets, alerts upon service status changes, a flexible rights system, complex status calculation rules for services, problem mapping with tags and scalability to over 100,000 services.

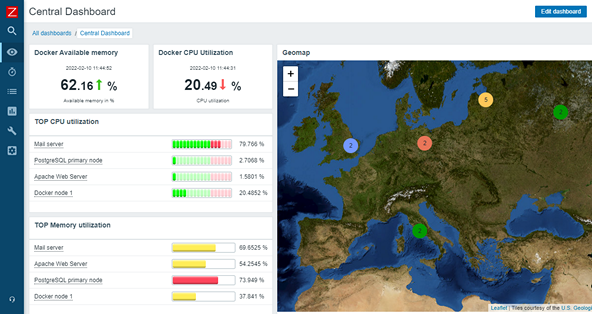
- Support for new widgets 'Top hosts', 'Item value', 'Geo map'.

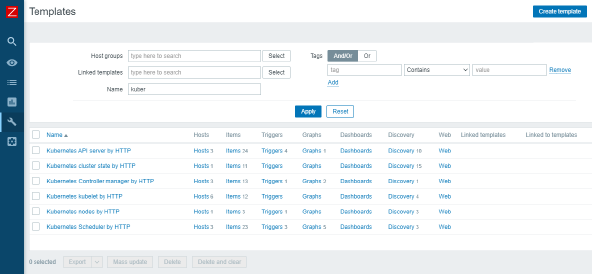
- Out-of-the-box Kubernetes monitoring.

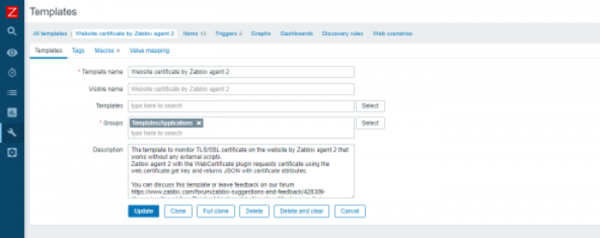
- Support for monitoring SSL and TLS certificate parameters.

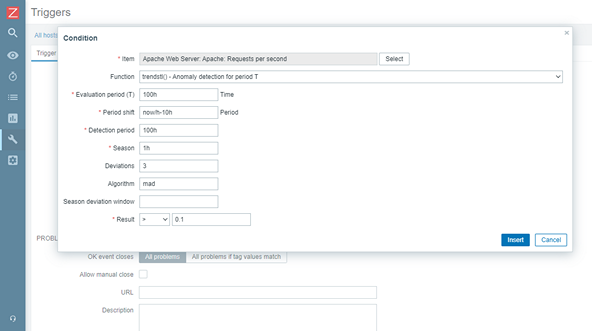
- A set of machine learning features for anomaly detection and baseline monitoring: trendstl(), baselinewma(), and baselinedev().

- Support for loading third-party plugins for Zabbix agent.
- Enhanced monitoring of VMWare.
- Support for calculated text metrics.
- Minimized dependencies between templates; all official templates are now flat and without third-party dependencies.
- Ability to disable 'escalation cancelled' messages.
- Support for preserving the monitoring status of files on the agent for highly reliable log file monitoring.
- Ability to update the list of custom metrics without restarting the agent.
- Using unique keys in historical tables to reduce data volume
- Support for macros to display trigger expressions with expanded values
- Support for root-cause analysis including macros for alerts
- Improved security and reliability of monitoring through:
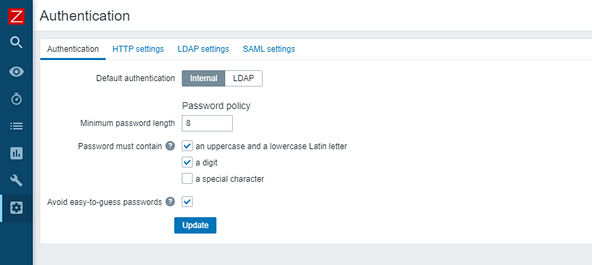
- Support for password complexity policies and dictionary comparison

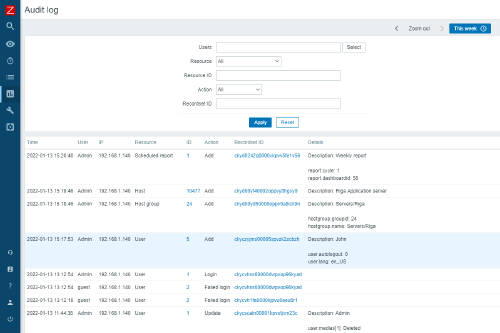
- High-performance and improved audit log, including on the Zabbix server side

- Capabilities for process management server, proxies and agents from the command line
- Support for password complexity policies and dictionary comparison
- Improved performance and reliability due to:
- Support for a reliable and user-friendly HA Cluster for the Zabbix server
- Isolating ODBC pollers into a separate class with the ability to control their number
- Performance improvements and reduced memory usage during configuration synchronization on the proxy
- Support for proxy configurations up to 16GB
- Other significant improvements:
- Support for utf8mb4 for MySQL and MariaDB
- Support for compression for WEB monitoring
- New API method for clearing history history.clear
- Support for timeout for zabbix_sender and zabbix_get utilities
- Support for additional HTTP methods for Web hooks
- Expansion of existing and support for new agent-side metrics: agent.variant, system.hostname, docker.container_stats, vmware.hv.sensors.get, vmware.hv.maintenance
- New trigger functions changecount(), rate(), bucket_rate_foreach(), bucket_percentile(), histogram_quantile(), monoinc() and monodec()
- Support for new aggregation functions count, exists_foreach and item_count
- Support for new matching operators for Prometheus != and !~
- Numerous changes to simplify the interface

- Saved and fast filters in 'Latest data' and for graphs, simplifying navigation
- New templates and integrations:
- New template solutions for monitoring pfSense, Kubernetes, Oracle, Cisco Meraki, Docker, Zabbix Server Health, VeloCloud, MikroTik, InfluxDB, Travis CI, Github, TiDB, SAF Tehnika, GridGain, Nginx+, jBoss, CloudFlare
- A new set of tags for all official templates
- Zabbix offers integration with:
- Support for service platforms Jira, Jira ServiceDesk, Redmine, ServiceNow, Zendesk, OTRS, Zammad, Solarwinds Service Desk, TOPdesk, SysAid, iTOP, ManageEngine Service Desk
- User alert systems Slack, Pushover, Discord, Telegram, VictorOps, Microsoft Teams, SINGNL4, Mattermost, OpsGenie, PagerDuty, iLert, Signal, Express.ms, Rocket.Chat
- A complete list of over 500 templates and integrations
Official packages are available for the latest versions of the following platforms:
- Linux distributions RHEL, CentOS, Debian, SuSE, Ubuntu, Raspbian for various architectures
- virtualization systems based on VMWare, VirtualBox, Hyper-V, XEN
- Docker
- agents for all platforms including MacOS and MSI packages for Windows agents
Fast installation of Zabbix available for cloud platforms: AWS, Azure, Google Cloud, Digital Ocean, IBM/RedHat Cloud, Linode, Yandex Cloud.
To upgrade from earlier versions, only the installation of new binary files (server and proxy) and the new interface is required. Zabbix will automatically handle the upgrade process. No new agents need to be installed.
Source: opennet.ru
