

The release of the open-source monitoring system Zabbix 7.0 has taken place, which is classified as a version with an extended official support period (LTS). Zabbix is a universal system for monitoring the performance and availability of servers, engineering and network equipment, applications, databases, virtualization systems, containers, IT services, web services, and cloud infrastructure.
The system implements a full cycle from data collection, processing and transformation, analysis of this data for problem detection, to data storage, visualization, and sending alerts using escalation rules. The system also provides flexible capabilities for extending data collection and alerting methods, as well as options for automation through a powerful API. A unified web interface enables centralized management of monitoring configurations and role-based access rights distribution among various user groups.
Starting from version 7.0, the project code is distributed under the AGPLv3 license, instead of the GPLv2 license. A unique feature of the AGPLv3 license is the introduction of additional restrictions for applications that provide the functioning of network services. When using AGPL components in network services, the developer is obliged to provide the user with the source code of all modifications made to these components, even if the underlying service software is not distributed and is used exclusively within internal infrastructure to organize the service's operation. Furthermore, the AGPLv3 license is only compatible with GPLv3, which leads to licensing conflicts with applications distributed under the GPLv2 license; for example, distributing a library under AGPLv3 requires all applications using this library to distribute their code under the AGPLv3 or GPLv3 license.
Official packages have been prepared for Linux distributions Alma Linux, CentOS, Debian, OpenSUSE, Oracle Linux, Raspberry Pi OS, RedHat Enterprise Linux, Rocky Linux, SUSE Linux Enterprise Server, Ubuntu; virtualization systems based on VMWare, VirtualBox, Hyper-V, XEN; Docker; OpenStack Nova. A quick installation option for Zabbix is provided on cloud platforms AWS, Azure, Google Cloud, Digital Ocean, IBM/RedHat Cloud, Oracle Cloud, and Yandex Cloud. To upgrade from earlier versions, only the installation of new binary files is necessary.server and the proxy) and the new interface (Zabbix will automatically carry out the update procedure, installation of new agents is not required).
Key improvements in version 7.0 LTS:
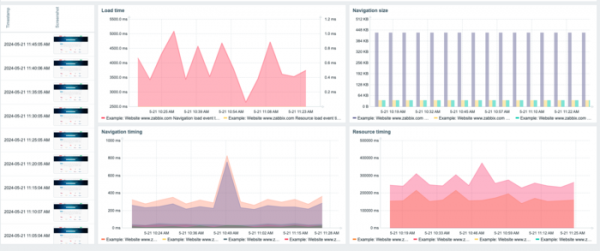
- Synthetic monitoring mode for websites and web applications with browser engine engagement and the use of complex scripts. It is possible to create screenshots of the website state, visualize performance, and extract and monitor application-specific data.

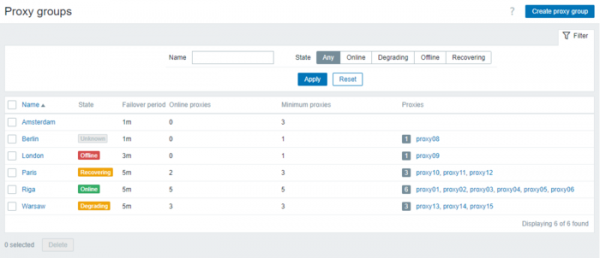
- Support for proxy clusters and load balancing across multiple servers and the use of balancers to ensure the operation of highly available Zabbix configurations. Scaling of existing Zabbix-based solutions is supported through the deployment of additional proxy servers.

- Increased performance and efficiency of proxies due to storing collected metrics in memory without intermediate disk saving. A hybrid scheme is possible where data is buffered in memory while also being saved to disk.
- Enhanced scalability and speed of data collection—metrics polling is now performed asynchronously, allowing the next metric to be requested without waiting for the processing of the previous request. Each poller supports up to 1000 concurrent checks. Asynchronous polling can be applied to agents and handlers using SNMP and HTTP.
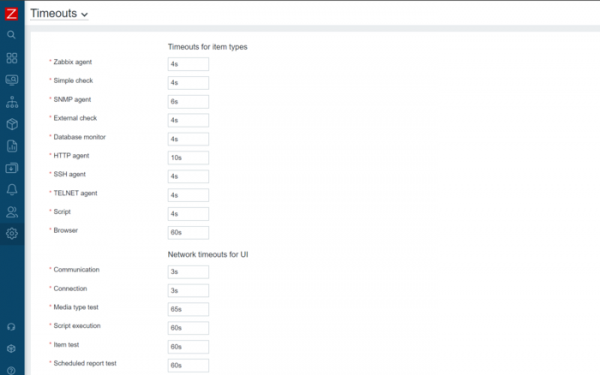
- Centralized timeout settings have been provided, accessible through GUI and API, allowing separate timeouts to be defined in relation to specific items or to override timeouts at the proxy level.

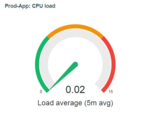
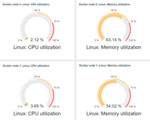
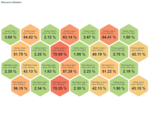
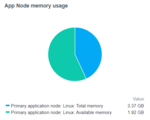
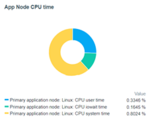
- New widgets have been added for visualizing metrics and infrastructure status (‘Host navigator’, ‘Honeycomb’, ‘Pie chart’, ‘Gauge’, ‘Top triggers’, ‘Item history’). Dynamic navigation through widgets in the dashboard mode has been implemented, using the interaction of widgets to influence actions with one widget on others (for example, information about a host selected in one widget can be shown in widgets visualizing geographical location). The ability to automatically update widgets when the data source changes has also been added. All widgets can be used for host templates. Support for aggregated values has been implemented for many widgets.

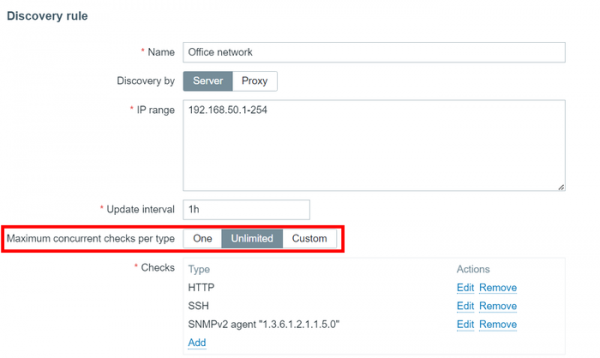
- The speed of host availability detection in networks has been significantly increased (10-100 times) thanks to the parallelization of checks.

- Support for two-factor authentication using one-time passwords (TOTP, Time-Based One-Time Password) has been added.
- Verification of configuration files has been implemented.
- The flexibility of host detection in complex environments, such as VMware and Kubernetes, has been enhanced.
- Frontend performance has been improved by changing the access rights verification logic.
- Most forms have been converted to work in modal mode.
- Instant response to the transition of monitoring elements to maintenance has been ensured.
- Ready-made templates and handlers have been added for NextCloud, Google Cloud Platform, Microsoft Azure Cost Management, Azure Cosmos DB for MongoDB, Amazon Elastic Container, Oracle Cloud Infrastructure, Microsoft SQL, CheckPoint Quantum Security Gateway, Fortinet FortiGate, HPE iLO, Cisco SD-WAN, HashiCorp Nomad, PostgreSQL (ODBC), OpenStack Nova, Acronis Cyber Protect Cloud, YugabyteDB, Ansible Webhook, Mantis Bug Tracker.
- Integration with support platforms Jira, Jira ServiceDesk, Redmine, ServiceNow, Zendesk, OTRS, Zammad, Solarwinds Service Desk, TOPdesk, SysAid, iTOP, ManageEngine Service Desk, user notification systems Slack, Pushover, Discord, Telegram, VictorOps, Microsoft Teams, SINGNL4, Mattermost, OpsGenie, PagerDuty, iLert, Signal, Express.ms, Rocket.Chat has been provided. A total of over 500 templates and integrations are available.
- DNS monitoring capabilities have been significantly expanded.
- The sending of automatically generated PDF reports has been classified as stable. Support for multi-page dashboards has been implemented for PDF reports.
- The streaming capability for sending metrics and events to external systems has been stabilized.
- The ability to suspend data collection from lost elements during auto-discovery has been added.
- Support for tags for webhooks for internal events has been introduced.
- Duplicate engineID detection in SNMP monitoring has been implemented.
- The ability to use custom input when executing scripts has been added.
- The interaction protocol between all Zabbix components has been improved.
- The ability to use custom macros in element names has been restored.
- Support for macro functions has been added for all built-in macros.
- The history.push method has been added. Support for trigger functions jsonpath and xmlpath has been implemented.
- The ability to execute scripts on the active agent has been added.
- Support for binary data types and new trigger functions has been implemented.
- Data processing from Prometheus has been significantly accelerated.
Source: opennet.ru
