

The release of the Xenoeye Netflow/IPFIX/sFlow Collector 25.02 has been published. The collector allows collecting traffic flow statistics from various network devices transmitted using Netflow v5, v9, IPFIX, and sFlow protocols, processing the data, generating reports, and creating graphs. The core of the project is written in C, and the code is distributed under the ISC license.
The collector aggregates network traffic based on selected fields and exports the data to PostgreSQL. Reports and graphs can be constructed from this data (using gnuplot, or scripts in Python + Matplotlib) or dashboards in Grafana. Additionally, the collector can execute custom scripts when thresholds are exceeded or when traffic drops below thresholds.
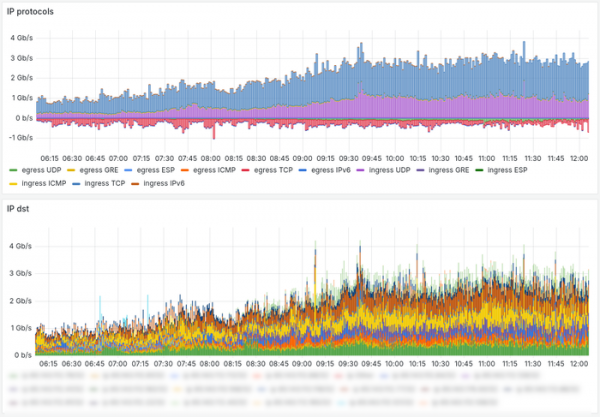
To calculate the current traffic speed, sliding averages are used. The mechanism that monitors threshold breaches is designed to alert about DoS/DDoS attacks and trigger suppression using BGP announcements (Flowspec or Blackhole). Included with the collector is an example of a Telegram bot script that can notify the messenger about anomalies. The collector is not resource-intensive and can process traffic from small networks on a Raspberry/Orange Pi or in a virtual machine with 2-4GB of RAM.
Changes in the new version:
- Support for the sFlow protocol has been added, which includes the ability to parse the payload of network packets and extract information about DNS and TLS (HTTPS) SNI. Hosting providers and data center owners can use this capability to combat phishing and assess which domains and websites are hosted on the network.
- Support for nested/hierarchical monitoring objects has been added, which simplifies some configurations with a large number of objects and improves processing performance compared to a 'flat' list of monitoring objects.
- The ability to classify interfaces has been added — traffic from selected network interfaces of routers or switches can be ignored or processed in a special way.
- It is now possible to monitor not only traffic spikes but also drops below thresholds, which can be useful for indirect monitoring of individual servers or services.
- The ability to change traffic thresholds without restarting the collector has been added. This mechanism is designed for situations where users automatically calculate thresholds based on statistics from previous periods and periodically update the thresholds in the collector.
- An LXC container has been added for rapid deployment and testing of the collector. The container includes the collector with pre-installed monitoring objects, PostgreSQL, and Grafana.
Source: opennet.ru
