

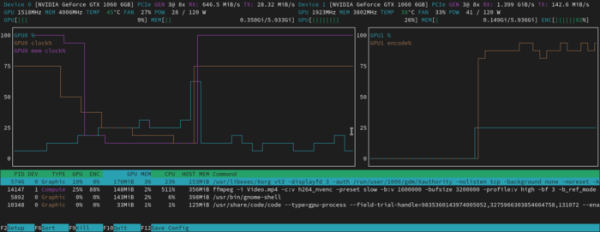
The release of the console utility nvtop 3.2.0 has been published, designed for interactive monitoring of GPU and hardware accelerators. The utility allows for visual tracking of load, memory consumption, and changes in GPU frequency through graphs, as well as viewing processes that heavily utilize the GPU. It supports GPUs and accelerators from companies like AMD, Intel, NVIDIA, Apple (M1 & M2), Huawei (Ascend), Qualcomm, and Broadcom (VideoCore). It is possible to monitor multiple chips on one screen.
The new version introduces support for Intel XE and Broadcom V3D (Raspberry Pi) drivers. Added support for Google's AI accelerator TPU (Tensor Processing Unit). Options "-P" and "-s" have been added to hide the section with the process list and to save the state in JSON format.
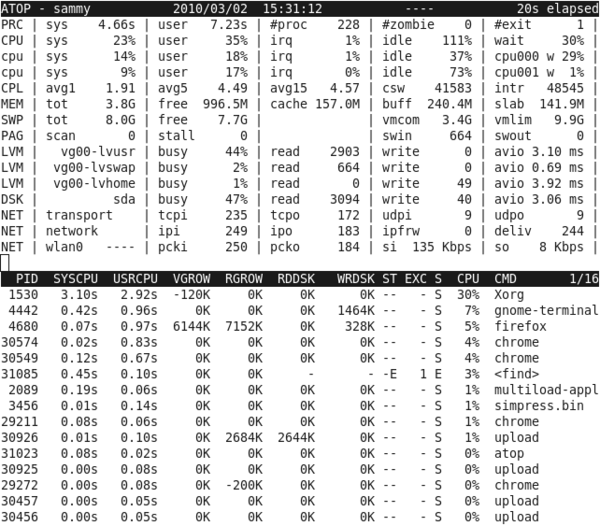
At the same time, the utility Atop 2.11.1 has been released, designed for interactive monitoring of system performance parameters and displaying process activity. Unlike the top utility, Atop offers greater detail (CPU, GPU, memory, disks, network, threads, containers) and the ability to periodically write reports to a file for later analysis. The code is written in C and is distributed under the GPLv2 license.
The new version fixes a vulnerability (CVE-2025-31160) that allows a local user to cause a buffer overflow when the Atop utility is run by another user. For example, an unprivileged user can launch an attack on an administrator running the Atop utility. The issue arises because Atop optionally supports gathering statistics about GPU performance, which is handled in a separate Atopgpud process. Interaction with this process occurs through a TCP port. When starting, Atop attempts to connect to this TCP port and periodically loads statistics through it without adequately checking the size of the transmitted data.
The attack method involves any user in the system being able to launch their handler on the network port atopgpud, which will output data of a deliberately larger size, leading to a buffer overflow in atop when attempting to parse statistics. The potential to create a working exploit for executing code has not yet been demonstrated. In the new version of atop, the collection of statistics via TCP port is disabled by default, and the option "-k" has been added to activate support for atopgpud. Additional checks have also been added to the statistics parsing code to prevent overflows.
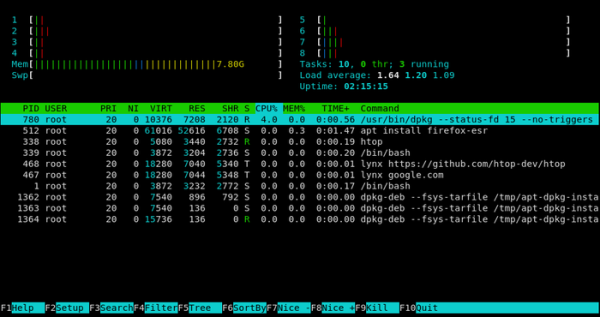
In conclusion, it is worth noting the release of the top-like utility htop 3.4.0, notable for features such as free vertical and horizontal scrolling of the process list, tools for assessing SMP performance and usage of each CPU core, the presence of a tree view mode, flexible interface customization options, support for process filtering and management (termination, priority adjustment). The project's code is written in C and is distributed under the GPLv2 license.
The new version adds tracking of GPU activity in Linux; improves performance on Apple ARM computers; resolves build issues for DragonFlyBSD, Darwin, NetBSD, OpenBSD, and Solaris; accounts for disk and network activity in DragonFlyBSD; adds information about threads and process states in macOS; expands Unicode support; revamps code for working with temperature sensors; enhances the performance of statistics parsing code; adds support for hiding cache and buffer data.
Source: opennet.ru
