

Brendan Gregg, one of the developers of the dynamic debugging system DTrace, currently working at Intel and developing tools for performance analysis based on eBPF in the Linux kernel, announced the release of the open-source toolkit iaprof (AI Flame Graphs). The toolkit is designed to analyze Intel GPU performance information and visually represent it. The code is written in C and is licensed under Apache 2.0.
Supported hardware platforms include Intel Arc graphics cards based on the Battlemage microarchitecture (series 'B'), Max series data center GPUs, and various Intel Xe2 graphics cards, including those based on the iGPU Lunar Lake. The system requires a Linux kernel with up-to-date drivers for Intel GPUs (for Intel Battlemage, a 6.15 kernel and Xe driver are required, while for Intel Max Series, a 5.15 kernel and i915 driver are sufficient). The Linux kernel must be built with Intel-specific driver interfaces EU Stall and EU Debug.
Collected profiles reflect delays in the execution units, CPU status, and information about GPU cores. The gathered information allows correlating GPU performance metrics with code running on the CPU. In practice, the toolkit is convenient for analyzing the performance of computer games and AI applications heavily utilizing the GPU, correlating GPU load with the execution of OS kernel components, runtime libraries, and AI frameworks on the CPU.
Profiling results can be saved in SVG format for interactive analysis in a browser (example), using colored 'FlameGraph' charts and 'FlameScope' maps highlighting problem areas. The graphs are interactive and allow zooming in on the stack frames and executed GPU instructions, viewing details, and performing searches.
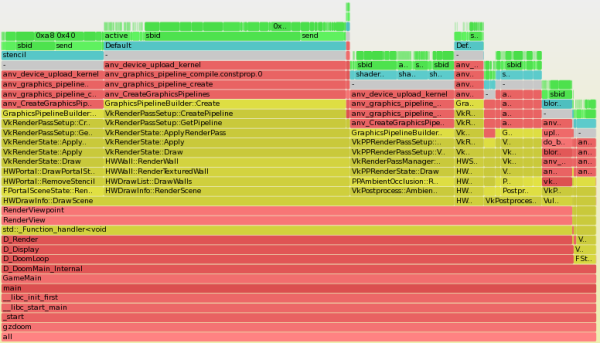
Source: opennet.ru
