

Sometimes, to solve a problem, you just need to look at it from a different angle. Even if the same issues have been addressed in the same way over the past ten years with varying results, it doesn't mean that this approach is the only one.
There is a concept known as customer churn. It's an inevitable issue, as clients of any company may stop using its products or services for various reasons. Naturally, for a company, churn is a natural but undesirable phenomenon, so everyone tries to minimize it. Even better—anticipating the likelihood of churn for a certain category of users or a specific user and proposing measures to retain them.
It's essential to analyze and attempt to retain customers if possible, for at least the following reasons:
- acquiring new customers is more expensive than retention procedures.Acquiring new customers typically requires a financial investment (advertising), while existing customers can be reactivated with special offers and conditions.
- understanding the reasons behind customer departures is key to improving products and services..
There are standard approaches to predicting churn. However, at one of the AI championships, we decided to try using the Weibull distribution for this purpose. It's most commonly used in survival analysis, weather forecasting, disaster analysis, industrial engineering, and similar fields. The Weibull distribution is a specific distribution function parameterized by two parameters.  and
and  .
.
Wikipedia
Overall, it's an interesting concept, but it's not frequently applied for predicting churn, or even in fintech in general. Below, we will explain how we (the Laboratory of Intelligent Data Analysis) accomplished this, while also winning gold at the Artificial Intelligence Championship in the 'AI in Banking' category.
About churn in general.
Let's take a look at what customer churn is and why it is so important. A customer base is vital for a business. New customers enter this base, for example, by learning about a product or service from advertising, live for some time (actively using the products), and after a while, they stop using them. This period is referred to as the “Customer Lifecycle,” a term describing the stages a customer goes through when they first learn about a product, make a purchase decision, pay, use it, become a loyal consumer, and ultimately stop using it for various reasons. Accordingly, churn is the final stage of the customer lifecycle, when a customer stops using the services, meaning they've ceased to bring profit and any benefit to the business.
Every bank customer is an individual who chooses a specific bank card tailored to their needs. If they travel often, they might benefit from a mileage card. If they make a lot of purchases, a cashback card is welcome. If they buy a lot in specific stores, there’s even specific partner plastic for that. Of course, sometimes a card is chosen based on the criterion of 'the cheapest service.' Overall, there are plenty of variables here.
Moreover, a person chooses the bank itself — what's the point of selecting a card from a bank with branches only in Moscow and the surrounding areas when you are from Khabarovsk? Even if that bank’s card offers twice the benefits, the availability of branches nearby remains an important criterion. Yes, it's 2019 and digital is everything for us, but some issues with certain banks can only be resolved in person at a branch. Plus, a portion of the population trusts a physical bank much more than a smartphone app, and this also needs to be considered.
As a result, there can be numerous reasons for a person to abandon a bank's products (or the bank itself). They change jobs, and their card's tariff shifts from a salary card to a 'For Ordinary Mortals' one, which is less advantageous. They move to another city where there are no branches of the bank. They had a poor experience with an unqualified teller at the branch. Thus, there could be even more reasons to close an account than to use the product.
Additionally, a client can express their intention not just by visiting the bank and submitting an application, but simply by stopping to use the products without terminating the contract. To understand such situations, it was decided to use machine learning and AI.
Moreover, client churn can occur in any industry (telecom, internet providers, insurance companies, basically anywhere there's a customer base and periodic transactions).
What We Did
First and foremost, we needed to define a clear boundary — at what point we start considering a client to be inactive. From the perspective of the bank that provided us with the data, client activity was binary — either they are active or not. There was an ACTIVE_FLAG in the 'Activity' table, which could either be '0' or '1' (representing 'Inactive' and 'Active', respectively). This was fine, but humans can be active for a time and then become inactive for a month — they might fall ill, travel abroad for vacation, or even start testing a different bank's card. They might also resume their banking activities after a long period of inactivity.
Therefore, we decided to define a period of inactivity as a continuous interval during which the flag was set to '0'.
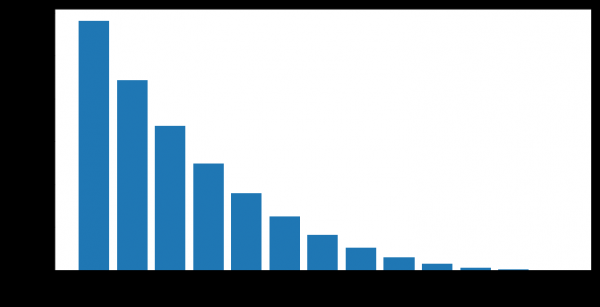
Clients switch from inactive to active after various lengths of inactivity. We can now calculate the empirical measure of 'reliability of inactivity periods' — that is, the likelihood that a person will resume using the bank's products after a period of inactivity.
For example, this graph shows the resumption of activity (ACTIVE_FLAG=1) of clients after several months of inactivity (ACTIVE_FLAG=0).
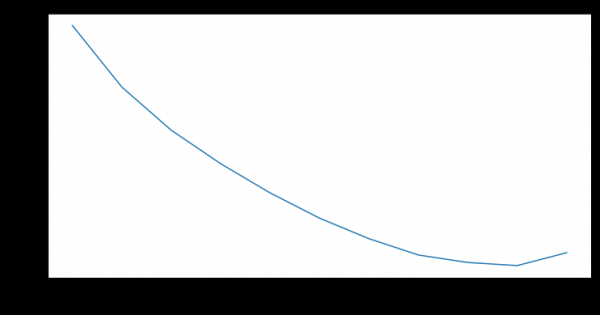
Here, we will refine the dataset we have started working with. So, the bank provided aggregated information over 19 months in the following tables:
- 'Activity' — monthly transactions of clients (via cards, in online banking, and mobile banking), including salary accruals and turnover information.
- 'Cards' — data about all cards held by a client, with a detailed tariff grid.
- "Contracts" - information about the client's contracts (both open and closed): loans, deposits, and more, specifying the parameters of each.
- "Clients" - a set of demographic data (gender and age) and the availability of contact information.
We needed all the tables for work, except for "Cards."
The challenge here was that the bank did not indicate what specific activity occurred on the cards. In other words, we could determine if there were transactions or not, but we couldn't identify their type. Therefore, it was unclear whether the client withdrew cash, received a salary, or spent money on purchases. Additionally, we did not have data on account balances, which would have been useful.
The sample itself was unweighted - during this slice of 19 months, the bank made no attempts to retain clients and minimize churn.
So, about the periods of inactivity.
To formulate the definition of churn, we need to choose a period of inactivity. To create a churn forecast at a given moment in time,  , it is necessary to have at least 3 months of client history over the interval
  . Our history was limited to 19 months; therefore, we decided to take the period of inactivity as 6 months, if it exists. For a quality forecast, we took a minimum period of 3 months. The figures of 3 and 6 months were determined empirically based on the analysis of these clients' behavior.
We formulated the definition of churn as follows: the month of client churn  is the first month with ACTIVE_FLAG=0, where from that month, there are at least six zeros in a row in the ACTIVE_FLAG field; in other words, the month from which the client was inactive for 6 months.
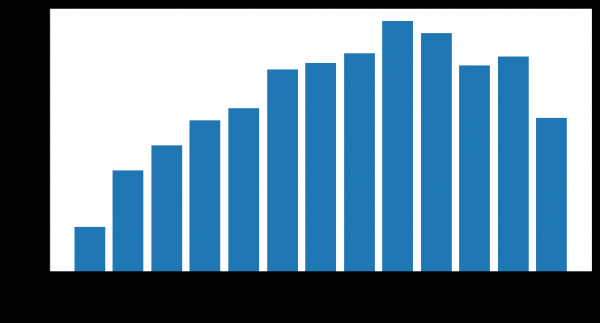
The number of lost clients
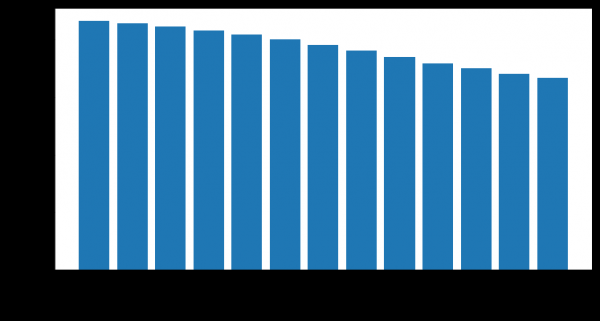
The number of remaining clients
As is commonly believed, churn
In such competitions, and generally in practice, churn is often forecasted this way. A client uses products and services at different intervals; the data on interactions is represented as a fixed-length feature vector of length n. Most often, this information includes:
- User characterizing data (demographic data, marketing segment).
- The history of using banking products and services (these are client actions, which are always tied to a specific time or period of the required interval).
- External data, if obtained — for example, reviews from social media.
After this, they derive a definition of churn specific to each task. Then they use a machine learning algorithm to predict the likelihood of customer departure.  based on a vector of factors.
  To train the algorithm, they use one of the well-known frameworks for building ensemble decision trees, , , or their modifications.
The algorithm itself is decent, but it has several serious shortcomings specifically in forecasting churn.
- It does not have what is called 'memory'.A fixed number of features corresponding to the current moment are input into the model. To incorporate information about the history of parameter changes, it is necessary to calculate special features characterizing temporal changes, such as the number or sum of bank transactions over the past 1, 2, or 3 months. This approach can only partially reflect the nature of temporal changes.
- Fixed forecasting horizon. The model is capable of predicting customer churn only for a predetermined time interval, for instance, a forecast for one month ahead. If a forecast is needed for another time period, say three months, the training sample must be rebuilt and a new model retrained.
Our approach
We decided right away that we would not use standard approaches. In the championship, 497 other participants registered, each with considerable experience. Therefore, trying to follow a standard scheme in such conditions is not the best idea.
We began addressing the challenges facing the binary classification model by predicting the probabilistic distribution of customer churn timing. This approach allows for more flexible churn forecasting and testing of more complex hypotheses than in the classical approach. As a family of distributions modeling churn time, we chose the due to its wide application in survival analysis. Customer behavior can be viewed as a kind of survival.
Here are examples of Weibull probability density distributions based on parameters  and
and  :
:
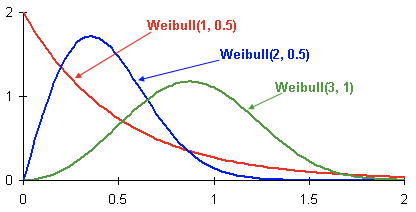
This is the probability density of customer churn for three different clients over time. Time is represented in months. In other words, this graph shows when it is most likely that customer churn will occur within the next two months. As can be seen, the client with this distribution has a greater potential to leave earlier than clients with Weibull(2, 0.5) and Weibull(3, 1) distributions.
The result is a model that predicts Weibull distribution parameters for each client for any
month, best reflecting the probability of churn over time. To elaborate:
- The target features in the training dataset are the time remaining until churn in a specific month for a specific client.
- If there is no churn indicator for a client, we assume that the churn time is greater than the number of months from the current date to the end of the history we have.
- The model used: recurrent neural network with an LSTM layer.
- We use the negative log-likelihood function as the loss function for the Weibull distribution.
Here are the advantages of this method:
- The probability distribution, aside from the obvious binary classification capability, allows for flexible predictions of different events, such as whether a client will stop using the bank's services within 3 months. Additionally, various metrics can be averaged based on this distribution if needed.
- The LSTM recurrent neural network has memory and effectively utilizes all available history. With expansion or refinement of the history, accuracy increases.
- This approach can be easily scaled when breaking time intervals into smaller ones (for example, breaking months into weeks).
However, it is not enough to create a good model; its quality must also be properly assessed.
How quality was assessed
We chose the Lift Curve as the metric. It is used in business for similar cases due to its understandable interpretation, and it is well-described and . To summarize the meaning of this metric in one sentence, it would be "By how much does the algorithm make better predictions in the top  % compared to random chance."
We train the models
The competition conditions did not establish a specific quality metric for comparing various models and approaches. Moreover, the definition of churn can vary and depend on the task at hand, which in turn is defined by business objectives. Therefore, to understand which method is better, we trained two models:
- A commonly used binary classification approach utilizing a machine learning algorithm based on an ensemble of decision trees ();
- Weibull-LSTM Model
The test sample consisted of 500 pre-selected clients who were not part of the training sample. Hyperparameter tuning for the model was performed using cross-validation based on the clients. The same feature sets were used for training each model.
Since the model does not have memory, specific features were used to show the relationship between parameter changes in one month to the average values of parameters over the last three months. This characterized the speed of change in values over the last three months. Without this, the Random Forest-based model would be at a disadvantage compared to Weibull-LSTM.
How Weibull-LSTM outperforms the decision trees ensemble approach
Here everything is clearly illustrated with just a couple of images.
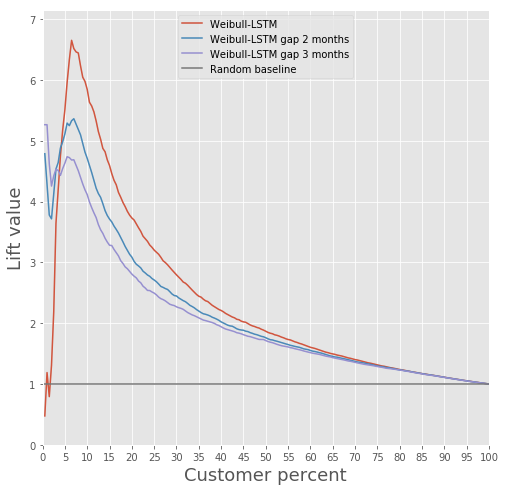
Lift Curve comparison for the classical algorithm and Weibull-LSTM
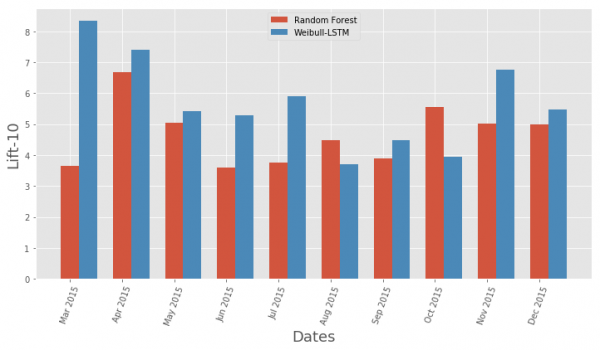
Comparison of Lift Curve metrics by month for the classical algorithm and Weibull-LSTM
Overall, LSTM outperforms the classical algorithm in almost all cases.
Churn Prediction
The model based on a recurrent neural network with LSTM cells using Weibull distribution can predict churn in advance, for example, predicting customer departure within the next n months. Let's consider the case for n = 3. In this case, for each month, the neural network must correctly determine whether the customer will leave, starting from the next month up to the n-th month. In other words, it must correctly determine if the customer will remain after n months. This can be considered a forecast in advance: predicting the moment when a customer has just started thinking about leaving.
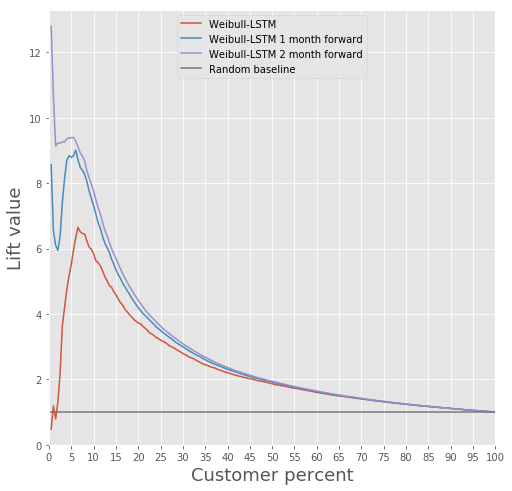
Let's compare the Lift Curve for Weibull-LSTM at 1, 2, and 3 months before churn:
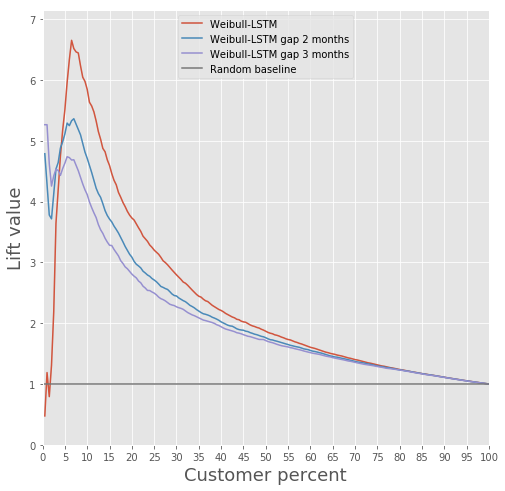
As mentioned earlier, the forecasts that are made for clients who are inactive for a period of time are also important. Therefore, we will include cases when a departing client has been inactive for one or two months, and we will check to ensure that the Weibull-LSTM properly classifies such cases as churn. Since such cases were present in the dataset, we expect the network to handle them well:
Customer Retention
Essentially, this is the main action that can be taken if you have information indicating that certain clients are about to stop using the product. When it comes to building a model that could offer something useful to customers to retain them — this cannot be accomplished if you lack a history of similar attempts that ended positively.
We did not have such a history, so we decided to approach it this way.
- We are building a model to identify interesting products for each client.
- Every month, we run the classifier and identify potentially departing clients.
- We offer a product to some clients based on the model from point 1, recording our actions.
- After several months, we examine who among these potentially departing clients has left and who has stayed. This way, we create a training dataset.
- We train the model on the history obtained in point 4.
- Optionally, we repeat the procedure, replacing the model from point 1 with the model obtained in point 5.
A common method for assessing the quality of such retention can be standard A/B testing — we divide potentially departing clients into two groups. One group is offered products based on our retention model, while the other is not offered anything. We decided to train a model that could bring benefits right from point 1 of our example.
We wanted to make segmentation as interpretable as possible. For this, we chose several features that could be easily interpreted: total number of transactions, salary, total turnover on the account, age, gender. The features from the 'Cards' table were not considered as they provided little information, and the features from table 3 'Contracts' were excluded due to the complexity of processing to avoid data leakage between the validation set and the training set.
Clustering was performed using Gaussian mixture models. The Akaike information criterion allowed us to identify 2 optima. The first optimum corresponds to 1 cluster. The second, less pronounced optimum corresponds to 80 clusters. Based on this result, we can conclude that it is extremely difficult to separate the data into clusters without a priori information. For more effective clustering, we need data that describes each client in detail.
Therefore, a supervised learning task was considered in order to offer each individual client their own product. The following products were considered: "Term Deposit," "Credit Card," "Overdraft," "Consumer Credit," "Auto Loan," "Mortgage."
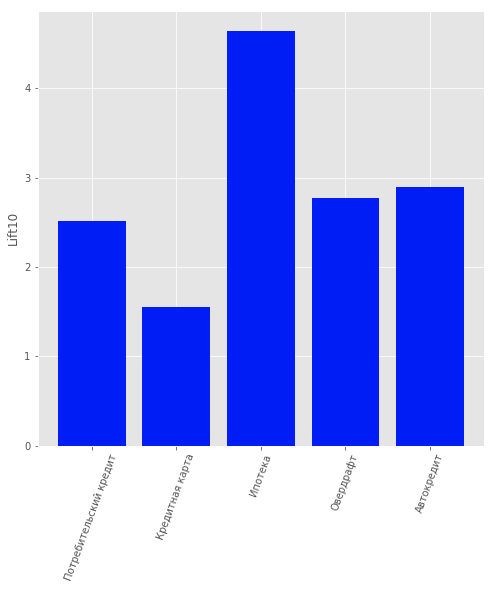
There was another type of product in the data: "Current Account." However, we did not consider it due to its low informativeness. For users who are clients of the bank, i.e., those who have not stopped using its products, a model was built to predict which product might be of interest to them. Logistic regression was chosen as the model, and Lift for the first 10 percentiles was used as the quality assessment metric.
The quality of the model can be assessed in the figure.
Product recommendation model results for clients
Summary
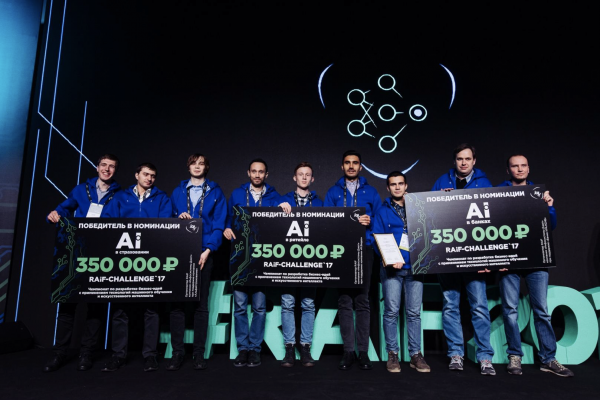
This approach earned us first place in the "AI in Banking" nomination at the RAIF-Challenge 2017 AI Championship.
Evidently, the key was to approach the problem from a less conventional angle and to use a method that is typically applied in different situations.
Although mass user churn can indeed be a disaster for services.
This method can be noted for any other field where churn is important, not just banking. For instance, we applied it to calculate our own churn rates in the Siberian and St. Petersburg branches of Rostelecom.
"Laboratory of Intelligent Data Analysis" Search Portal Company "Sputnik"
Source: habr.com
