


Note: translation.: Service mesh has certainly become a relevant solution in modern infrastructure for applications that follow microservices architecture. While Istio may be well-known to many DevOps engineers, it is a relatively new product that, being comprehensive in its capabilities, can require significant time for familiarization. German engineer Rinor Maloku, who is responsible for cloud computing for large customers at the telecommunications company Orange Networks, has written a remarkable series of materials that allow for a quick and deep dive into Istio. He begins his narrative by explaining what Istio can do and how to quickly view it for oneself.
Istio — An Open Source project developed through collaboration between teams from Google, IBM, and Lyft. It addresses the complexities that arise in applications based on microservices, such as:
- Traffic Management: timeouts, retries, load balancing;
- Security: user authentication and authorization;
- Observability: tracing, monitoring, logging.
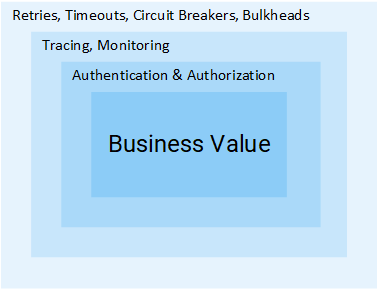
All of these can be resolved at the application level; however, doing so would cease to make your services 'micro'. All the extra effort to address these issues translates into unnecessary resource expenditure for the company, which could instead be directed towards business value. Let's consider an example:
Project Manager: How long will it take to add a feedback feature?
Developer: Two sprints.PM: What?.. It’s just CRUD!
Dev: Implementing CRUD is the easy part of the task, but we will also need to authenticate and authorize users and services. Since the network is unreliable, we will need to implement retries as well as in the clients. Additionally, to ensure that the entire system does not go down, we will need timeouts and (see further details on both patterns later in the article — note from the translator), and to detect issues, we will need monitoring, tracing, […]PM: Oh, let's just embed this feature into the Product service.
I think the idea is clear: the volume of steps and effort required to add a single service is enormous. In this article, we will explore how Istio eliminates all the aforementioned complexities (that are not core to business logic) from services.
Note: This article assumes you have practical knowledge of Kubernetes. Otherwise, I recommend reading and only after that continue reading this material.
The Idea of Istio
In a world without Istio, one service makes direct requests to another, and in case of failure, the service must handle it on its own: retry, set a timeout, open a circuit breaker, and so on.
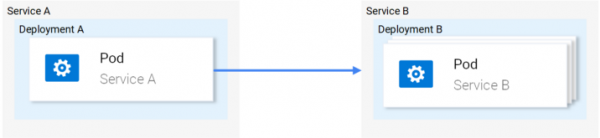
Network Traffic in Kubernetes
Istio provides a specialized solution, completely separate from services, functioning by intervening in network interactions. In this way, it implements:
- Fault tolerance: based on the response status code, it understands whether a failure occurred in the request and performs a retry.
- Canary releases: redirects a fixed percentage of requests to a new version of the service.
- Monitoring and Metrics: how long did it take for the service to respond?
- Tracing and Observability: adds special headers to each request and traces them within the cluster.
- Security: extracts the JWT token, authenticates and authorizes users.
These are just some of the capabilities (truly just a few!) to intrigue you. Now let's dive into the technical details!
Istio Architecture
Istio intercepts all network traffic and applies a set of rules by inserting a smart proxy in the form of a sidecar container into each pod. The proxies that activate all the features form the Data Plane, and they can be dynamically configured using Control Plane.
Data Plane
The proxies inserted into the pods allow Istio to easily meet our requirements. For example, let’s check the retry and circuit breaker functions.
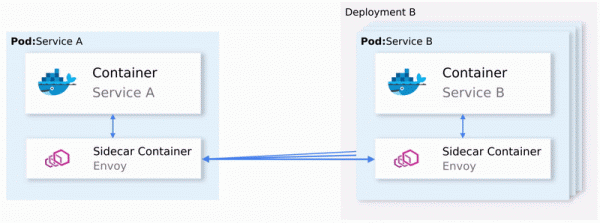
How retries and circuit breaking are implemented in Envoy
In summary:
- Envoy (referring to the proxy located in the sidecar container, which is distributed as well as - translator's note) sending a request to the first instance of service B results in a failure.
- The Envoy Sidecar attempts a retry (retry). (1)
- The failed request is returned to the proxy that initiated it.
- Thus, the Circuit Breaker is opened, and the next service is called for subsequent requests. (2)
This means you won't have to use another Retry library, nor will you need to implement your own Circuit Breaking and Service Discovery in programming languages X, Y, or Z. All of this and much more is available out of the box in Istio and requires no changes to the code.
Great! Now you might want to embark on a journey with Istio, but you still have some doubts and open questions. If this is a universal solution for all situations, you might naturally suspect: after all, such solutions tend to be unsuitable for any specific case.
And finally you might ask: “Is it configurable?”
Now you are ready for a sea voyage — let’s get acquainted with Control Plane.
Control Plane
It consists of three components: Pilot, Mixer and Citadel, — which together configure the Envoys for traffic routing, apply policies, and collect telemetry data. Schematic representation of this looks as follows:
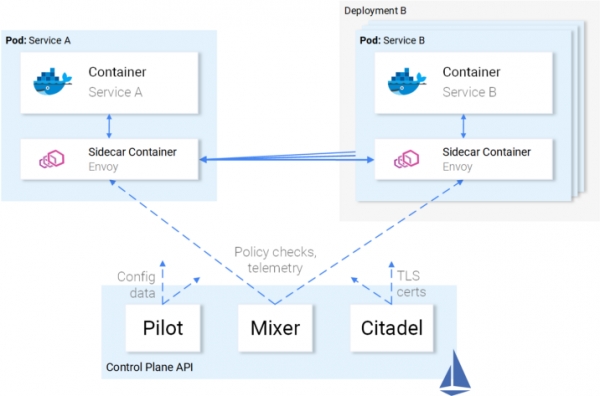
Control Plane interaction with Data Plane
The Envoys (i.e., data plane) are configured using (Custom Resource Definitions), defined by Istio and specifically designed for this purpose. For you, this means that they are represented as yet another resource in Kubernetes with a familiar syntax. After creation, this resource will be picked up by the control plane and applied to the Envoys.
Service relations to Istio
We described Istio's relationship with services, but not the reverse: how do services relate to Istio?
Honestly, services know about Istio as well as fish know about water when they ask themselves: “What exactly is water?”.

Illustration : — How’s the water? — What exactly is water?
Thus, you can take a working cluster, and after deploying Istio components, the services in it will continue to function, and once those components are removed — everything will be fine again. Of course, you will lose the capabilities provided by Istio.
Enough theory — let’s put this knowledge into practice!
Istio in practice
Istio requires a Kubernetes cluster with at least 4 vCPUs and 8 GB of RAM available. To quickly set up a cluster and follow the instructions from the article, I recommend using Google Cloud Platform, which offers new users .
After creating the cluster and configuring access to Kubernetes via the command-line tool, you can install Istio using the Helm package manager.
Installing Helm
Install the Helm client on your computer as described in . We will use it to generate templates for installing Istio in the next section.
Installing Istio
Download the Istio resources from (the original author link to version 1.0.5 has been updated to the current version, i.e., 1.0.6 — translator's note), extract the contents to a single directory, which I will refer to as [istio-resources].
For ease of identification of Istio resources, create a namespace in the K8s cluster called istio-system:
$ kubectl create namespace istio-systemComplete the installation by navigating to the directory [istio-resources] and executing the command:
$ helm template install/kubernetes/helm/istio
  --set global.mtls.enabled=false
  --set tracing.enabled=true
  --set kiali.enabled=true
  --set grafana.enabled=true
  --namespace istio-system > istio.yaml
This command will output the key Istio components to the file istio.yaml. We have modified the standard template to our needs, specifying the following parameters:
-
global.mtls.enabledset tofalse(i.e., mTLS authentication is disabled — translator's note), to simplify our introductory process; -
tracing.enabledenables request tracing using Jaeger; -
kiali.enabledinstalls Kiali in the cluster for service and traffic visualization; -
grafana.enabledinstalls Grafana for visualizing the collected metrics.
Apply the generated resources with the command:
$ kubectl apply -f istio.yamlThe installation of Istio in the cluster is complete! Wait until all pods in the namespace istio-system are in the state Running or Completed, by executing the command below:
$ kubectl get pods -n istio-systemNow we are ready to continue in the next section, where we will deploy and run the application.
Application Architecture of Sentiment Analysis
We will use the example of the microservices application Sentiment Analysis, used in the previously mentioned . It is complex enough to showcase Istio's capabilities in practice.
The application consists of four microservices:
- The service SA-Frontend, which serves the frontend of the application on Reactjs;
- The service SA-WebApp, which handles requests for Sentiment Analysis;
- The service SA-Logic, which performs the actual ;
- The service SA-Feedback, which receives feedback from users regarding the accuracy of the conducted analysis.
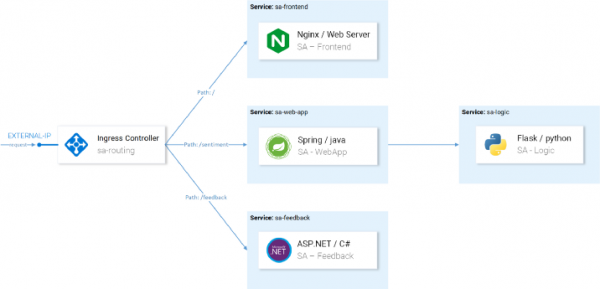
In this diagram, along with the services, we also see the Ingress Controller, which in Kubernetes routes incoming requests to the corresponding services. Istio employs a similar concept within the Ingress Gateway, details of which will follow.
Launching an application with Istio proxy
For further operations mentioned in the article, clone the repository for yourself . It contains the application and manifests for Kubernetes and Istio.
Sidecar injection
Injection can be performed of automatically or manually. For automatic injection of sidecar containers, you need to label the namespace istio-injection=enabled, which is done with the following command:
$ kubectl label namespace default istio-injection=enabled
namespace/default labeled
Now every pod that is deployed in the default namespace (default) will receive its sidecar container. To verify this, let's deploy a test application by navigating to the root directory of the repository [istio-mastery] and executing the following command:
$ kubectl apply -f resource-manifests/kube
persistentvolumeclaim/sqlite-pvc created
deployment.extensions/sa-feedback created
service/sa-feedback created
deployment.extensions/sa-frontend created
service/sa-frontend created
deployment.extensions/sa-logic created
service/sa-logic created
deployment.extensions/sa-web-app created
service/sa-web-app created
Having deployed the services, let's check that each pod has two containers (one with the service and its sidecar) by executing the command kubectl get pods and ensuring that the value under the column READY indicates that both containers are running: 2/2$ kubectl get pods NAME READY STATUS RESTARTS AGE sa-feedback-55f5dc4d9c-c9wfv 2/2 Running 0 12m sa-frontend-558f8986-hhkj9 2/2 Running 0 12m sa-logic-568498cb4d-2sjwj 2/2 Running 0 12m sa-logic-568498cb4d-p4f8c 2/2 Running 0 12m sa-web-app-599cf47c7c-s7cvd 2/2 Running 0 12m
Visually, it represents as follows:Envoy proxy in one of the pods
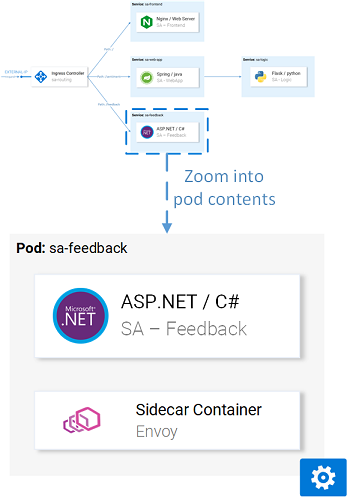
Now that the application is up and running, we need to allow incoming traffic to reach the application.
Ingress Gateway
The best practice to achieve this (allow traffic into the cluster) is through
in Istio, which is positioned at the 'boundary' of the cluster and enables incoming traffic to utilize Istio features such as routing, load balancing, security, and monitoring. The best practice to achieve this (allow traffic into the cluster) is through The Ingress Gateway component and the service that exposes it externally were installed in the cluster during the Istio installation. To find out the external IP address of the service, execute:
The Ingress Gateway component and the service that exposes it were installed in the cluster during the Istio installation. To find out the external IP address of the service, execute:
$ kubectl get svc -n istio-system -l istio=ingressgateway
NAME                   TYPE           CLUSTER-IP     EXTERNAL-IP
istio-ingressgateway   LoadBalancer   10.0.132.127   13.93.30.120
We will access the application using this IP going forward (I will refer to it as EXTERNAL-IP), so to make it easier, let's save the value in a variable:
$ EXTERNAL_IP=$(kubectl get svc -n istio-system
  -l app=istio-ingressgateway
  -o jsonpath='{.items[0].status.loadBalancer.ingress[0].ip}')
If you try to access this IP through a browser now, you will get a Service Unavailable error, because by default Istio blocks all incoming traffic, until a Gateway is defined.
Gateway Resource
A Gateway is a CRD (Custom Resource Definition) in Kubernetes, defined after installing Istio in the cluster, which enables specifying ports, protocols, and hosts for which we want to allow incoming traffic.
In our case, we want to allow HTTP traffic on port 80 for all hosts. This is implemented with the following definition ():
apiVersion: networking.istio.io/v1alpha3
kind: Gateway
metadata:
  name: http-gateway
spec:
  selector:
    istio: ingressgateway
  servers:
  - port:
      number: 80
      name: http
      protocol: HTTP
    hosts:
- "*"
This configuration does not require explanation except for the selector istio: ingressgateway. With this selector, we can specify which Ingress Gateway to apply the configuration to. In our case, it is the Ingress Gateway controller that was installed by default in Istio.
The configuration is applied by executing the following command:
$ kubectl apply -f resource-manifests/istio/http-gateway.yaml gateway.networking.istio.io/http-gateway createdNow the gateway allows access to port 80 but has no knowledge of where to route requests. For that, we need Virtual Services.
VirtualService Resource
A VirtualService instructs the Ingress Gateway on how to route requests that are allowed within the cluster.
Requests to our application arriving through http-gateway must be sent to the services sa-frontend, sa-web-app, and sa-feedback:
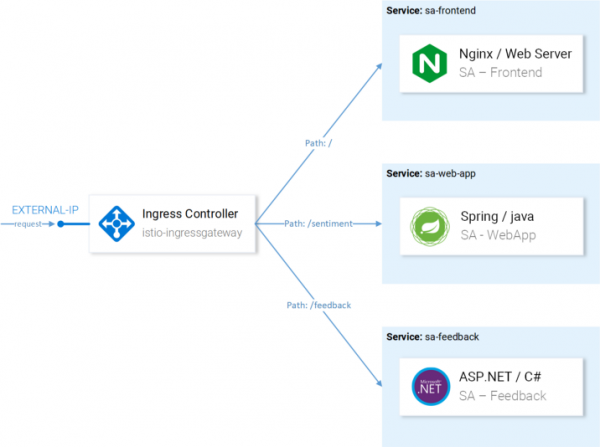
Routes that need to be configured with VirtualServices
Let's consider the requests that need to be directed to SA-Frontend:
- Exact path matches
/must be sent to SA-Frontend to fetch index.html; - Paths with a prefix
/static/*must be sent to SA-Frontend to retrieve static files used in the frontend, such as CSS and JavaScript; - Paths that match the regular expression
'^.*.(ico|png|jpg)$', must be sent to SA-Frontend, because they are images displayed on the page.
The implementation is achieved with the following configuration ():
kind: VirtualService metadata: name: sa-external-services spec: hosts: - "*" gateways: - http-gateway # 1 http: - match: - uri: exact: \ - uri: exact: \/callback - uri: prefix: \/static - uri: regex: '^.*\.(ico|png|jpg) Important points:Note: The above configuration is stored in a file
- This VirtualService pertains to requests coming through http-gateway;
- In
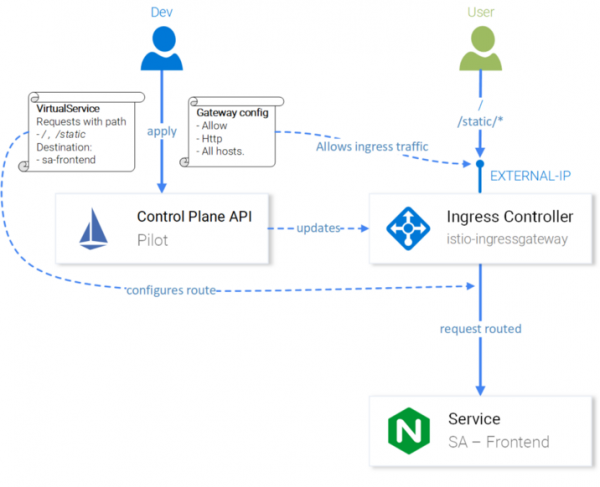
destinationit defines the service to which requests are sent.sa-virtualservice-external.yaml, which also contains settings for routing in SA-WebApp and SA-Feedback, but has been shortened here in the article for conciseness. We will apply VirtualService by calling:$ kubectl apply -f resource-manifests/istio/sa-virtualservice-external.yaml virtualservice.networking.istio.io/sa-external-services createdNote: When we apply Istio resources, the Kubernetes API Server creates an event that the Istio Control Plane receives, and only after that is the new configuration applied to the Envoy proxy servers of each pod. The Ingress Gateway controller is represented by another Envoy configured in the Control Plane. All of this looks like this in the diagram:
Istio-IngressGateway configuration for routing requestsThe Sentiment Analysis application is now available at
http://{EXTERNAL-IP}/. Don't worry if you get a Not Found status: sometimes it takes a bit longer for the configuration to take effect and for the Envoy caches to update..Before proceeding, work a little with the application to generate traffic (its presence is necessary for clarity in the subsequent actions — note by the translator).
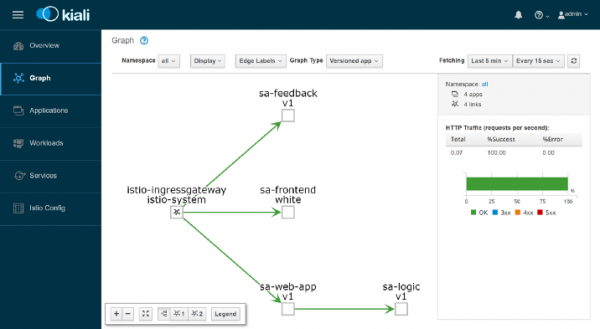
Kiali: observability
To access the Kiali administrative interface, run the following command:
$ kubectl port-forward $(kubectl get pod -n istio-system -l app=kiali -o jsonpath='{.items[0].metadata.name}') -n istio-system 20001… and open , logging in as admin/admin. Here you will find many useful features, such as checking the configuration of Istio components, visualizing services based on the information gathered from intercepted network requests, getting answers to questions like "Who is calling whom?", "Which version of the service has issues?" etc. In general, explore the capabilities of Kiali before moving on — to visualizing metrics with Grafana.
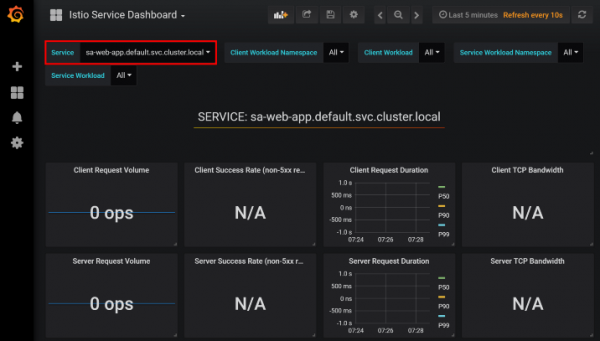
Grafana: metric visualization
Metrics collected in Istio are sent to Prometheus and visualized with Grafana. To access the Grafana administrative interface, run the command below, then open :
$ kubectl -n istio-system port-forward $(kubectl -n istio-system get pod -l app=grafana -o jsonpath={.items[0].metadata.name}) 3000Click on the menu Home at the top left and select Istio Service Dashboard in the top left corner, start with the service sa-web-app, to view the collected metrics:
Here awaits us an empty and absolutely dull presentation — management would never approve of this. So let's create a small load with the following command:
$ while true; do curl -i http://$EXTERNAL_IP/sentiment -H "Content-type: application/json" -d '{"sentence": "I love yogobella"}'; sleep .8; doneNow we have much nicer graphs, along with wonderful Prometheus tools for monitoring and Grafana for visualizing metrics, which will allow us to learn about the performance, health, and improvements/degradations in service operation over time.
Finally, let's look at request tracing in services.
Jaeger: tracing
Tracing is required because the more services we have, the harder it is to get to the root cause of a failure. Let's look at a simple case from the image below:
Typical example of a random failed requestA request comes in, fails — what is the reason? The first service? Or the second? There are exceptions in both — let's look at the logs of each. How often have you caught yourself doing such a task? Our job resembles software detectives more than developers...
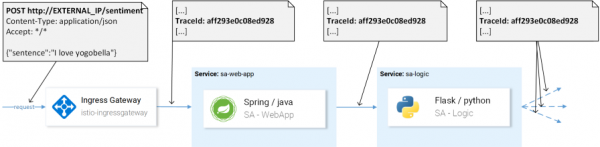
This is a common issue in microservices, and it is solved by distributed tracing systems in which services pass a unique header to each other, after which this information is redirected to the tracing system, where it is matched with the request data. Here’s an illustration:
TraceId is used to identify the requestIstio uses Jaeger Tracer, which implements a vendor-independent OpenTracing API framework. You can access the Jaeger user interface with the following command:
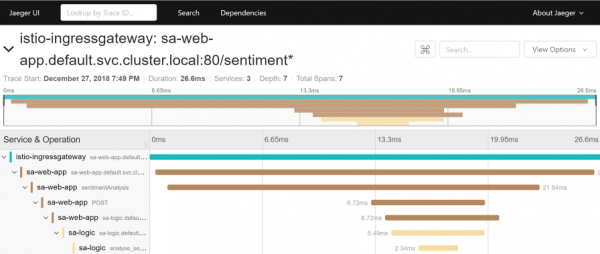
$ kubectl port-forward -n istio-system $(kubectl get pod -n istio-system -l app=jaeger -o jsonpath='{.items[0].metadata.name}') 16686Now go to and select the service sa-web-app. If the service is not shown in the dropdown menu — generate/make some activity on the page and refresh the interface. After that, click the button Find Traces, which will show the most recent traces — select any — detailed information on all traces will appear:
This trace shows:
- The request arrives at istio-ingressgateway (this is the first interaction with one of the services, and a Trace ID is generated for the request), after which the gateway directs the request to the service sa-web-app.
- In the service, sa-web-app the request is picked up by the Envoy sidecar, a 'child' is created in the span (hence we see it in the traces), and it is redirected to the container sa-web-app. ( — a logical unit of work in Jaeger, which has a name, the start time of the operation, and its duration. Spans can be nested and ordered. A directed acyclic graph of spans forms a trace. — note from the translator)
- Here, the request is processed by the method sentimentAnalysis. These traces have already been generated by the application, meaning that code changes were required.
- From this point, a POST request is initiated to sa-logic. The Trace ID must be propagated from sa-web-app.
- …
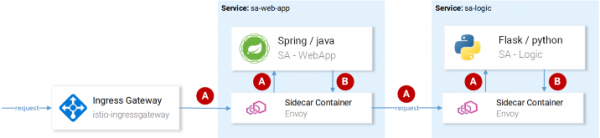
Note: At step 4, the application should see the headers generated by Istio and pass them in subsequent requests, as shown in the image below:
(A) Header propagation is handled by Istio; (B) Headers are managed by the servicesIstio does the heavy lifting as it generates headers for incoming requests, creates new spans in each sidecar, and propagates them. However, without handling headers within the services, the full trace path of the request will be lost.
The following headers must be considered (propagated):
x-request-id x-b3-traceid x-b3-spanid x-b3-parentspanid x-b3-sampled x-b3-flags x-ot-span-contextThis is not a complicated task, but for simplicity, there are already — for example, in the sa-web-app service, the RestTemplate client propagates these headers simply by adding Jaeger and OpenTracing libraries to .
Note that the Sentiment Analysis application showcases implementations in Flask, Spring, and ASP.NET Core.
Now that it’s clear what we have out of the box (or almost 'out of the box'), let's consider issues of finely-tuned routing, traffic management, security, etc.!
Note: translation.: read about this in the next part of the Istio materials by Rinor Maloku, the translations of which will follow in our blog soon. UPDATE (March 14): is already published.
P.S. from the translator
Also read in our blog:
- "Back to Microservices with Istio": , ;
- «»;
- «»;
- «»;
- «».
Source: habr.com
route:
- destination:
host: sa-frontend # 2
port:
number: 80
Key points:
- This VirtualService pertains to requests coming through http-gateway;
- In
destinationit defines the service to which requests are sent.Note: The above configuration is stored in a file
sa-virtualservice-external.yaml, which also contains settings for routing in SA-WebApp and SA-Feedback, but has been shortened here in the article for conciseness.Let’s apply VirtualService by calling:
Note: When we apply Istio resources, the Kubernetes API Server generates an event that is received by the Istio Control Plane, and only after that does the new configuration get applied to the Envoy proxies of each pod. The Ingress Gateway controller is represented by another Envoy, configured in the Control Plane. This is illustrated as follows:
Istio-IngressGateway configuration for routing requestsThe Sentiment Analysis application is now available at
http://{EXTERNAL-IP}/. Don't worry if you get a Not Found status: sometimes it takes a bit longer for the configuration to take effect and for the Envoy caches to update..Before proceeding, work a little with the application to generate traffic (its presence is necessary for clarity in the subsequent actions — note by the translator).
Kiali: observability
To access the Kiali administrative interface, run the following command:
… and open , logging in as admin/admin. Here you will find many useful features, such as checking the configuration of Istio components, visualizing services based on the information gathered from intercepted network requests, getting answers to questions like "Who is calling whom?", "Which version of the service has issues?" etc. In general, explore the capabilities of Kiali before moving on — to visualizing metrics with Grafana.
Grafana: metric visualization
Metrics collected in Istio are sent to Prometheus and visualized with Grafana. To access the Grafana administrative interface, run the command below, then open :
Click on the menu Home at the top left and select Istio Service Dashboard in the top left corner, start with the service sa-web-app, to view the collected metrics:
Here awaits us an empty and absolutely dull presentation — management would never approve of this. So let's create a small load with the following command:
Now we have much nicer graphs, along with wonderful Prometheus tools for monitoring and Grafana for visualizing metrics, which will allow us to learn about the performance, health, and improvements/degradations in service operation over time.
Finally, let's look at request tracing in services.
Jaeger: tracing
Tracing is required because the more services we have, the harder it is to get to the root cause of a failure. Let's look at a simple case from the image below:
Typical example of a random failed requestA request comes in, fails — what is the reason? The first service? Or the second? There are exceptions in both — let's look at the logs of each. How often have you caught yourself doing such a task? Our job resembles software detectives more than developers...
This is a common issue in microservices, and it is solved by distributed tracing systems in which services pass a unique header to each other, after which this information is redirected to the tracing system, where it is matched with the request data. Here’s an illustration:
TraceId is used to identify the requestIstio uses Jaeger Tracer, which implements a vendor-independent OpenTracing API framework. You can access the Jaeger user interface with the following command:
Now go to and select the service sa-web-app. If the service is not shown in the dropdown menu — generate/make some activity on the page and refresh the interface. After that, click the button Find Traces, which will show the most recent traces — select any — detailed information on all traces will appear:
This trace shows:
- The request arrives at istio-ingressgateway (this is the first interaction with one of the services, and a Trace ID is generated for the request), after which the gateway directs the request to the service sa-web-app.
- In the service, sa-web-app the request is captured by the Envoy sidecar, a 'child' is created in the span (hence we see it in the traces), and it is redirected to the container sa-web-app. ( — a logical unit of work in Jaeger, having a name, start time of the operation, and its duration. Spans can be nested and ordered. A directed acyclic graph of spans forms a trace. — translator's note)
- Here, the request is processed by the method sentimentAnalysis. These traces have already been generated by the application, meaning that code changes were required.
- From this point, a POST request is initiated to sa-logic. The Trace ID must be propagated from sa-web-app.
- …
Note: At step 4, the application should see the headers generated by Istio and pass them in subsequent requests, as shown in the image below:
(A) Header propagation is handled by Istio; (B) Headers are managed by the servicesIstio does the heavy lifting as it generates headers for incoming requests, creates new spans in each sidecar, and passes them through. However, without working with headers inside services, the complete trace of the request will be lost.
The following headers must be considered (propagated):
This is not a complicated task, but for simplicity, there are already — for example, in the sa-web-app service, the RestTemplate client propagates these headers simply by adding Jaeger and OpenTracing libraries to .
Note that the Sentiment Analysis application showcases implementations in Flask, Spring, and ASP.NET Core.
Now that it’s clear what we have out of the box (or almost 'out of the box'), let's consider issues of finely-tuned routing, traffic management, security, etc.!
Note: translation.: read about this in the next part of the Istio materials by Rinor Maloku, the translations of which will follow in our blog soon. UPDATE (March 14): is already published.
P.S. from the translator
Also read in our blog:

- "Back to Microservices with Istio": , ;
- «»;
- «»;
- «»;
- «».
Source: habr.com
