

Again . Future DBAs will not be able to connect directly to PROD servers, but will be able to use Jenkins jobs for a limited set of operations. The DBA runs a job and after some time receives an email with a report on the execution of this operation. Let's look at ways to present these results to the user.

Plain Text
Let's start with the most trivial. The first method is so simple that there is generally nothing to say about it (the author here and below uses FreeStyle jobs):
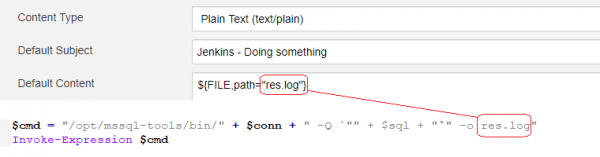
sqlcmd something is executed, and we present it to the user. Perfect for, for example, backup jobs:
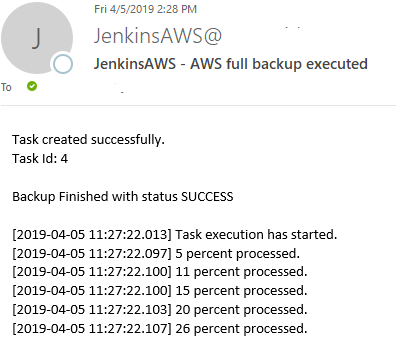
Don't forget, by the way, that for RDS backup/restore is asynchronous, so it would be wise to wait for it:
declare @rds table
  (id int, task_type varchar(128), database_name sysname, pct int, duration int,
   lifecycle varchar(128), taskinfo varchar(max) null,
   upd datetime, cre datetime,
   s3 varchar(256), ovr int, KMS varchar(256) null)
waitfor delay '00:00:20'
insert into @rds exec msdb.dbo.rds_task_status @db_name='{db}'
select @xid=max(id) from @rds

again:
waitfor delay '00:00:02'
delete from @rds
insert into @rds exec msdb.dbo.rds_task_status @db_name='{db}'
# {db} substituted with db name by powershell
select @stat=lifecycle,@info=taskinfo from @rds where id=@xid
if @stat not in ('ERROR','SUCCESS','CANCELLED') goto again
The second method, CSV
Here it is also very simple:
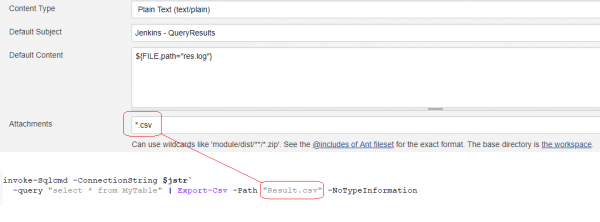
However, this method only works if the data returned in CSV is 'simple'. If you try to return, for example, a list of TOP N CPU intensive queries this way, the CSV will 'break' because the query text can contain any characters — commas, quotes, and even line breaks. Therefore, we will need something more complex.
Beautiful tables in HTML
Let me immediately provide a code snippet
$Header = @"
<style>
TABLE {border-width: 1px; border-style: solid; border-color: black; border-collapse: collapse;}
TH {border-width: 1px; padding: 3px; border-style: solid; border-color: black; background-color: #6495ED;}
TD {border-width: 1px; padding: 3px; border-style: solid; border-color: black;}
</style>
"@

$Result = invoke-Sqlcmd -ConnectionString $jstr -Query "select * from DbInv" `
  | Select-Object -Property * -ExcludeProperty "ItemArray", "RowError", "RowState", "Table", "HasErrors"
if ($Result -eq $null) { $cnt = 0; }
elseif ($Result.getType().FullName -eq "System.Management.Automation.PSCustomObject") { $cnt = 1; }
else { $cnt = $Result.Rows.Count; }
if ($cnt -gt 0) {
  $body = "<h2>My table</h2>"
  $Result | ConvertTo-HTML -Title "Rows" -Head $header -body $body `
    | Out-File "res.log" -Append -Encoding UTF8
  } else {
    "<h3>No data</h3>" | Out-File "res.log" -Append -Encoding UTF8
  }
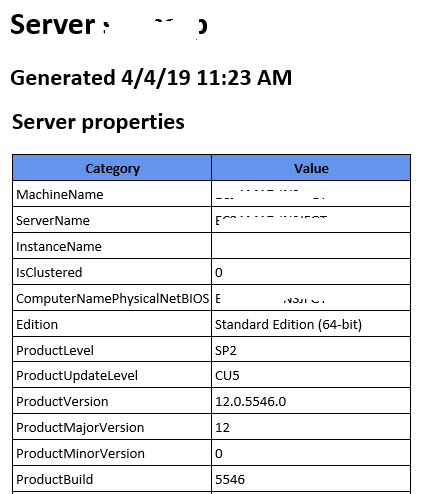
By the way, note the line with System.Management.Automation.PSCustomObject; it is magical; if there is exactly one row in the grid, some issues arose. The solution was taken from the internet without much digging. As a result, you will get output formatted approximately like this:
Drawing graphs
Attention: the twisted code below!
There is a fun SQL query that outputs CPU usage for the last N minutes — it turns out, the major remembers everything! Try this query:
DECLARE @ts_now bigint = (SELECT cpu_ticks/(cpu_ticks/ms_ticks) FROM sys.dm_os_sys_info WITH (NOLOCK)); SELECT TOP(256) DATEADD(ms, -1 * (@ts_now - [timestamp]), GETDATE()) AS [EventTime], SQLProcessUtilization AS [SQLCPU], 100 - SystemIdle - SQLProcessUtilization AS [OtherCPU] FROM (SELECT record.value('(.//Record/@id)[1]', 'int') AS record_id, record.value('(.//Record/SchedulerMonitorEvent/SystemHealth/SystemIdle)[1]', 'int') AS [SystemIdle], record.value('(.//Record/SchedulerMonitorEvent/SystemHealth/ProcessUtilization)[1]', 'int') AS [SQLProcessUtilization], [timestamp] FROM (SELECT [timestamp], CONVERT(xml, record) AS [record] FROM sys.dm_os_ring_buffers WITH (NOLOCK) WHERE ring_buffer_type = N'RING_BUFFER_SCHEDULER_MONITOR' AND record LIKE N'%%') AS x) AS y ORDER BY 1 DESC OPTION (RECOMPILE);Now, using such formatting (variable $Fragment)
<table style="width: 100%"><tbody><tr style="background-color: white; height: 2pt;">
  <td style="width: SQLCPU%; background-color: green;"></td>
  <td style="width: OtherCPU%; background-color: blue;"></td>
  <td style="width: REST%; background-color: #C0C0C0;"></td></tr></tbody>
</table>
We can form the body of the email:
$Result = invoke-Sqlcmd -ConnectionString $connstr -Query $Query ` | Select-Object -Property * -ExcludeProperty ` "ItemArray", "RowError", "RowState", "Table", "HasErrors" if ($Result.HasRows) { foreach($item in $Result) { $time = $item.EventTime $sqlcpu = $item.SQLCPU $other = $item.OtherCPU $rest = 100 - $sqlcpu - $other $f = $fragment -replace "SQLCPU", $sqlcpu $f = $f -replace "OtherCPU", $other $f = $f -replace "REST", $rest $f | Out-File "res.log" -Append -Encoding UTF8 }Which will look like this:
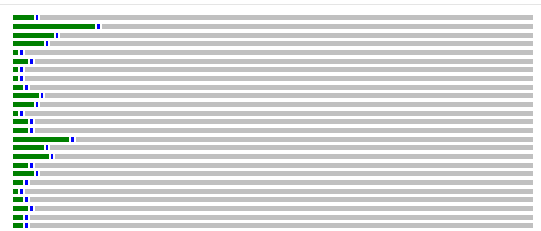
Indeed, monsieur knows a thing or two about oddities! Interestingly, this code includes: Powershell (which is what it’s written in), SQL, Xquery, HTML. It's a pity we can't add Javascript (as this is for email), but refining the Python code (which can be used in SQL) is a must!
SQL profiler trace output
It's clear that the trace won't fit into CSV due to the TextData field. However, displaying the trace grid in the email seems odd both because of the size and because these data are often used for further analysis. Therefore, we do the following: we call through invoke-SqlCmd some script, within which the following is executed
select SPID, EventClass, TextData, Duration, Reads, Writes, CPU, StartTime, EndTime, DatabaseName, HostName, ApplicationName, LoginName from ::fn_trace_gettable ( @filename , default ) Next, on a friend server, available to the DBA, there exists a Traces database with an empty model table ready to accept all mentioned columns. We copy this model into a new table with a unique name:
$dt = Get-Date -format "yyyyMMdd" $tm = Get-Date -format "hhmmss" $tableName = $srv + "_" + $dt + "_" + $tm $copytab = "select * into " + $tableName + " from Model" invoke-SqlCmd -ConnectionString $tstr -Query $copytab And now we can write our trace into it using Data.SqlClient.SqlBulkCopy — an example of which I provided above. Yes, it would also be good to do constant masking in TextData:
# mask data
foreach ($Row in $Result)
{
  $v = $Row["TextData"]
  $v = $v -replace "'([^']{2,})'", "'str'" -replace "[0-9][0-9]+", '999'
  $Row["TextData"] = $v
}
We replace numbers longer than one digit with 999, and strings longer than one character with 'str'. Numbers from 0 to 9 are often used as flags, and we don't touch them, just like we leave empty and single-character strings unchanged — among them, we often find 'Y', 'N', etc.
Let's add some color to our lives (strictly 18+)
In tables, we often want to highlight cells that require attention. For example, FAILS, high fragmentation level, etc. Of course, this can also be done with plain SQL, generating HTML using PRINT, and in Jenkins, you set the file type to HTML:
declare @body varchar(max), @chunk varchar(max)
set @body='<font face="Lucida Console" size="3">'
set @body=@body+'<b>Server name: '+@@servername+'</b><br>'
set @body=@body+'<br><br>'
set @body=@body+'<table><tr><th>Job</th><th>Last Run</th><th>Avg Duration, sec</th><th>Last Run, Sec</th><th>Last Status</th></tr>'
print @body

DECLARE tab CURSOR FOR SELECT '<tr><td>'+name+'</td><td>'+
  LastRun+'</td><td>'+
  convert(varchar,AvgDuration)+'</td><td>'+
  convert(varchar,LastDuration)+'</td><td>'+
    case when LastStatus<>'Succeeded' then '<font color="red">' else '' end+
      LastStatus+
      case when LastStatus<>'Succeeded' then '</font>' else '' end+
     +'</td><td>'
  from #j2
OPEN tab;
FETCH NEXT FROM tab into @chunk
WHILE @@FETCH_STATUS = 0
BEGIN
  print @chunk
  FETCH NEXT FROM tab into @chunk;
END
CLOSE tab;
DEALLOCATE tab;
print '</table>'
Why did I write such code?

But there is a more elegant solution. ConvertTo-HTML doesn't allow us to color cells, but we can do it afterward. For example, we want to highlight cells with a fragmentation level greater than 80 and greater than 90. Let's add styles:
.SQLmarkup-red { color: red; background-color: yellow; }
.SQLmarkup-yellow { color: black; background-color: #FFFFE0; }
.SQLmarkup-default { color: black; background-color: white; }
In the query itself, we will add a dummy column directly before the column we want to color. The column should be named SQLmarkup-something:
case
  when ps.avg_fragmentation_in_percent>=90.0 then 'SQLmarkup-red'
  when ps.avg_fragmentation_in_percent>=80.0 then 'SQLmarkup-yellow'
  else 'SQLmarkup-default'
  end as [SQLmarkup-1],
ps.avg_fragmentation_in_percent,
Now, having the HTML generated by Powershell, we will remove the dummy column from the header and move the value from the column into the style in the data body. This is done with just two replacements:
$html = $html `
  -replace "<th>SQLmarkup[^<]*</th>", "" `
  -replace "<td>SQLmarkup-(.+?)</td><td>",'<td class="SQLmarkup-$1">'
Result:
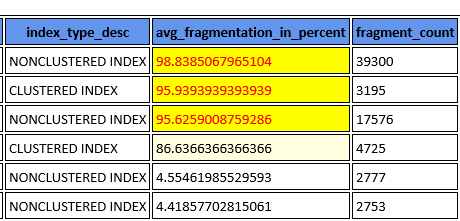
Isn't it elegant? Although wait, something about this coloring reminds me of

Source: habr.com
