

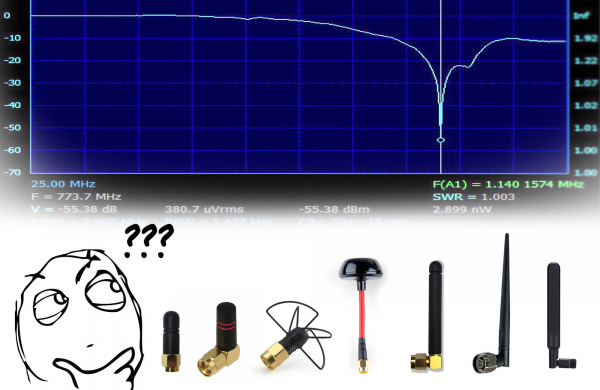
— What range is this antenna designed for?
— I don't know, check it.
— HOW?!?!
How can you determine what kind of antenna you have in hand if it lacks markings? How can you understand which antenna is better or worse? This problem has bothered me for a long time.
The article describes, in simple terms, the technique for measuring antenna characteristics and how to determine the frequency range of the antenna.
To experienced radio engineers, this information might seem trivial, and the measurement method may appear insufficiently precise. The article is aimed at those who know nothing about radio electronics, like me.
TL;DR We will measure the SWR of antennas at various frequencies using the OSA 103 Mini device and a directional coupler, plotting the graph of SWR dependence on frequency.
Theory
When the transmitter sends a signal to the antenna, part of the energy is radiated into the air, and part is reflected back. The ratio between the radiated and reflected energy is characterized by the standing wave ratio (SWR). The lower the SWR, the greater portion of the transmitter's energy is radiated as radio waves. At an SWR of 1, there is no reflection (all energy is radiated). The SWR for a real antenna is always greater than 1.
If you send signals of different frequencies into the antenna and simultaneously measure the SWR, you can find the frequency at which reflection will be minimal. This will be the working range of the antenna. You can also compare different antennas for the same range to find out which one is better.
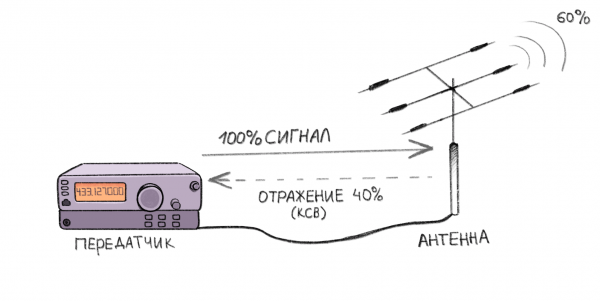
Part of the transmitter's signal is reflected from the antenna.
An antenna designed for a specific frequency, in theory, should have the lowest SWR at its operating frequencies. This means it is enough to emit different frequencies into the antenna and find the frequency at which reflection is the lowest, meaning the maximum amount of energy is radiated as radio waves.
By generating signals at different frequencies and measuring the reflection, we can plot a graph where the X-axis is frequency and the Y-axis is the signal reflection coefficient. As a result, where there is a dip on the graph (i.e., the lowest signal reflection), will be the working range of the antenna.
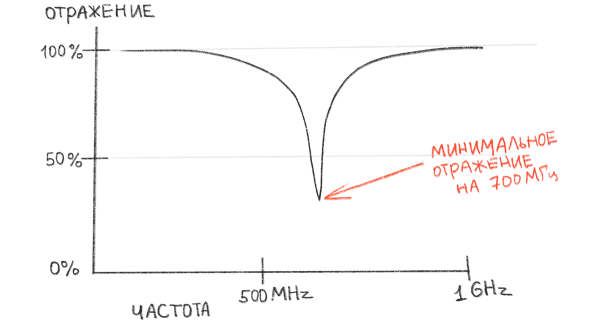
Imaginary graph of reflection dependence on frequency. Across the entire range, reflection is 100%, except at the antenna's operating frequency.
OSA 103 Mini device
For the measurements, we will use . This is a versatile measuring instrument that combines an oscilloscope, signal generator, spectrum analyzer, frequency response and phase response meter, vector network analyzer, LC meter, and even an SDR transceiver. The OSA103 Mini has a working range limited to 100 MHz, while the OSA-6G module extends the frequency range in the frequency response mode up to 6 GHz. The native software with all features is 3 MB, works under Windows, and through Wine on Linux.
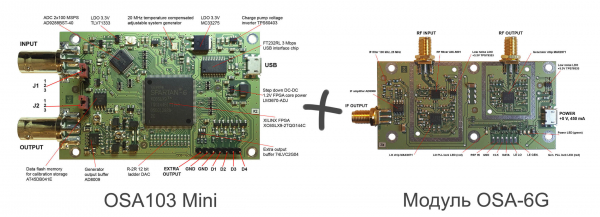
Osa103 Mini is a versatile measuring instrument for radio enthusiasts and engineers
Directional coupler
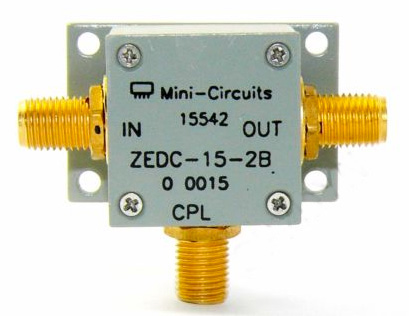
A directional coupler is a device that diverts a small part of the RF signal traveling in a certain direction. In our case, it should sample part of the reflected signal (coming back from the antenna to the generator) for measurement.
Visual explanation of how a directional coupler works:
Main characteristics of the directional coupler:
- Operating frequencies — the frequency range within which the main parameters remain within the norm. My coupler is designed for frequencies from 1 to 1000 MHz
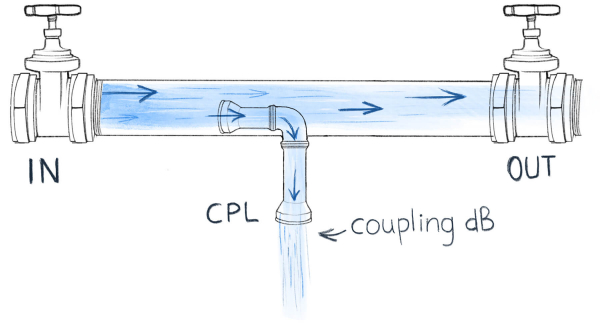
- Coupling — what portion of the signal (in decibels) will be diverted when the wave direction is from IN to OUT
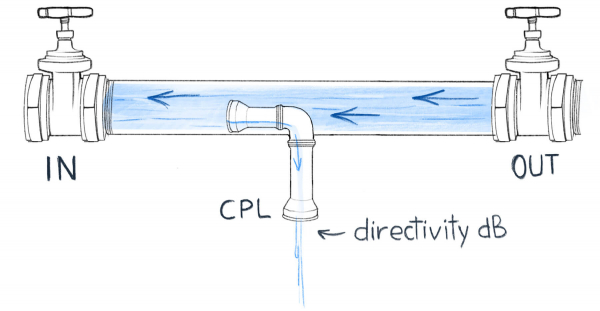
- Directivity — how much less signal will be diverted when the signal moves in the opposite direction from OUT to IN
At first glance, this seems quite confusing. For clarity, let's visualize the coupler as a plumbing pipe with a small diversion inside. The diversion is made in such a way that when water flows in the forward direction (from IN to OUT), a significant portion of the water is diverted. The amount of water diverted in this direction is defined by the Coupling parameter in the coupler's datasheet.
When water flows in the reverse direction, significantly less water is diverted. This should be perceived as a side effect. The amount of water diverted during this reverse flow is defined by the Directivity parameter in the datasheet. The smaller this parameter (the higher the dB value), the better it is for our task.
Schematic diagram
Since we want to measure the signal level reflected from the antenna, we connect it to IN of the coupler and the generator to OUT. This way, part of the signal reflected from the antenna will reach the receiver for measurement.
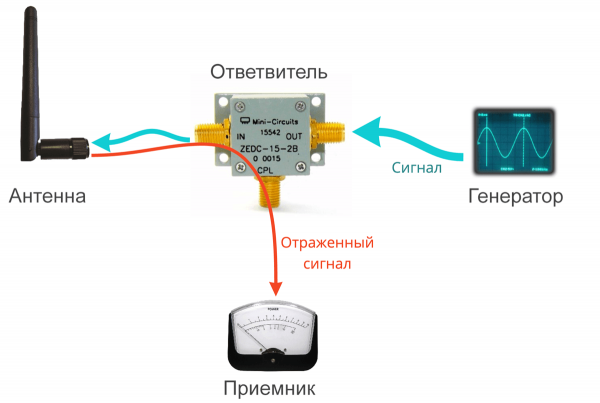
Connection diagram of the splitter. The reflected signal is fed to the receiver.
Measuring setup
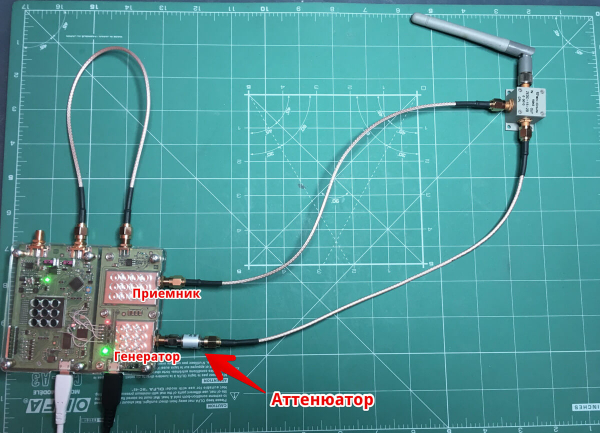
We will assemble a setup for measuring VSWR according to the schematic. An attenuator with a 15 dB attenuation will be additionally installed on the output of the generator. This will improve the matching of the splitter with the generator output and enhance the measurement accuracy. An attenuator with an attenuation of 5 to 15 dB can be used. The attenuation value will be automatically accounted for during subsequent calibration.
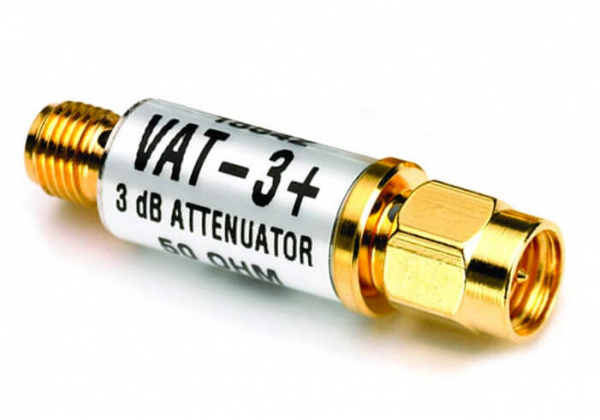
An attenuator reduces the signal by a fixed number of decibels. The main characteristic of the attenuator is the signal attenuation ratio and the operating frequency range. At frequencies outside the operating range, the characteristics of the attenuator may change unpredictably.
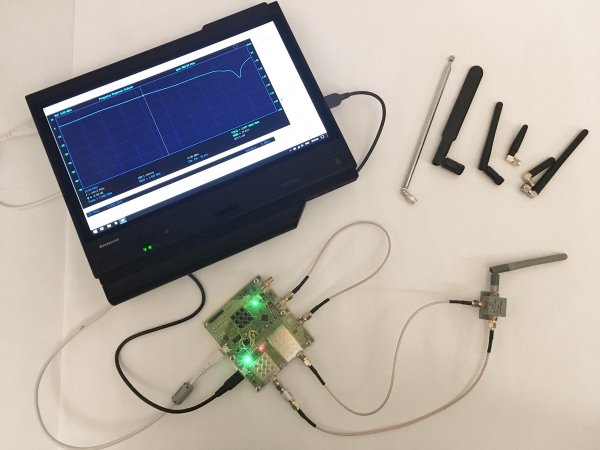
This is what the final setup looks like. Don't forget to feed the intermediate frequency (IF) signal from the OSA-6G module to the main board of the device. For this, connect the IF OUTPUT port on the main board to INPUT on the OSA-6G module.
To reduce the noise from the impulse power supply of the laptop, I conduct all measurements while powering the laptop from the battery.
Calibration
Before starting measurements, ensure that all device components are functioning properly and the quality of the cables is good. To do this, connect the generator and receiver with a cable directly, turn on the generator, and perform the frequency response measurement. We obtain a nearly flat graph at 0dB. This means that throughout the frequency range, all emitted power from the generator has reached the receiver.
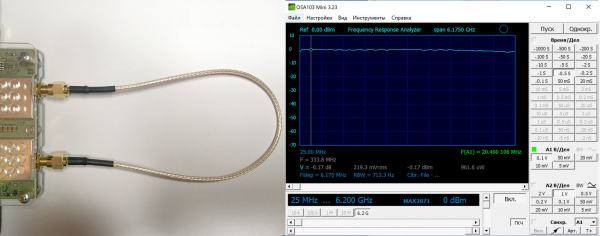
Connecting the generator directly to the receiver
Let's add an attenuator to the schematic. A nearly flat 15dB signal drop is visible across the entire range.
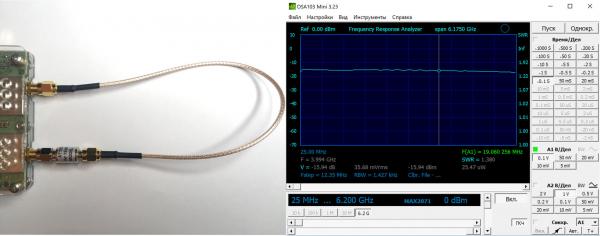
Connecting the generator through a 15dB attenuator to the receiver
We will connect the generator to the OUT port of the splitter and the receiver to the CPL port of the splitter. Since there is no load connected to the IN port, all generated signals should be reflected, and part of it should be split to the receiver. According to the datasheet for our splitter (), the Coupling parameter is about ~15dB, which means we should see a horizontal line at around -30 dB (coupling + attenuator loss). However, since the working frequency range of the splitter is limited to 1 GHz, all measurements above this frequency can be considered meaningless. This is clearly visible on the graph; after 1 GHz, the readings are chaotic and lack significance. Therefore, all further measurements will be conducted within the working range of the splitter.
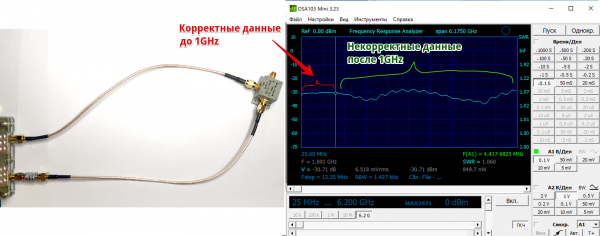
Connecting the splitter without load. The limit of the splitter's working range is visible.
Since the measurement data above 1 GHz is not meaningful in our case, we will limit the maximum frequency of the generator to the working values of the splitter. The measurements result in a flat line.
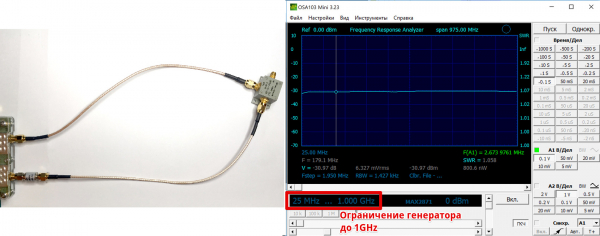
Limiting the generator range to the working range of the splitter
In order to visually measure the VSWR of antennas, we need to perform calibration to take the current parameters of the circuit (100% reflection) as the reference point, which is 0 dB. For this, the OSA103 Mini program has a built-in calibration function. Calibration is performed without the antenna (load) connected; the calibration data is recorded in a file and will automatically be taken into account when constructing graphs.
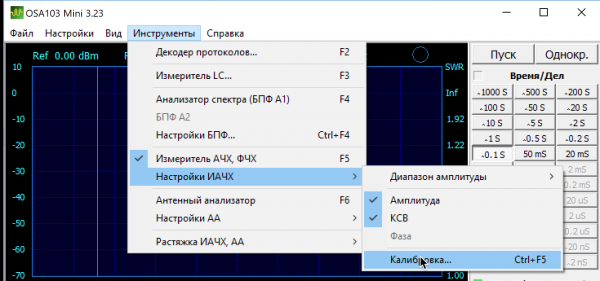
Calibration function for the S21 in the OSA103 Mini program
By applying the calibration results and running measurements without load, we obtain a flat graph at 0 dB.
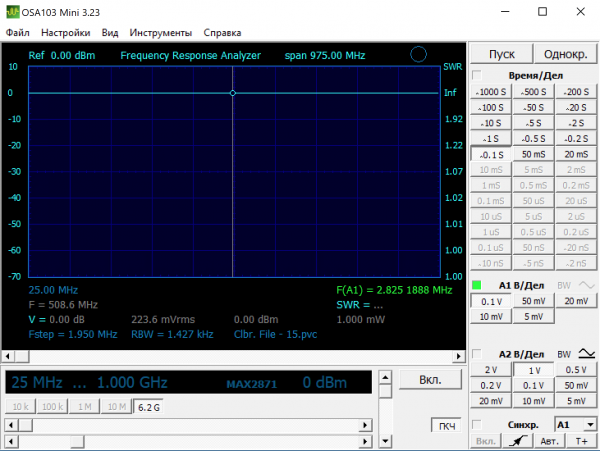
Graph after calibration
Measuring antennas
Now we can start measuring antennas. Thanks to the calibration, we will see and measure the reduction in reflection after connecting the antenna.
Antenna from Aliexpress for 433MHz
Antenna marked 443MHz. It is evident that the antenna works most effectively in the range of 446MHz, where the VSWR is 1.16. Meanwhile, at the claimed frequency, the performance is significantly worse, with a VSWR of 4.2 at 433MHz.
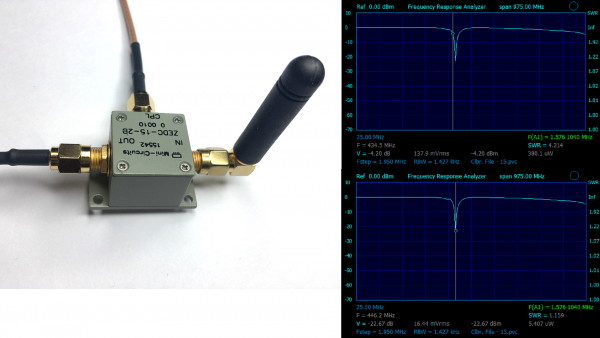
Unknown antenna 1
Unmarked antenna. Judging by the graph, it is designed for 800 MHz, presumably for the GSM range. To be fair, this antenna also works at 1800 MHz, but due to the splitter's limitations, I cannot make accurate measurements at these frequencies.
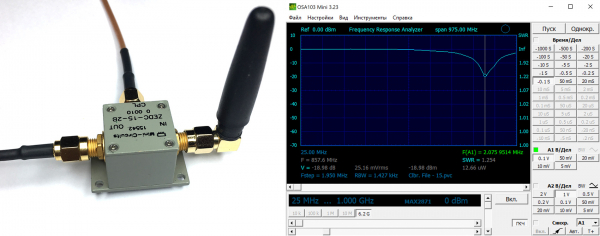
Unknown antenna 2
Another antenna that has been sitting in my boxes for a long time. Apparently, it's also for the GSM range but performs better than the previous one. At a frequency of 764 MHz, the VSWR is close to one, and at 900 MHz, the VSWR is 1.4.
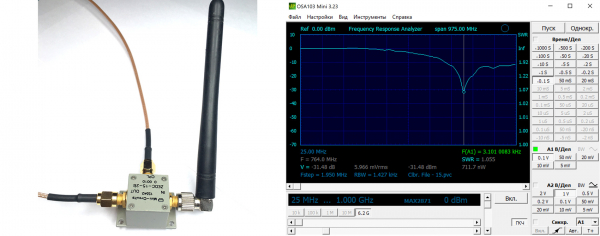
Unknown antenna 3
This looks like a Wi-Fi antenna, but for some reason, the connector is SMA-Male instead of RP-SMA, like most Wi-Fi antennas. Based on the measurements, this antenna is useless at frequencies up to 1 MHz. Again, due to the limitations of the splitter, we won't find out what kind of antenna this is.
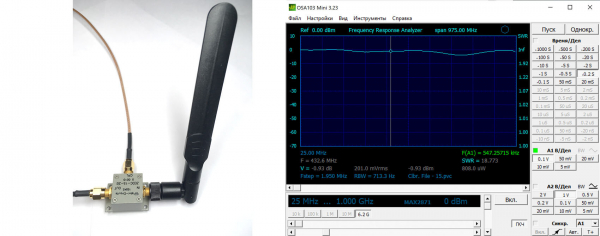
Telescopic antenna
Let's try to calculate how far to extend the telescopic antenna for the 433MHz range. The wavelength calculation formula is: λ = C/f, where C is the speed of light and f is the frequency.
299.792.458 / 443.000.000 = 0.69719176279
Full wavelength — 69.24 cm
Half wavelength — 34.62 cm
Quarter wavelength — 17.31 cm

The antenna calculated this way turned out to be absolutely useless. At a frequency of 433MHz, the SWR value is 11.
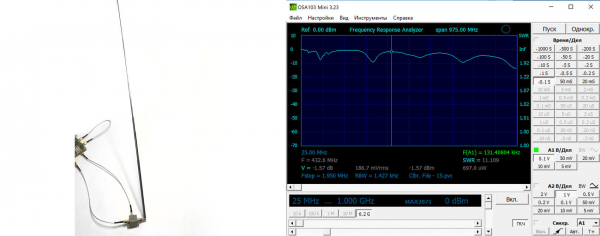
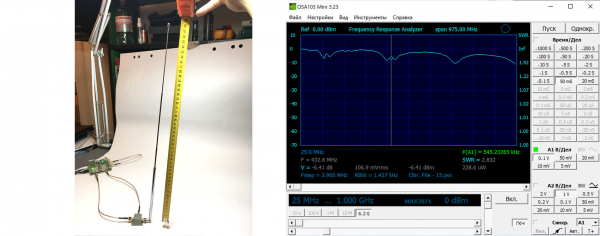
By experimentally extending the antenna, I managed to achieve a minimal SWR of 2.8 with an antenna length of about 50 cm. It turned out that the thickness of the sections is very important. That is, extending only the thin outer sections resulted in better performance than extending only the thick sections by the same length. I don't know how much I should rely on these calculations for the length of the telescopic antenna, because in practice they don't work. Maybe it works differently with other antennas or frequencies, I'm not sure.
A piece of wire at 433MHz
Often in various devices, like radio switches, you can see a piece of straight wire used as an antenna. I cut a piece of wire equal to a quarter wavelength at 433 MHz (17.3 cm) and tinned the end so that it fit tightly into the SMA Female connector.
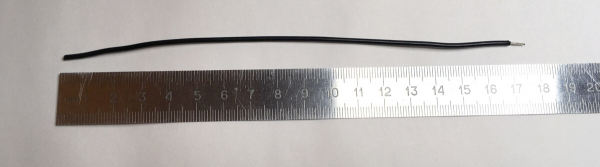
The result was strange: this wire works well at 360 MHz but is useless at 433 MHz.
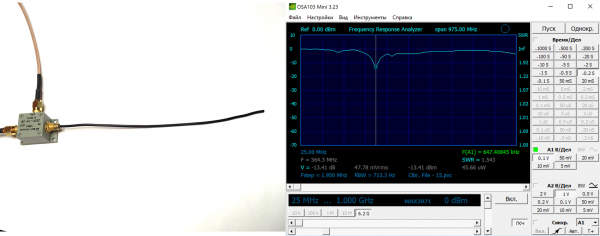
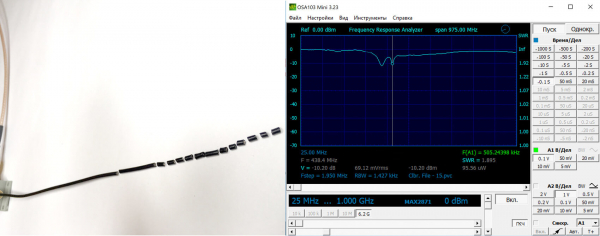
I started trimming the wire piece from the end and observing the readings. The dip on the graph began to slowly shift to the right, towards 433 MHz. Ultimately, at a wire length of about 15.5 cm, I managed to achieve the lowest SWR value of 1.8 at a frequency of 438 MHz. Further shortening of the cable led to an increase in SWR.
Conclusion
Due to the limitations of the splitter, I was unable to measure antennas at frequencies above 1 GHz, for example, Wi-Fi antennas. This could have been done if I had a more wideband splitter.
The splitter, connecting cables, device, and even laptop are all components of the resulting antenna system. Their geometry, spatial position, and surrounding objects affect the measurement results. After installation on an actual radio station or modem, the frequency may shift as the body of the radio station, modem, and the operator become part of the antenna.
OSA103 Mini is a very cool multifunctional device. I express my gratitude to its developer for the consultation during the measurements.
Source: habr.com
