

After NVIDIA demonstrated real-time ray tracing on GeForce RTX series graphics cards, it's hard to doubt that this technology (in a reasonable combination with rasterization algorithms) represents the future of computer gaming. However, Turing architecture GPUs with specialized RT cores were until recently considered the only category of discrete GPUs that had the necessary computational power for it.
As the tests of the first games that embraced Ray Tracing (Battlefield V, Metro Exodus, and Shadow of the Tomb Raider) showed, even the GeForce RTX accelerators (especially the lower-end RTX 2060) experience a significant drop in frame rates in hybrid rendering tasks. Despite these initial successes, real-time ray tracing cannot yet be considered a mature technology. It will only be deemed successful when not only the most advanced and expensive devices but also mid-range graphics cards reach the previous standards of performance in this new wave of games.
Ray tracing on Pascal - pros and cons
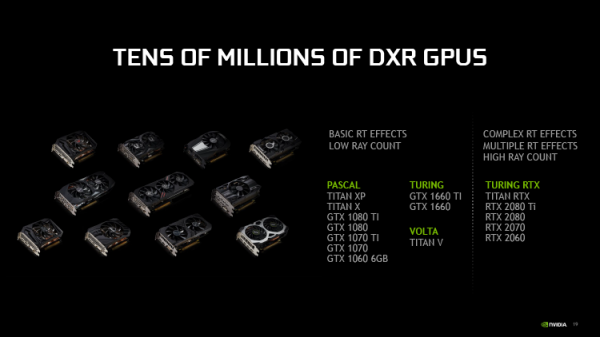
But even now, despite not a word being said about the future successor to the Turing architecture, NVIDIA has decided to spur progress. At last month's GPU Technology Conference, the green team announced that accelerators based on Pascal chips, as well as the lower-end members of the Turing family (the GeForce GTX 16 series), would gain real-time ray tracing capabilities alongside RTX-branded products. Today, the promised driver is already available for download on the official NVIDIA website, and the list of devices includes models from the GeForce 10 family, starting with the GeForce GTX 1060 (6GB version), the professional TITAN V accelerator based on Volta, and, of course, the newly arrived mid-range models based on the TU116 chip - GeForce GTX 1660 and GTX 1660 Ti. The update also affected laptops with corresponding GPUs.
From a technical perspective, there's nothing supernatural here. Graphics processors with unified shader blocks were capable of performing Ray Tracing long before the Turing architecture emerged, although they did not possess sufficient speed for this capability to be in demand in games at that time. Additionally, there was no unified standard for software methods, aside from proprietary APIs like NVIDIA's OptiX. Now that a DXR extension for Direct3D 12 and similar libraries in the Vulkan API exists, game engines can access them regardless of whether the graphics processor has specialized logic—as long as the driver allows such capability. The Turing chips have dedicated RT cores for this purpose, while in Pascal architecture GPUs and the TU116 chip, ray tracing is implemented in a general-purpose computation format on a set of shader ALUs.
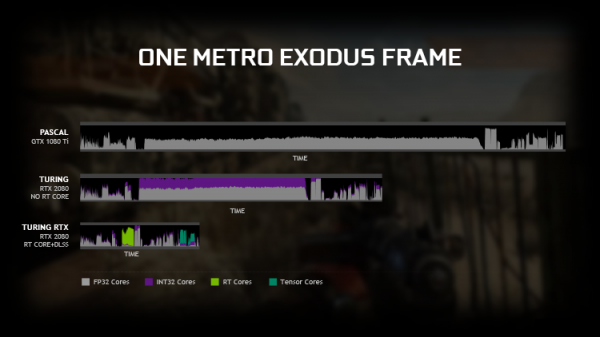
However, everything we know about the Turing architecture from NVIDIA itself indicates that Pascal is not suitable for applications with DXR support. In last year's presentation dedicated to the flagship models of the Turing family—the GeForce RTX 2080 and RTX 2080 Ti—the engineers provided the following data. If all resources of the best consumer graphics card of the previous generation—the GeForce GTX 1080 Ti—were devoted to ray tracing calculations, the resulting performance would not exceed 11% of what the RTX 2080 Ti is theoretically capable of. Equally important is that the free CUDA cores of the Turing chip can simultaneously be used for parallel processing of other image components—executing shader programs, queuing non-graphical Direct3D calculations in asynchronous execution, and so on.
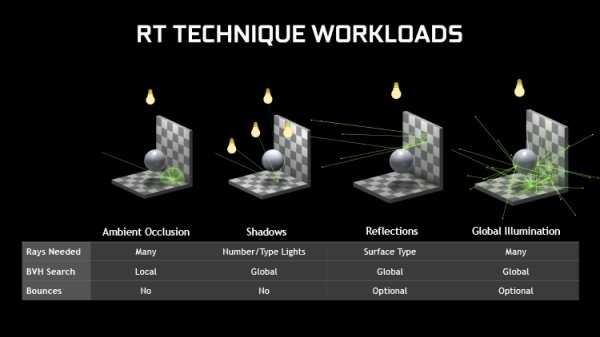
In real-world gaming, the situation is more complex, as developers make selective use of DXR features on existing hardware, while rasterization and shader instructions still account for the majority of the computational load. Moreover, some effects created using ray tracing can be effectively executed on CUDA cores of Pascal chips. For example, reflective surfaces in Battlefield V do not involve secondary ray reflections, making them a manageable load for powerful graphics cards from the previous generation. The same applies to shadows in Shadow of the Tomb Raider, although rendering complex shadows formed by multiple light sources poses a more challenging problem. However, global illumination in Metro Exodus is difficult even for 'Turing', and Pascal cannot be expected to yield comparable results in any significant way.
Regardless of how you look at it, there is a significant difference in theoretical performance between representatives of the Turing architecture and their closest silicon counterparts from Pascal. The advantage of Turing lies not only in the presence of RT cores but also in numerous general improvements characteristic of next-generation accelerators. Turing chips can perform operations on floating-point (FP32) and integer (INT) data in parallel, feature a large amount of local cache memory, and have separate CUDA cores for lower-precision calculations (FP16). This means that Turing not only handles shader programs better but can also compute ray tracing relatively efficiently without specialized blocks. After all, the resource-intensive rendering using Ray Tracing is driven not just by the intersection checks between rays and geometry elements (handled by RT cores) but also by the color calculations at the intersection points (shading). By the way, the aforementioned advantages of the Turing architecture fully apply to the GeForce GTX 1660 and GTX 1660 Ti, even though the TU116 chip lacks RT cores, making tests of these graphics cards with software-based ray tracing particularly interesting.
But enough theory, as we have already gathered data on the performance of the 'Pascal' GPUs (as well as the lower 'Turing' models) in Battlefield V, Metro Exodus, and Shadow of the Tomb Raider based on our own measurements. Note that neither the driver nor the games themselves adjust the number of rays to reduce the load on GPUs without RT cores, meaning the quality of effects on the GeForce GTX and GeForce RTX should be the same.
Test bench, testing methodology
| Test Stand | |
|---|---|
| CPU | Intel Core i9-9900K (4.9 GHz, 4.8 GHz in AVX, fixed frequency) |
| Motherboard | ASUS MAXIMUS XI APEX |
| Memory | G.Skill Trident Z RGB F4-3200C14D-16GTZR, 2 x 8 GB (3200 MHz, CL14) |
| SSD | Intel SSD 760p, 1024 GB |
| Power Supply | Corsair AX1200i, 1200 W |
| CPU Cooling System | Corsair Hydro Series H115i |
| Case | CoolerMaster Test Bench V1.0 |
| Monitor | NEC EA244UHD |
| Operating system | Windows 10 Pro x64 |
| GPU Software for NVIDIA | |
| NVIDIA GeForce RTX 20 | NVIDIA GeForce Game Ready Driver 419.67 |
| NVIDIA GeForce GTX 10/16 | NVIDIA GeForce Game Ready Driver 425.31 |
| Gaming tests | ||||
|---|---|---|---|---|
| Game | API | Settings, testing method | Fullscreen Anti-Aliasing | |
| 1920 × 1080 / 2560 × 1440 | 3840 × 2160 | |||
| Battlefield V | DirectX 12 | OCAT, mission Liberte. Max. graphics quality | TAA High | TAA High |
| Metro Exodus | DirectX 12 | Built-in benchmark. Ultra graphics quality profile | TAA | TAA |
| Shadow of the Tomb Raider | DirectX 12 | Built-in benchmark. Max. graphics quality | SMAA 4x | Off. |
The average and minimum frame rates are derived from a time array of individual frame renderings, which is recorded by the built-in benchmark (Metro Exodus, Shadow of the Tomb Raider) or the OCAT utility, if it's not available in the game (Battlefield V).
The average frame rate shown in the charts is the inverse of the average frame time. To evaluate the minimum frame rate, the number of frames rendered in each second of the test is calculated. From this array of numbers, the value corresponding to the 1st percentile of the distribution is selected.
Testing participants
The following graphics cards participated in the performance testing:
- NVIDIA GeForce RTX 2080 Ti Founders Edition (1350/14000 MHz, 11 GB);
- NVIDIA GeForce GTX 2080 Founders Edition (1515/14000 MHz, 8 GB);
- NVIDIA GeForce RTX 2070 Founders Edition (1410/14000 MHz, 8 GB);
- NVIDIA GeForce RTX 2060 Founders Edition (1365/14000 MHz, 6 GB);
- NVIDIA GeForce GTX 1660 Ti (6 GB);
- NVIDIA GeForce GTX 1660 (6 GB);
- NVIDIA GeForce GTX 1080 Ti (1480/11000 MHz, 11 GB);
- NVIDIA GeForce GTX 1080 (1607/10000 MHz, 8 GB);
- NVIDIA GeForce GTX 1070 Ti (1608/8008 MHz, 8 GB);
- NVIDIA GeForce GTX 1070 (1506/8008 MHz, 8 GB);
- NVIDIA GeForce GTX 1060 (1506/9000 MHz, 6 GB).
Battlefield V
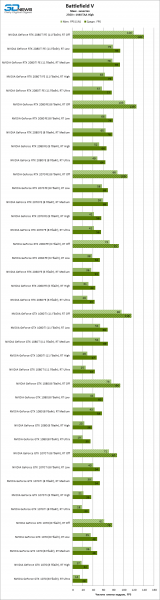
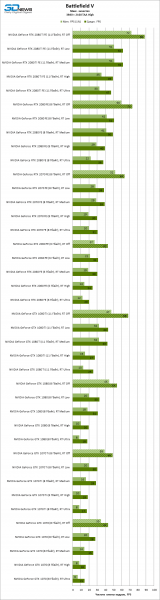
Given that Battlefield V is quite an undemanding game (especially in 1080p and 1440p modes), and that ray tracing is applied sporadically, the GeForce 10 series test with the DXR option yielded promising results. However, among all models without silicon-level Ray Tracing support, we had to limit ourselves to the GTX 1070/1070 Ti and GTX 1080/1080 Ti models. Electronic Arts games are suspicious of frequent hardware configuration changes and can block users for one or several days. Therefore, performance measurements for the GeForce GTX 1060 and two devices from the GeForce GTX 16 series will appear in this article later, once Battlefield V lifts the restrictions on our test machine.
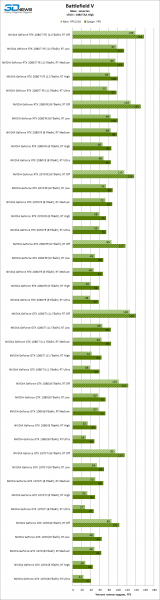
In percentage terms, any participant in the testing experiences approximately the same performance drop with various ray tracing quality settings, regardless of the screen resolution. Thus, the performance of GeForce RTX 20 branded graphics cards decreases by 28-43% with low and medium quality DXR effects, while under high and maximum settings, it drops by 37-53%.
When it comes to the higher models of the GeForce 10 family, at Low and Medium ray tracing levels, the game loses between 36 to 42% of FPS, while at high quality (High and Ultra settings), DXR consumes 54-67% of the frame rate. Notably, in many, if not most, gameplay scenes in Battlefield V, there is no significant difference between Low and Medium settings, nor between High and Ultra—neither in image sharpness nor in performance. Hoping that Pascal graphics processors would be more sensitive to this parameter, we conducted tests at all four settings. Indeed, certain differences emerged, but only at 2160p resolution and within 6% FPS.
In absolute terms, any of the higher-end accelerators based on Pascal chips can support a frame rate above 60 FPS at 1080p with reduced reflection quality, while the GeForce GTX 1080 Ti claims a similar result even at High ray tracing settings. However, when switching to 1440p resolution, only the GeForce GTX 1080 and GTX 1080 Ti provide a comfortable frame rate of 60 FPS or higher at Low or Medium ray tracing quality, and at 4K resolution, none of the previous generation cards have sufficient computational power (just like any Turing card except for the flagship GeForce RTX 2080 Ti).
If we look for parallels between specific accelerators under the GeForce GTX 10 and GeForce RTX 20 brands, the best model of the previous generation (GeForce GTX 1080 Ti), which, in standard rendering tasks without DXR, is equivalent to the GeForce RTX 2080, has dropped to the level of GeForce RTX 2070 at reduced ray tracing quality, and at high quality, it can only compete with the GeForce RTX 2060.
| Battlefield V, max. quality | |||||
|---|---|---|---|---|---|
| 1920 × 1080 TAA | |||||
| RT Off | RT Low | RT Medium | RT High | RT Ultra | |
| NVIDIA GeForce RTX 2080 Ti FE (11 GB) | 100% | -28% | -28% | -37% | -39% |
| NVIDIA GeForce RTX 2080 FE (8 GB) | 100% | -34% | -35% | -43% | -44% |
| NVIDIA GeForce RTX 2070 FE (8 GB) | 100% | -35% | -36% | -46% | -45% |
| NVIDIA GeForce RTX 2060 FE (6 GB) | 100% | -42% | -43% | -50% | -51% |
| NVIDIA GeForce GTX 1660 Ti (6 GB) | 100% | N/A | N/A | N/A | N/A |
| NVIDIA GeForce GTX 1660 (6 GB) | 100% | N/A | N/A | N/A | N/A |
| NVIDIA GeForce GTX 1080 Ti (11 GB) | 100% | -40% | -39% | -54% | -58% |
| NVIDIA GeForce GTX 1080 (8 GB) | 100% | -41% | -41% | -57% | -61% |
| NVIDIA GeForce GTX 1070 Ti (8 GB) | 100% | -40% | -41% | -57% | -59% |
| NVIDIA GeForce GTX 1070 (8 GB) | 100% | -38% | -39% | -57% | -61% |
| NVIDIA GeForce GTX 1060 (6 GB) | 100% | N/A | N/A | N/A | N/A |
| Battlefield V, max. quality | |||||
|---|---|---|---|---|---|
| 2560 × 1440 TAA | |||||
| RT Off | RT Low | RT Medium | RT High | RT Ultra | |
| NVIDIA GeForce RTX 2080 Ti FE (11 GB) | 100% | -33% | -34% | -44% | -45% |
| NVIDIA GeForce RTX 2080 FE (8 GB) | 100% | -37% | -38% | -47% | -49% |
| NVIDIA GeForce RTX 2070 FE (8 GB) | 100% | -36% | -36% | -48% | -48% |
| NVIDIA GeForce RTX 2060 FE (6 GB) | 100% | -41% | -42% | -51% | -52% |
| NVIDIA GeForce GTX 1660 Ti (6 GB) | 100% | N/A | N/A | N/A | N/A |
| NVIDIA GeForce GTX 1660 (6 GB) | 100% | N/A | N/A | N/A | N/A |
| NVIDIA GeForce GTX 1080 Ti (11 GB) | 100% | -40% | -40% | -59% | -62% |
| NVIDIA GeForce GTX 1080 (8 GB) | 100% | -36% | -39% | -59% | -63% |
| NVIDIA GeForce GTX 1070 Ti (8 GB) | 100% | -39% | -39% | -58% | -62% |
| NVIDIA GeForce GTX 1070 (8 GB) | 100% | -38% | -38% | -59% | -63% |
| NVIDIA GeForce GTX 1060 (6 GB) | 100% | N/A | N/A | N/A | N/A |
| Battlefield V, max. quality | |||||
|---|---|---|---|---|---|
| 3840 × 2160 TAA | |||||
| RT Off | RT Low | RT Medium | RT High | RT Ultra | |
| NVIDIA GeForce RTX 2080 Ti FE (11 GB) | 100% | -30% | -30% | -44% | -47% |
| NVIDIA GeForce RTX 2080 FE (8 GB) | 100% | -31% | -32% | -46% | -49% |
| NVIDIA GeForce RTX 2070 FE (8 GB) | 100% | -40% | -38% | -53% | -52% |
| NVIDIA GeForce RTX 2060 FE (6 GB) | 100% | -28% | -30% | -44% | -53% |
| NVIDIA GeForce GTX 1660 Ti (6 GB) | 100% | N/A | N/A | N/A | N/A |
| NVIDIA GeForce GTX 1660 (6 GB) | 100% | N/A | N/A | N/A | N/A |
| NVIDIA GeForce GTX 1080 Ti (11 GB) | 100% | -36% | -37% | -60% | -63% |
| NVIDIA GeForce GTX 1080 (8 GB) | 100% | -40% | -43% | -64% | -67% |
| NVIDIA GeForce GTX 1070 Ti (8 GB) | 100% | -38% | -42% | -62% | -65% |
| NVIDIA GeForce GTX 1070 (8 GB) | 100% | -36% | -42% | -63% | -66% |
| NVIDIA GeForce GTX 1060 (6 GB) | 100% | N/A | N/A | N/A | N/A |
Source: 3dnews.ru
