

Hello, I am Sergey Yalantsev, developing in Yandex.Cloud. Previously, I led the development of the L7 load balancer for the Yandex portal — my colleagues joke that whatever I do, it turns into a load balancer. I will share with Habr readers how to manage load in a cloud platform, what we envision as the ideal tool for achieving this goal, and how we are progressing toward building this tool.
To begin, let’s introduce some terms:
- VIP (Virtual IP) — the IP address of the load balancer
- Server, backend, instance — a virtual machine running an application
- RIP (Real IP) — the IP address of the server
- Healthcheck — checking the server's readiness
- Availability Zone, AZ — isolated infrastructure in a data center
- Region — a combination of different AZs
Load balancers solve three main tasks: performing the actual balancing, improving service resilience, and simplifying its scaling. Resilience is ensured by automatic traffic management: the load balancer monitors the application's status and excludes instances that fail the health check from balancing. Scaling is achieved through even distribution of load across instances, as well as updating the list of instances on the fly. If balancing is not even enough, some instances may experience load exceeding their operational limits, making the service less reliable.
Load balancers are often classified by the protocol level from the OSI model at which they operate. The Cloud Load Balancer operates at the TCP level, corresponding to layer four, L4.
Let’s move on to an overview of the Cloud Load Balancer architecture. We will gradually increase the level of detail. We categorize the components of the load balancer into three classes. The config plane class is responsible for user interaction and maintains the desired state of the system. The control plane stores the current state of the system and manages the data plane systems, which are responsible for delivering traffic from clients to your instances.
Data plane
Traffic reaches expensive devices known as border routers. To improve fault tolerance, several of these devices operate simultaneously in a single data center. The traffic then reaches load balancers that announce anycast IP addresses to all AZs via BGP.
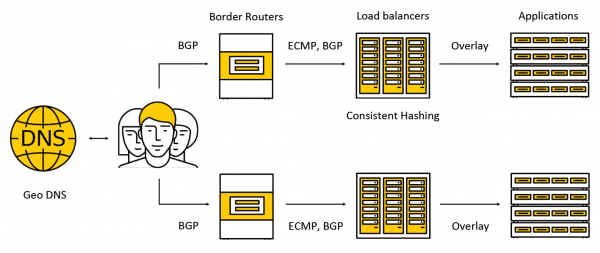
Traffic is transmitted using ECMP — a routing strategy where multiple equally good routes to the destination (in our case, the destination IP address) can exist, and packets can be sent through any of them. We also support operation across multiple availability zones using the following scheme: we announce the address in each zone, and traffic is directed to the nearest zone without going beyond it. Further in the post, we will take a closer look at what happens to the traffic.
Config plane
The key component of the config plane is the API, through which the main operations with load balancers are performed: creating, deleting, modifying the composition of instances, obtaining healthcheck results, etc. On one hand, this is a REST API; on the other hand, we in the Cloud frequently use the gRPC framework, so we 'translate' REST into gRPC and then use only gRPC. Any request leads to the creation of a series of asynchronous idempotent tasks that run on a shared pool of Yandex.Cloud workers. Tasks are designed in such a way that they can be paused at any time and resumed later. This ensures scalability, repeatability, and logability of operations.
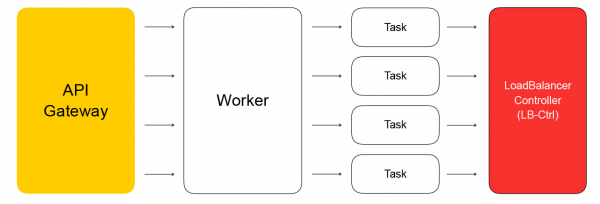
As a result, a task from the API will make a request to the load balancer service controller, which is written in Go. It can add and remove load balancers, change the composition of backends, and modify settings.
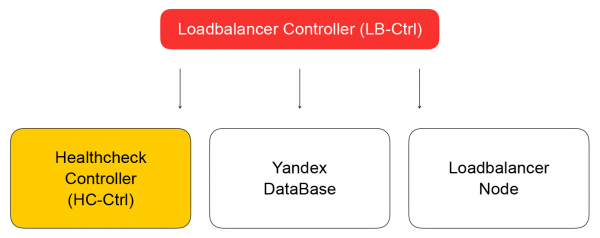
The service stores its state in Yandex Database — a distributed managed DB that you will soon be able to use as well. In Yandex.Cloud, as we have already stated , the dog food concept applies: if we use our own services, our clients will also be happy to use them. Yandex Database is an example of this concept in action. We store all our data in YDB, and we do not have to worry about maintaining and scaling the database: these problems are solved for us, and we use the database as a service.
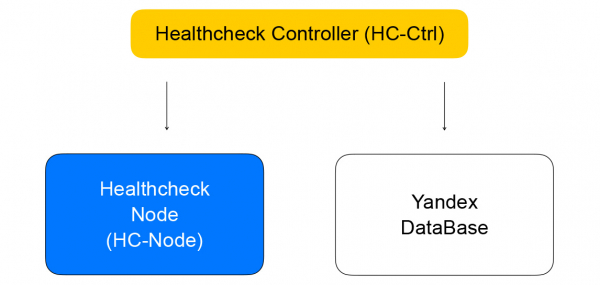
Returning to the load balancer controller. Its task is to keep track of the load balancer information and send a readiness check task to the healthcheck controller.
Healthcheck controller
It receives requests to modify the check rules, saves them in YDB, distributes tasks among the healthcheck nodes, and aggregates the results, which are then saved in the database and sent to the loadbalancer controller. The loadbalancer controller, in turn, sends a request to modify the cluster composition to the data plane on the loadbalancer-node, which I will discuss below.
Let's talk more about healthchecks. They can be categorized into several classes. Checks have different success criteria. TCP checks need to successfully establish a connection within a fixed time. HTTP checks require both a successful connection and a response with a status code of 200.
Checks also differ by action class - they can be active or passive. Passive checks simply monitor what's happening with the traffic without taking any special action. This doesn't work well on L4, as it depends on the logic of higher-level protocols: there is no information on L4 about how long the operation took and whether the connection was good or bad. Active checks require the load balancer to send requests to each server instance.
Most load balancers perform "liveness" checks independently. In the Cloud, we decided to separate these parts of the system to increase scalability. This approach allows us to increase the number of load balancers while maintaining the number of healthcheck requests to the service. Checks are performed by separate healthcheck nodes, which shard and replicate the check targets. Checks cannot be made from a single host, as it may fail. Then, we would not receive the status of the instances it checked. We perform checks on any instance from at least three healthcheck nodes. We shard check targets among the nodes using consistent hashing algorithms.
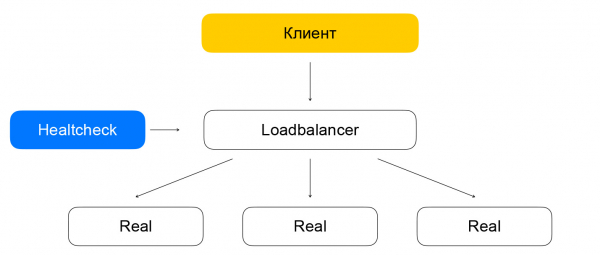
Separation of load balancing and health checks can lead to issues. If a health check node makes requests to an instance, bypassing the load balancer (which is currently not serving traffic), a strange situation arises: the resource appears to be alive, but no traffic will reach it. We address this problem by ensuring that health check traffic goes through the load balancers. In other words, the scheme for routing client traffic and health check traffic differs minimally: in both cases, packets will reach the load balancers, which will deliver them to the target resources.
The distinction is that clients make requests to the VIP, while health checks target each individual RIP. This presents an interesting problem: we allow our users to create resources in gray IP networks. Imagine there are two different cloud owners who have hidden their services behind load balancers. Each one of them has resources in the subnet 10.0.0.1/24, with identical addresses. It is necessary to somehow differentiate them, and this requires an understanding of the architecture of the Yandex.Cloud virtual network. Details are better understood in , it is currently important to note that the network is layered and contains tunnels that can be distinguished by the subnet ID.
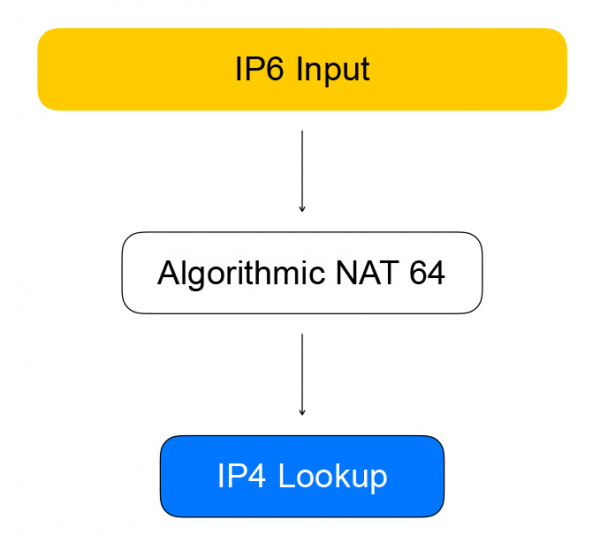
Health check nodes communicate with load balancers using so-called quasi-IPv6 addresses. A quasi-address is an IPv6 address that embeds an IPv4 address and the user's subnet ID. The traffic reaches the load balancer, which extracts the IPv4 address of the resource, replaces the IPv6 with IPv4, and sends the packet into the user's network.
The reverse traffic follows the same route: the load balancer sees that the destination is a gray network from health checkers and converts IPv4 to IPv6.
VPP is the heart of the data plane.
The load balancer is implemented using Vector Packet Processing (VPP) technology—a framework from Cisco for packet processing of network traffic. In our case, the framework operates above the user-space management library for network devices—Data Plane Development Kit (DPDK). This ensures high performance in packet processing: there are significantly fewer interrupts in the kernel, and no context switches between kernel space and user space.
VPP goes even further, extracting more performance from the system by batching packets. The performance enhancement occurs through aggressive utilization of modern processor caches. Both data caches (using 'vectors' to process packets with closely located data) and instruction caches are employed; in VPP, packet processing follows a graph, with nodes that contain functions performing a single task.
For example, the processing of IP packets in VPP occurs as follows: first, in the parsing node, the packet headers are parsed, and then they are sent to a node that forwards the packets according to the routing tables.
A bit of hardcore. The authors of VPP do not compromise on the use of processor caches, which is why typical vector packet processing code contains manual vectorization: there is a processing loop handling the case of 'we have four packets in the queue,' then similarly for two, and then for one. Prefetch instructions are often used to load data into caches for quicker access on subsequent iterations.
n_left_from = frame->n_vectors;
while (n_left_from > 0)
{
    vlib_get_next_frame(vm, node, next_index, to_next, n_left_to_next);
    // ...
    while (n_left_from >= 4 && n_left_to_next >= 2)
    {
        // processing multiple packets at once
        u32 next0 = SAMPLE_NEXT_INTERFACE_OUTPUT;
        u32 next1 = SAMPLE_NEXT_INTERFACE_OUTPUT;
        // ...
        /* Prefetch next iteration. */
        {
            vlib_buffer_t *p2, *p3;

            p2 = vlib_get_buffer(vm, from[2]);
            p3 = vlib_get_buffer(vm, from[3]);

            vlib_prefetch_buffer_header(p2, LOAD);
            vlib_prefetch_buffer_header(p3, LOAD);

            CLIB_PREFETCH(p2->data, CLIB_CACHE_LINE_BYTES, STORE);
            CLIB_PREFETCH(p3->data, CLIB_CACHE_LINE_BYTES, STORE);
        }
        // actually process data
        /* verify speculative enqueues, maybe switch current next frame */
        vlib_validate_buffer_enqueue_x2(vm, node, next_index,
                to_next, n_left_to_next,
                bi0, bi1, next0, next1);
    }

    while (n_left_from > 0 && n_left_to_next > 0)
    {
        // processing packets by one
    }

    // processed batch
    vlib_put_next_frame(vm, node, next_index, n_left_to_next);
}
Thus, Healthchecks request via IPv6 to VPP, which transforms them into IPv4. This is handled by the graph node we call algorithmic NAT. There is a similar algorithmic NAT node for reverse traffic (and the conversion from IPv6 to IPv4).
Direct traffic from the load balancer clients goes through the graph nodes that perform the actual load balancing.
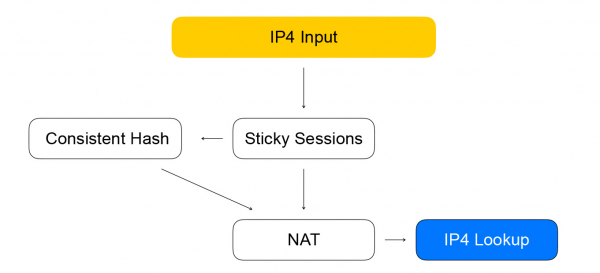
The first node is sticky sessions. It stores a hash from for established sessions. The 5-tuple includes the address and port of the client from which the information is transmitted, the address and ports of the resources available for receiving traffic, as well as the network protocol.
The hash of the 5-tuple helps us perform fewer calculations in the subsequent node of consistent hashing and better handle changes in the resource list behind the load balancer. When a packet arrives at the load balancer for which there is no session, it is sent to the consistent hashing node. Here, the load balancing occurs using consistent hashing: we choose a resource from the list of available 'live' resources. The packets are then sent to the NAT node, which performs the actual destination address replacement and recalculation of checksums. As you can see, we follow the VPP rules — like matches like, grouping similar computations to increase CPU cache efficiency.
Consistent hashing
Why did we choose it, and what is it, to begin with? First, let’s take a look at the previous task — choosing a resource from the list.
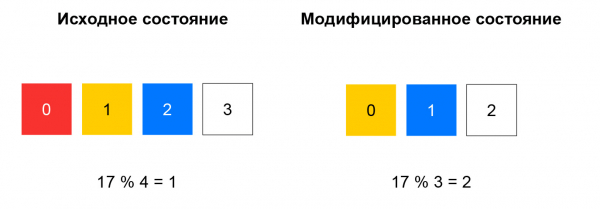
In inconsistent hashing, the hash of the incoming packet is computed, and the resource is chosen from the list based on the remainder of dividing this hash by the number of resources. As long as the list remains unchanged, this scheme works well: we always send packets with the same 5-tuple to the same instance. However, if, for example, some resource stops responding to health checks, the selection for a significant portion of hashes will change. The client's TCP connections will break: a packet that previously went to instance A may start going to instance B, which is not familiar with the session for this packet.
Consistent hashing solves the problem described. The concept can be most easily explained as follows: imagine you have a ring on which you distribute resources by hash (for example, by IP:port). Choosing a resource is like turning the wheel at an angle determined by the hash of the packet.
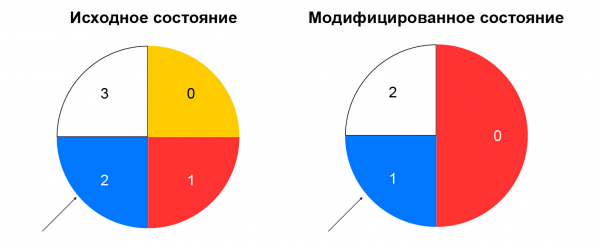
This minimizes traffic redistribution when the composition of resources changes. Removing a resource will only affect that part of the consistent hashing ring where this resource was located. Adding a resource also changes the distribution, but we have a sticky sessions node that allows already established sessions not to switch to new resources.
We examined what happens with direct traffic between the load balancer and resources. Now let's look at reverse traffic. It follows the same scheme as health check traffic — through algorithmic NAT, meaning through reverse NAT 44 for client traffic and NAT 46 for health check traffic. We stick to our own scheme: unifying health check traffic and the real traffic of users.
Loadbalancer-node and components in assembly
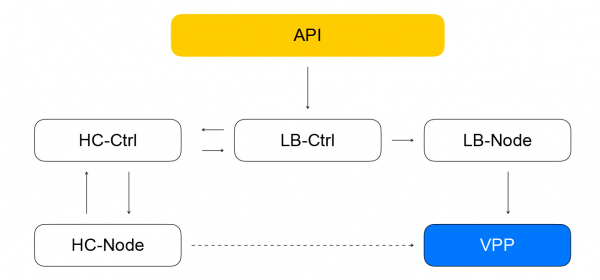
The composition of load balancers and resources in VPP is reported by the local service — loadbalancer-node. It subscribes to the event stream from loadbalancer-controller, is capable of constructing the difference between the current state of VPP and the target state received from the controller. We get a closed system: events from the API arrive at the load balancer controller, which assigns tasks to the health check controller to verify the 'liveness' of resources. The latter, in turn, assigns tasks to healthcheck-node and aggregates the results, which are then sent back to the load balancer controller. Loadbalancer-node subscribes to events from the controller and modifies the state of VPP. In such a system, each service knows only what is necessary about neighboring services. The number of connections is limited, and we have the ability to independently operate and scale different segments.
Questions we managed to avoid
All our services in the control plane are written in Go and exhibit good scalability and reliability characteristics. Go offers many open-source libraries for building distributed systems. We actively use GRPC; all components contain an open-source implementation of service discovery — our services monitor each other's availability, can change their composition dynamically, and we have tied this with GRPC load balancing. We also use an open-source solution for metrics. In the data plane, we achieved decent performance and a large resource reserve: it turned out to be quite challenging to set up a testbed that could bottleneck on the performance of VPP rather than the hardware network card.
Problems and Solutions
What didn't work very well? In Go, memory management is automatic, but memory leaks can still occur. The easiest way to deal with them is to run goroutines and remember to terminate them. Conclusion: keep an eye on the memory consumption of Go programs. A good indicator is often the number of goroutines. There’s also a positive aspect in this story: in Go, you can easily get data via runtime regarding memory consumption, the number of goroutines started, and many other parameters.
Moreover, Go may not be the best choice for functional tests. They are quite verbose, and the standard approach of 'running everything in CI in batches' doesn't fit them well. The thing is, functional tests are more resource-intensive, leading to real timeouts. Because of this, tests may fail since the CPU is busy with unit tests. Conclusion: whenever possible, execute 'heavy' tests separately from unit tests.
Microservice event-driven architecture is more complex than a monolith: grepping logs across dozens of different machines is not very convenient. Conclusion: if you are building microservices, think about tracing from the start.
Our plans
We will launch an internal load balancer, an IPv6 load balancer, add support for Kubernetes scenarios, continue to shard our services (currently, only healthcheck-node and healthcheck-ctrl are sharded), add new healthchecks, and implement intelligent aggregation of checks. We are considering making our services even more independent—so that they communicate not directly with each other, but through a message queue. Recently, an SQS-compatible service has appeared in the Cloud. .
Recently, Yandex Load Balancer had its public release. Explore the service, manage your load balancers in a way that suits you, and enhance the resilience of your projects!
Source: habr.com
