

During the transition from a monolithic application to a microservices architecture, we encounter new challenges.
In a monolithic application, it's usually sufficient to determine where the error occurred within the system. Most likely, the issue lies within the monolith's code or the database. However, when we start looking for problems in a microservices architecture, things are no longer so obvious. We have to trace the entire path taken by the request from start to finish, distinguishing it from hundreds of microservices. Moreover, many of these have their own storage systems where both logical errors and performance and resilience issues can arise.

I spent a long time searching for a tool that would help solve such problems (I wrote about it on Habr: , ), but ultimately created my own open-source solution. In this article, I discuss the advantages of the service mesh approach and share a new tool for its implementation.
Distributed tracing is a common solution for finding errors in distributed systems. But what if such an approach for collecting information on network interactions hasn't been implemented in the system yet, or worse, if it works well in part of the system but not in another, as it's not added to the older services? To determine the exact root cause of a problem, it's crucial to have a complete picture of what is happening in the system. It's especially important to understand which microservices are involved in the critical business paths.
Here, the service mesh approach can come to our aid, taking on all the machinery for collecting network information at a level lower than where the services themselves operate. This approach allows us to intercept all traffic and analyze it on the fly, without the applications even needing to be aware of it.
service mesh approach
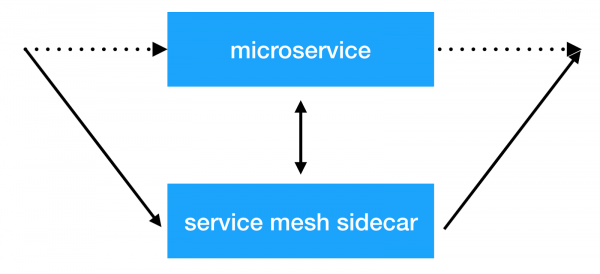
The main idea of the service mesh approach is to add another layer of infrastructure over the network, enabling us to perform various tasks with inter-service communication. Most implementations work as follows: an additional sidecar container with a transparent proxy is added to each microservice, through which all incoming and outgoing traffic of the service is routed. This is where we can implement client-side load balancing, apply security policies, impose request limits, and collect important information about service interactions in production.
Solutions
There are already several implementations of this approach: and . They offer numerous out-of-the-box features. However, this also results in a significant resource overhead. Moreover, the larger the cluster where such a system operates, the more resources are required to maintain the new infrastructure. At Avito, we operate Kubernetes clusters containing thousands of service instances (and this number continues to grow rapidly). In the current implementation, Istio consumes approximately 300MB of RAM for each service instance. Due to the extensive feature set, transparent load balancing also impacts the total response time of services (by up to 10ms).
As a result, we examined which features we needed right now and concluded that the primary reason for implementing such solutions was the ability to collect tracing information from the entire system transparently. We also wanted to have control over service interactions and perform various manipulations with the headers passed between services.
Ultimately, we arrived at our solution: .
Netramesh
— a lightweight service mesh solution with the potential for infinite scalability regardless of the number of services in the system.
The main goals of the new solution were low resource overhead and high performance. Among the key features, we wanted to be able to transparently send tracing spans to our Jaeger system right from the start.
Today, most cloud solutions are implemented in Golang. There are, of course, good reasons for this. Writing network applications in Golang that work asynchronously with I/O and can scale across cores is both convenient and relatively straightforward. Importantly, the performance is sufficient for addressing this task. That's why we also chose Golang.
Performance
We focused our efforts on achieving maximum performance. For a solution that is deployed alongside every service instance, it requires minimal memory and CPU time consumption. And, of course, the response latency must also be low.
Let's take a look at the results we achieved.
RAM
Netramesh consumes around 10Mb with no traffic and up to 50Mb at maximum load with 10,000 RPS on a single instance.
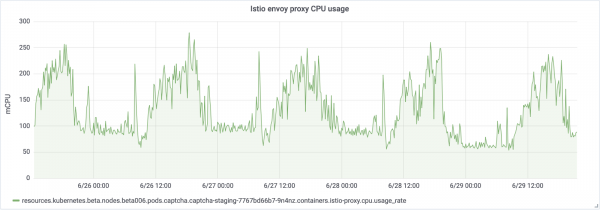
The Istio envoy proxy consistently consumes around 300Mb in our clusters with thousands of instances. This prevents it from scaling across the entire cluster.
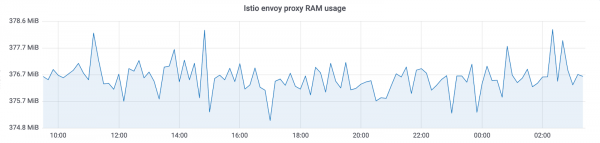
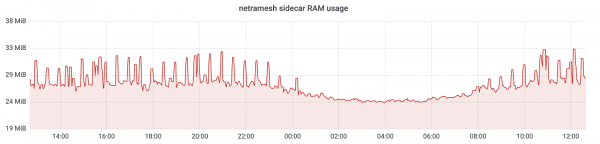
With Netramesh, we achieved a reduction in memory consumption by approximately 10 times.
CPU
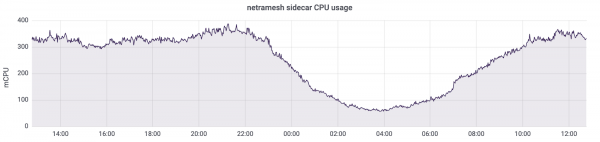
CPU usage remains relatively constant under load. It depends on the number of requests per unit time to the sidecar. Values at 3,000 requests per second at peak:
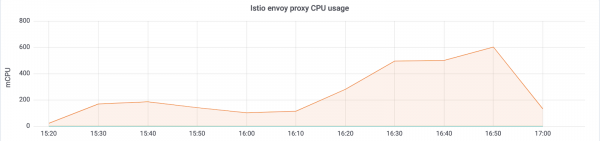
There's another important point: Netramesh is a solution without a control plane and does not consume CPU time under no load. With Istio, sidecars continuously update service endpoints. As a result, we can see this scenario under no load:
We use HTTP/1 for inter-service communication. The response time increase in Istio when proxying through envoy was up to 5-10ms, which is quite significant for services that need to respond within milliseconds. With Netramesh, this time has decreased to 0.5-2ms.
Scalability
The small amount of resources used by each proxy allows it to be placed next to each service. Netramesh was deliberately designed without a control plane component to maintain the lightweight nature of each sidecar. Often in service mesh solutions, the control plane disseminates service discovery information to each sidecar. Along with this information come details about timeouts and load balancing settings. All of this enables many useful features but, unfortunately, increases the size of sidecars.
Service discovery

Netramesh does not add any additional mechanisms for service discovery. All traffic is transparently proxied through the netra sidecar.
Netramesh supports the HTTP/1 application protocol. A configurable list of ports is used for its definition. Typically, the system has several ports for HTTP interactions. For example, we use ports 80, 8890, and 8080 for service interactions and external requests. In this case, they can be set using the environment variable NETRA_HTTP_PORTS.
If you are using Kubernetes as the orchestrator and its Service mechanism for intra-cluster communication between services, the mechanism remains exactly the same. First, the microservice obtains the service IP address using kube-dns and establishes a new connection to it. This connection is first made with the local netra-sidecar, and all TCP packets initially arrive at netra. Then, the netra-sidecar establishes a connection with the original destination. NAT on the pod IP on the node remains the same as without netra.
Distributed tracing and context propagation
Netramesh provides the functionality needed to send tracing spans about HTTP interactions. The netra-sidecar parses the HTTP protocol, measures request latency, and extracts necessary information from the HTTP headers. Ultimately, we obtain all traces in a single Jaeger system. For fine-tuning, you can also use environment variables provided by the official library .
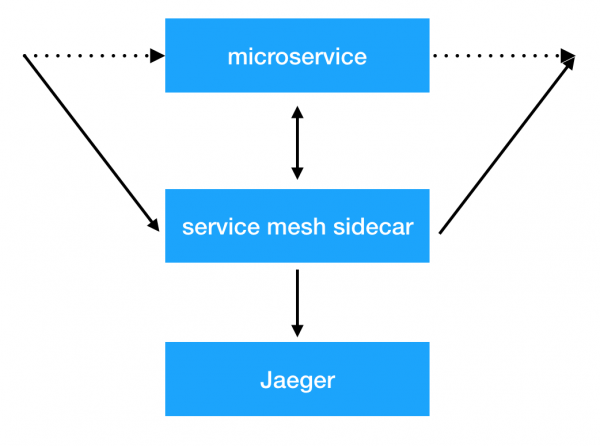
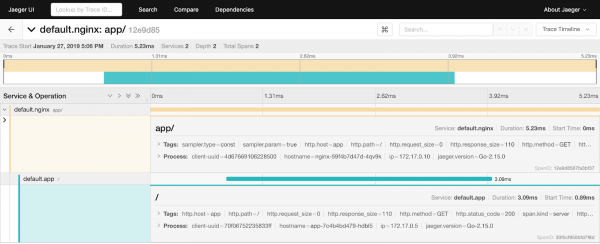
But there is a problem. Until the services generate and propagate a special uber header, we will not see the connected tracing spans in the system. And that is what we need for quick fault diagnosis. Here, Netramesh has a solution again. The proxy reads the HTTP headers, and if they do not contain the uber trace id, it generates one. Netramesh also stores information about incoming and outgoing requests in the sidecar and matches them by enriching the outgoing requests with the necessary headers. All that is required in the services is to propagate just one header X-Request-Id, which can be configured using the environment variable NETRA_HTTP_REQUEST_ID_HEADER_NAME. To control the size of the context in Netramesh, the following environment variables can be set: NETRA_TRACING_CONTEXT_EXPIRATION_MILLISECONDS (the time during which the context will be retained) and NETRA_TRACING_CONTEXT_CLEANUP_INTERVAL (the frequency of context cleanup).
It is also possible to combine multiple paths in your system by tagging them with a special session marker. Netra allows you to set HTTP_HEADER_TAG_MAP to transform HTTP headers into corresponding tracing span tags. This can be especially useful for testing. After running a functional test, you can see which part of the system was affected by filtering by the appropriate session key.
Identifying the source of the request
To determine the origin of the request, you can use the automatic header addition feature with the source. Using the environment variable NETRA_HTTP_X_SOURCE_HEADER_NAME you can set the name of the header that will be automatically added. By using NETRA_HTTP_X_SOURCE_VALUE you can specify the value that will be set for the X-Source header on all outgoing requests.
This allows for a unified dissemination of this useful header across the network. You can then use it in services and add it to logs and metrics.
Traffic routing and the inner workings of Netramesh
Netramesh consists of two main components. The first, netra-init, sets network rules for intercepting traffic. It uses to intercept all or a portion of the traffic to the sidecar, which is the second main component of Netramesh. You can configure which specific ports to intercept for incoming and outgoing TCP sessions: INBOUND_INTERCEPT_PORTS, OUTBOUND_INTERCEPT_PORTS.
The tool also has an interesting feature — probabilistic routing. If you use Netramesh solely for collecting tracing spans, you can save resources in the production environment by enabling probabilistic routing with the variables NETRA_INBOUND_PROBABILITY and NETRA_OUTBOUND_PROBABILITY (from 0 to 1). The default value is 1 (all traffic is intercepted).
After successfully intercepting, the netra sidecar takes the new connection and uses SO_ORIGINAL_DST the socket option to get the original destination. Netra then opens a new connection to the original IP address and establishes a bidirectional TCP communication between the parties, monitoring all passing traffic. If the port is defined as HTTP, Netra attempts to parse it and trace it. If HTTP parsing fails, Netra falls back to TCP and transparently proxies the bytes.
Building a Dependency Graph
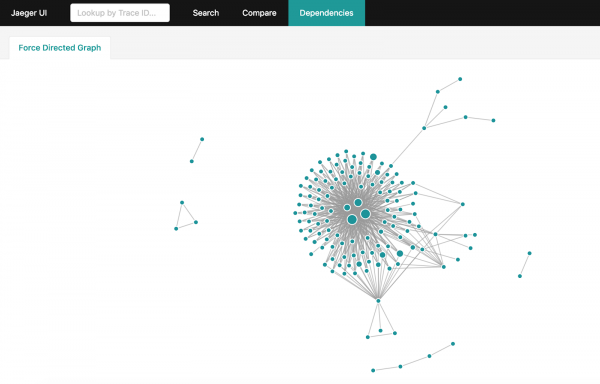
After receiving a large amount of tracing information in Jaeger, you may want to obtain a complete interaction graph in the system. However, if your system is quite loaded and billions of tracing spans accumulate in a day, aggregating them becomes a rather complex task. There is an official way to do this: . Nevertheless, it will take hours to build a complete graph and will require downloading the entire dataset from Jaeger for the past day.
If you are using Elasticsearch to store tracing spans, you can use a , which will build the same graph in minutes, leveraging the features and capabilities of Elasticsearch.
How to Use Netramesh
Netra can be easily added to any service running under any orchestrator. You can see an example .
Currently, there is no automatic injection of the sidecar into services with Netra, but there are plans for implementation.
The Future of Netramesh
The main goal is to achieve minimal resource costs and high performance while providing essential capabilities for observability and inter-service interaction control.
In the future, Netramesh will support other application layer protocols beyond HTTP. L7 routing capabilities will be available soon.
Use Netramesh if you encounter similar issues, and feel free to write us your questions and suggestions.
Source: habr.com
