

Introduction
While deploying yet another system, we encountered the need to process a large amount of diverse logs. We chose ELK as our tool. This article will discuss our experience in configuring this stack.
We don't aim to describe all its capabilities but want to focus on solving practical tasks. This is prompted by the fact that, despite the available extensive documentation and ready-made images, there are quite a few pitfalls, at least we encountered them.
We deployed the stack using docker-compose. Moreover, we had a well-written docker-compose.yml that allowed us to set up the stack almost without problems. It seemed to us that victory was close, just a bit more tweaking to fit our needs and everything would be set.
Unfortunately, our attempt to fine-tune the system for receiving and processing logs from our application was not successful right away. Therefore, we decided to study each component separately before returning to their connections.
So, we started with logstash.
Environment, deployment, launching Logstash in a container
To deploy, we use docker-compose; the experiments described here were conducted on MacOS and Ubuntu 18.04.
The logstash image we specified in our original docker-compose.yml is docker.elastic.co/logstash/logstash:6.3.2
We will use this for experiments.
To launch logstash, we wrote a separate docker-compose.yml. Of course, we could have run the image from the command line, but we were solving a specific task where everything is launched from docker-compose.
Briefly about configuration files
As stated in the description, logstash can be started for a single channel, in which case it needs to receive a *.conf file, or for multiple channels, in which case it needs to receive a pipelines.yml file that, in turn, will reference the .conf files for each channel.
We chose the second route. It seemed more universal and scalable to us. Therefore, we created pipelines.yml and made a pipelines directory where we would place the .conf files for each channel.
Inside the container, there is another configuration file — logstash.yml. We leave it untouched and use it as is.
So, the structure of our directories is:
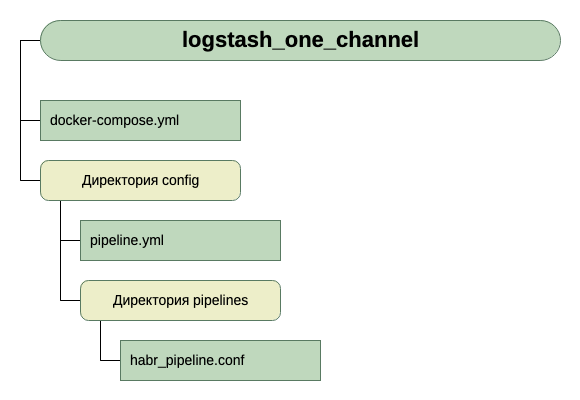
For input, we will assume it is TCP on port 5046, and for output, we will use stdout.
Here is a simple configuration for the initial launch. After all, the primary goal is to start it up.
So, we have this docker-compose.yml
version: '3'

networks:
  elk:

volumes:
  elasticsearch:
    driver: local

services:

  logstash:
    container_name: logstash_one_channel
    image: docker.elastic.co/logstash/logstash:6.3.2
    networks:
      	- elk
    ports:
      	- 5046:5046
    volumes:
      	- ./config/pipelines.yml:/usr/share/logstash/config/pipelines.yml:ro
	- ./config/pipelines:/usr/share/logstash/config/pipelines:ro
What do we see here?
- Networks and volumes were taken from the original docker-compose.yml (the one where the entire stack is launched) and I think they don't significantly affect the overall picture.
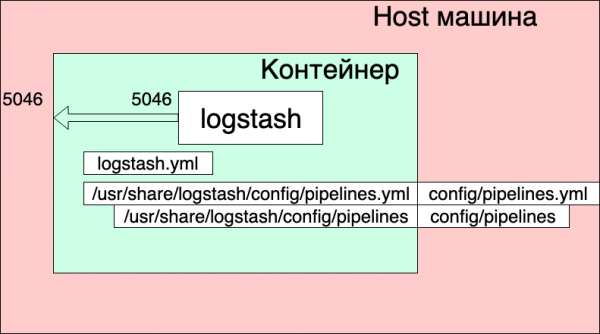
- We are creating one service (services) logstash, from the image docker.elastic.co/logstash/logstash:6.3.2 and naming it logstash_one_channel.
- We are forwarding port 5046 into the container to the same internal port.
- We are mapping our configuration file ./config/pipelines.yml to the file /usr/share/logstash/config/pipelines.yml inside the container, where logstash will pick it up, and making it read-only, just in case.
- We are mapping the directory ./config/pipelines, where we have the configuration files, to the directory /usr/share/logstash/config/pipelines and also making it read-only.
The file pipelines.yml
- pipeline.id: HABR
  pipeline.workers: 1
  pipeline.batch.size: 1
  path.config: "./config/pipelines/habr_pipeline.conf"
Here, one channel is described with the identifier HABR and the path to its configuration file.
And finally the file "./config/pipelines/habr_pipeline.conf"
input {
  tcp {
    port => "5046"
   }
  }
filter {
  mutate {
    add_field => [ "habra_field", "Hello Habr" ]
    }
  }
output {
  stdout {

    }
  }
Let's not get into its description for now, let's try to run it:
to start the containers. This command will bring up 3 containers:
What do we see?
The container has started. We can check its operation:
echo '13123123123123123123123213123213' | nc localhost 5046
And we see a response in the container console:
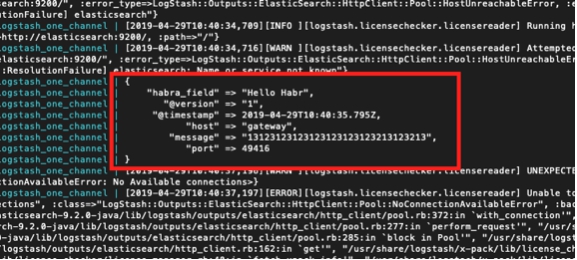
But at the same time, we also see:
logstash_one_channel | [2019-04-29T11:28:59,790][ERROR][logstash.licensechecker.licensereader] Unable to retrieve license information from the license server {:message=>"Elasticsearch Unreachable: [http://elasticsearch:9200/][Manticore::ResolutionFailure] elasticsearch", …
logstash_one_channel | [2019-04-29T11:28:59,894][INFO ][logstash.pipeline ] Pipeline started successfully {:pipeline_id=>".monitoring-logstash", :thread=>"#"}
logstash_one_channel | [2019-04-29T11:28:59,988][INFO ][logstash.agent ] Pipelines running {:count=>2, :running_pipelines=>[:HABR, :".monitoring-logstash"], :non_running_pipelines=>[]}
logstash_one_channel | [2019-04-29T11:29:00,015][ERROR][logstash.inputs.metrics ] X-Pack is installed on Logstash but not on Elasticsearch. Please install X-Pack on Elasticsearch to use the monitoring feature. Other features may be available.
logstash_one_channel | [2019-04-29T11:29:00,526][INFO ][logstash.agent ] Successfully started Logstash API endpoint {:port=>9600}
logstash_one_channel | [2019-04-29T11:29:04,478][INFO ][logstash.outputs.elasticsearch] Running health check to see if an Elasticsearch connection is working {:healthcheck_url=>http://elasticsearch:9200/, :path=>"/"}
logstash_one_channel | [2019-04-29T11:29:04,487][WARN ][logstash.outputs.elasticsearch] Attempted to resurrect connection to dead ES instance, but got an error. {:url=>":9200/", :error_type=>LogStash::Outputs::ElasticSearch::HttpClient::Pool::HostUnreachableError, :error=>"Elasticsearch Unreachable: [http://elasticsearch:9200/][Manticore::ResolutionFailure] elasticsearch"}
logstash_one_channel | [2019-04-29T11:29:04,704][INFO ][logstash.licensechecker.licensereader] Running health check to see if an Elasticsearch connection is working {:healthcheck_url=http://elasticsearch:9200/, :path="/"}
logstash_one_channel | [2019-04-29T11:29:04,710][WARN ][logstash.licensechecker.licensereader] Attempted to resurrect connection to dead ES instance, but got an error. {:url=>":9200/", :error_type=>LogStash::Outputs::ElasticSearch::HttpClient::Pool::HostUnreachableError, :error=>"Elasticsearch Unreachable: [http://elasticsearch:9200/][Manticore::ResolutionFailure] elasticsearch"}
And our log keeps climbing up all the time.
Here I highlighted in green the message indicating that the pipeline has started successfully, in red — the error message, and in yellow — the message about the attempt to connect to :9200.
This happens because the check for the availability of Elasticsearch is included in the logstash.conf file that comes with the image. Logstash assumes that it operates as part of the Elk stack, but we have separated it.
You can work, but it's inconvenient.
The solution is to disable this check through the environment variable XPACK_MONITORING_ENABLED.
Let's make a change in docker-compose.yml and restart it:
version: '3'

networks:
  elk:

volumes:
  elasticsearch:
    driver: local

services:

  logstash:
    container_name: logstash_one_channel
    image: docker.elastic.co/logstash/logstash:6.3.2
    networks:
      - elk
    environment:
      XPACK_MONITORING_ENABLED: "false"
    ports:
      - 5046:5046
    volumes:
      - ./config/pipelines.yml:/usr/share/logstash/config/pipelines.yml:ro
      - ./config/pipelines:/usr/share/logstash/config/pipelines:ro
Now everything is fine. The container is ready for experiments.
We can type again in the neighboring console:
echo '13123123123123123123123213123213' | nc localhost 5046
And see:
logstash_one_channel | {
logstash_one_channel |         "message" => "13123123123123123123123213123213",
logstash_one_channel |      "@timestamp" => 2019-04-29T11:43:44.582Z,
logstash_one_channel |        "@version" => "1",
logstash_one_channel |     "habra_field" => "Hello Habr",
logstash_one_channel |            "host" => "gateway",
logstash_one_channel |            "port" => 49418
logstash_one_channel | }
Operation within a single channel
So, we have started. Now we can actually devote time to configuring logstash itself. Let's not touch the pipelines.yml file for now, let's see what we can get by working with a single channel.
It should be noted that the overall principle of working with a channel configuration file is well described in the official documentation, here
If you want to read in Russian, we used this (but the query syntax there is old, so keep that in mind).
Let's go sequentially from the Input section. We have already seen the work through TCP. What else here might be interesting?
Test messages using heartbeat
There is an interesting opportunity to generate automated test messages.
To do this, you need to enable the heartbeat plugin in the input section.
input {
  heartbeat {
    message => "HeartBeat!"
   }
  }
We enable it and start receiving once per minute.
logstash_one_channel | {
logstash_one_channel |      "@timestamp" => 2019-04-29T13:52:04.567Z,
logstash_one_channel |     "habra_field" => "Hello Habr",
logstash_one_channel |         "message" => "HeartBeat!",
logstash_one_channel |        "@version" => "1",
logstash_one_channel |            "host" => "a0667e5c57ec"
logstash_one_channel | }
We want to receive more frequently, we need to add the interval parameter.
This way we will receive a message every 10 seconds.
input {
  heartbeat {
    message => "HeartBeat!"
    interval => 10
   }
  }
Receiving data from a file.
We also decided to check the file mode. If it works well with the file, then we might not need any agents, at least for local use.
According to the description, the operating mode should be similar to tail -f, i.e., it reads new lines or, as an option, reads the entire file.
So, what do we want to achieve:
- We want to receive lines that are added to a single log file.
- We want to receive data that is written to several log files, while having the option to differentiate where the data is coming from.
- We want to check that when logstash is restarted, it does not retrieve this data again.
- We want to check that if logstash is disabled while data continues to be written to the files, then when we start it up again, we will receive that data.
For the experiment, we will add another line to docker-compose.yml, opening the directory where we place the files.
version: '3'

networks:
  elk:

volumes:
  elasticsearch:
    driver: local

services:

  logstash:
    container_name: logstash_one_channel
    image: docker.elastic.co/logstash/logstash:6.3.2
    networks:
      - elk
    environment:
      XPACK_MONITORING_ENABLED: "false"
    ports:
      - 5046:5046
   volumes:
      - ./config/pipelines.yml:/usr/share/logstash/config/pipelines.yml:ro
      - ./config/pipelines:/usr/share/logstash/config/pipelines:ro
      - ./logs:/usr/share/logstash/input
And we will modify the input section in habr_pipeline.conf.
input {
  file {
    path => "/usr/share/logstash/input/*.log"
   }
  }
We are starting:
to start the containers. This command will bring up 3 containers:
To create and write log files, we will use the command:
echo '1' >> logs/number1.log
{
logstash_one_channel |            "host" => "ac2d4e3ef70f",
logstash_one_channel |     "habra_field" => "Hello Habr",
logstash_one_channel |      "@timestamp" => 2019-04-29T14:28:53.876Z,
logstash_one_channel |        "@version" => "1",
logstash_one_channel |         "message" => "1",
logstash_one_channel |            "path" => "/usr/share/logstash/input/number1.log"
logstash_one_channel | }
Aha, it's working!
At the same time, we see that the path field has been automatically added. This means that we will be able to filter records by it in the future.
Let's try again:
echo '2' >> logs/number1.log
{
logstash_one_channel |            "host" => "ac2d4e3ef70f",
logstash_one_channel |     "habra_field" => "Hello Habr",
logstash_one_channel |      "@timestamp" => 2019-04-29T14:28:59.906Z,
logstash_one_channel |        "@version" => "1",
logstash_one_channel |         "message" => "2",
logstash_one_channel |            "path" => "/usr/share/logstash/input/number1.log"
logstash_one_channel | }
And now to another file:
echo '1' >> logs/number2.log
{
logstash_one_channel |            "host" => "ac2d4e3ef70f",
logstash_one_channel |     "habra_field" => "Hello Habr",
logstash_one_channel |      "@timestamp" => 2019-04-29T14:29:26.061Z,
logstash_one_channel |        "@version" => "1",
logstash_one_channel |         "message" => "1",
logstash_one_channel |            "path" => "/usr/share/logstash/input/number2.log"
logstash_one_channel | }
Great! The file was picked up, the path was specified correctly, everything is fine.
Let's stop logstash and restart it. We'll wait. Silence. This means we are not receiving these records again.
And now for the boldest experiment.
We stop logstash and execute:
echo '3' >> logs/number2.log
echo '4' >> logs/number1.log
We restart logstash and see:
logstash_one_channel | {
logstash_one_channel |            "host" => "ac2d4e3ef70f",
logstash_one_channel |     "habra_field" => "Hello Habr",
logstash_one_channel |         "message" => "3",
logstash_one_channel |        "@version" => "1",
logstash_one_channel |            "path" => "/usr/share/logstash/input/number2.log",
logstash_one_channel |      "@timestamp" => 2019-04-29T14:48:50.589Z
logstash_one_channel | }
logstash_one_channel | {
logstash_one_channel |            "host" => "ac2d4e3ef70f",
logstash_one_channel |     "habra_field" => "Hello Habr",
logstash_one_channel |         "message" => "4",
logstash_one_channel |        "@version" => "1",
logstash_one_channel |            "path" => "/usr/share/logstash/input/number1.log",
logstash_one_channel |      "@timestamp" => 2019-04-29T14:48:50.856Z
logstash_one_channel | }
Hooray! Everything was picked up.
However, I need to warn about the following. If the logstash container is removed (docker stop logstash_one_channel && docker rm logstash_one_channel), nothing will be picked up. The position of the file it read was saved inside the container. If you run it "from scratch," it will only accept new lines.
Reading already existing files
Suppose we are running logstash for the first time, but we already have logs and we would like to process them.
If we run logstash with the input section that we used above, we will not get anything. Only new lines will be processed by logstash.
In order to pull lines from existing files, we need to add an additional line to the input section:
input {
  file {
    start_position => "beginning"
    path => "/usr/share/logstash/input/*.log"
   }
  }
However, there is a nuance: this only applies to new files that Logstash has not seen yet. For files that have already come into Logstash's view, it has already remembered their sizes and will now only take new entries in them.
Let's focus on this for our exploration of the input section. There are still many options, but for our further experiments, this will be enough.
Routing and transforming data
Let's try to solve the following task: suppose messages are coming from one channel, part of which are informational, while the other part are error messages. They differ by tags—some are INFO, others are ERROR.
We need to separate them in the output. That is, we will write informational messages to one channel and error messages to another.
To do this, we move from the input section to the filter and output.
Using the filter section, we will analyze the incoming message, obtaining a hash (key-value pairs) that we can work with; that is, we can parse according to conditions. In the output section, we'll select messages and send each to its respective channel.
Parsing a message using grok
To parse text strings and extract a set of fields from them, there is a special plugin in the filter section—grok.
Without aiming to provide a detailed description here (for that, I refer to ), let me provide a simple example.
To do this, we need to determine the format of the incoming strings. Mine look like this:
1 INFO message1
2 ERROR message2
That is, the identifier is in the first position, followed by INFO/ERROR, followed by a word with no spaces.
It's not difficult, but enough to understand the principle of operation.
So, in the filter section, in the grok plugin, we need to define a pattern for parsing our strings.
It will look like this:
filter {
  grok {
    match => { "message" => ["%{INT:message_id} %{LOGLEVEL:message_type} %{WORD:message_text}"] }
   }
  }
Essentially, this is a regular expression. Ready-made patterns are used, such as INT, LOGLEVEL, WORD. You can view their descriptions, along with other patterns, here
Now, passing through this filter, our string will turn into a hash of three fields: message_id, message_type, message_text.
These will be presented in the output section.
Routing messages in the output section using the if command
In the output section, as we recall, we intended to split messages into two streams. Those marked as INFO will be output to the console, while error messages will be output to a file.
How can we separate these messages? The task condition already suggests a solution — we have a dedicated field message_type, which can take only two values, INFO and ERROR. We will use this to make a selection with the if operator.
if [message_type] == "ERROR" {
        # Here we write to the file
       } else
     {
      # Here we write to stdout
    }
You can view the description of working with fields and operators in this section. .
Now, let's discuss the actual output.
Output to console is straightforward — stdout {}
However, output to a file — remember that we are running everything from a container and in order for the file we write the result to be accessible externally, we need to expose this directory in docker-compose.yml.
Total:
The output section of our file looks like this:
output {
  if [message_type] == "ERROR" {
    file {
          path => "/usr/share/logstash/output/test.log"
          codec => line { format => "custom format: %{message}"}
         }
    } else
     {stdout {
             }
     }
  }
In docker-compose.yml, add another volume for the output:
version: '3'

networks:
  elk:

volumes:
  elasticsearch:
    driver: local

services:

  logstash:
    container_name: logstash_one_channel
    image: docker.elastic.co/logstash/logstash:6.3.2
    networks:
      - elk
    environment:
      XPACK_MONITORING_ENABLED: "false"
    ports:
      - 5046:5046
   volumes:
      - ./config/pipelines.yml:/usr/share/logstash/config/pipelines.yml:ro
      - ./config/pipelines:/usr/share/logstash/config/pipelines:ro
      - ./logs:/usr/share/logstash/input
      - ./output:/usr/share/logstash/output
We run it, test it, and see the separation into two streams.
Source: habr.com
