

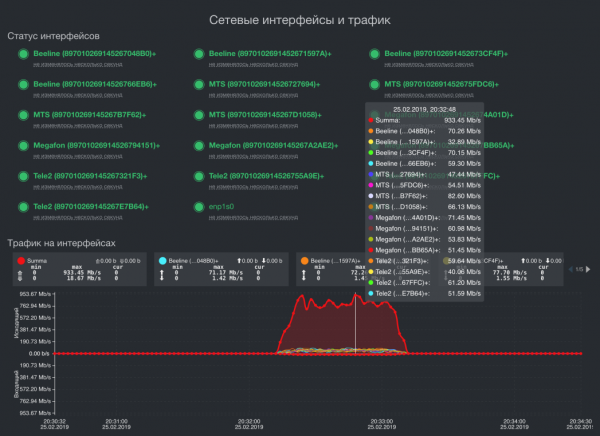
16 modems, 4 mobile operators = Outgoing speed 933.45 Mbps
Introduction
Hello! This is an article about how we developed a new monitoring system for ourselves. It differs from existing ones by allowing high-frequency synchronous metric retrieval and very low resource consumption. The polling frequency can reach 0.1 milliseconds with a synchronization accuracy between metrics of 10 nanoseconds. All binary files occupy 6 megabytes.
About the Project
We have a rather specific product. We create a comprehensive solution for aggregating bandwidth and redundancy of data transmission channels. This is when there are several channels, for example, Operator1 (40Mbps) + Operator2 (30Mbps) + Something else (5 Mbps), resulting in one stable and fast channel, with a speed of approximately: (40+30+5)x0.92=75×0.92=69 Mbps.
Such solutions are in demand where the capacity of any single channel is insufficient. For example, in transport, video surveillance systems, and real-time video streaming, broadcasting live television and radio broadcasts, and any rural areas where the only operators are the major four, and speeds on a single modem/channel are inadequate.
For each of these areas, we release a separate line of devices; however, their software part is almost identical and a quality monitoring system is one of its key modules, without which the product would be impossible.
Over the years, we have created a multi-tier, fast, cross-platform, and lightweight monitoring system. We wish to share it with the esteemed community.
Task Definition
The monitoring system ensures the retrieval of metrics from two fundamentally different classes: real-time metrics and all others. The following requirements were set for the monitoring system:
- High-frequency synchronous retrieval of real-time metrics and transmission to the communication management system without delays.
A high frequency and synchronization of various metrics is not just important; it is vital for analyzing the entropy of data transmission channels. If the average delay in one data transmission channel is 30 milliseconds, then an error in synchronization of just one millisecond with the other metrics will lead to a degradation of the resulting channel speed by approximately 5%. If we make a synchronization mistake of 1 millisecond across 4 channels, the speed degradation can easily drop to 30%. Additionally, the entropy in channels changes very quickly, so if we measure it less frequently than once every 0.5 milliseconds, on fast channels with low latency, we will see significant speed degradation. Of course, such precision is not required for all metrics and not in all conditions. When the delay in a channel is 500 milliseconds, and we are dealing with such channels, a one-millisecond error will hardly be noticeable. Also, for life support system metrics, a polling and synchronization frequency of 2 seconds is sufficient; however, the monitoring system itself should be capable of operating with ultra-high polling frequencies and ultra-accurate metric synchronization. - Minimal resource consumption and a unified stack.
The end device can be a powerful onboard system that analyzes the road situation or performs biometric identification of individuals, as well as a single-board computer the size of a palm that special forces soldiers carry under their body armor to transmit real-time video in poor connectivity conditions. Despite such a variety of architectures and computational powers, we would like to have a uniform software stack. - Umbrella Architecture
Metrics should be collected and aggregated on the end device, have a local storage system, and provide real-time and retrospective visualization. If there is a connection, data should be transmitted to the central monitoring system. When there is no connectivity, the queue for sending should accumulate and not consume RAM. - API for integration into the client's monitoring system because no one needs multiple monitoring systems. The client should collect data from any devices and networks into a single monitoring system.
What we achieved
To avoid overloading this already extensive long read, I won't provide examples and measurements of all monitoring systems. That would require another article. I will simply say that we couldn't find a monitoring system capable of taking two metrics simultaneously with an error of less than 1 millisecond and that works equally effectively on ARM architecture with 64MB of RAM as well as on x86_64 architecture with 32GB of RAM. Therefore, we decided to develop our own system that can manage all of this. Here’s what we created:
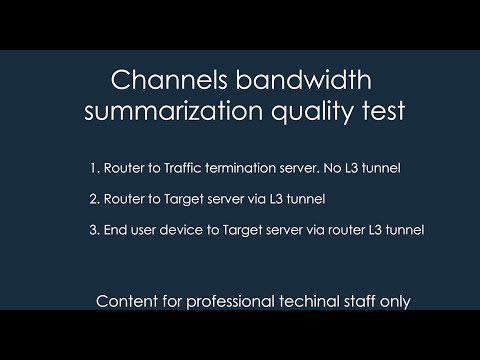
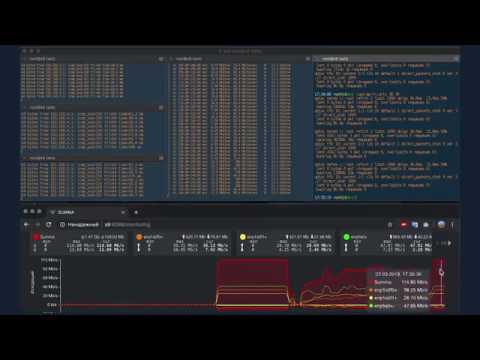
Summing the bandwidth of three channels for different network topologies
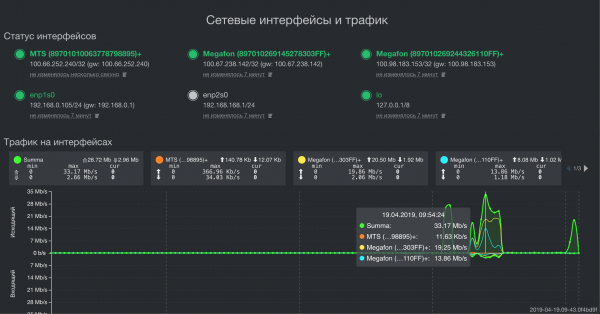
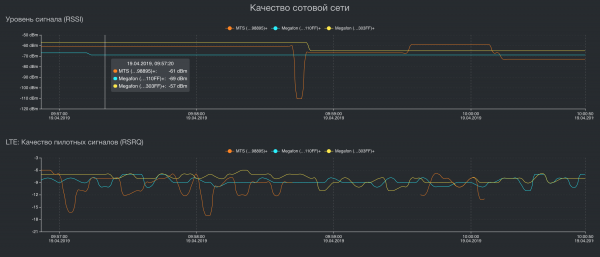
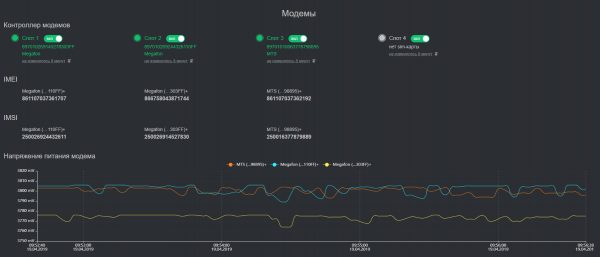
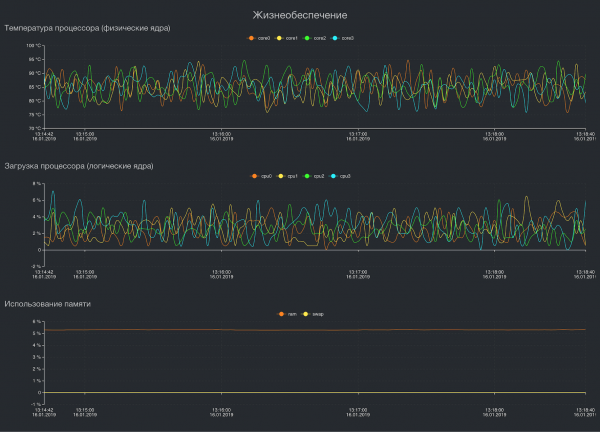
Visualization of some key metrics
Architecture
As the primary programming language, both on the device and in the data center, we use Golang. It has significantly simplified our lives with its implementation of concurrency and the ability to produce a single statically linked executable binary file for each service. As a result, we save considerably on resources, methods, and deployment traffic to end devices, as well as on development and debugging time.
The system is implemented based on a classic modular principle and contains several subsystems:
- Metric registration.
Each metric is handled by its own thread and synchronized through channels. We have achieved synchronization accuracy of up to 10 nanoseconds. - Metric storage.
We were deciding between building our own time series storage or using something already available. The database is needed for retrospective data that will be visualized later. That is, it does not contain data on delays in the channel every 0.5 milliseconds or error readings in the transport network, but it does have the speed on each interface every 500 milliseconds. In addition to high cross-platform requirements and low resource consumption, it's extremely important for us to be able to process the data where it is stored. This saves a tremendous amount of computational resources. Since 2016, we have been using the Tarantool DBMS in this project, and so far, we don’t see any replacement on the horizon. It is flexible, has optimal resource consumption, and more than adequate technical support. Tarantool also has a GIS module implemented. It is not as powerful as PostGIS, but it is sufficient for our tasks of storing some metrics related to location (relevant for transport). - Visualization of metrics
This part is relatively simple. We take data from the storage and display it either in real-time or retrospectively. - Data synchronization with the central monitoring system.
The central monitoring system receives data from all devices, stores it with a specified retrospective, and provides it to the Client's monitoring system via API. Unlike classic monitoring systems, where the 'head' collects data, we have the reverse scheme. Devices send data themselves when there is a connection. This is a very important point because it allows us to obtain data from the device during time periods when it was unavailable, without overloading channels and resources when the device is not accessible. For our central monitoring system, we use the Influx monitoring server. Unlike its counterparts, it can import retrospective data (i.e., with a timestamp different from the moment the metric was received). The collected metrics are visualized by a customized version of Grafana. This standard stack was chosen also because it has ready API integrations with practically any client monitoring system. - Data synchronization with the central device management system.
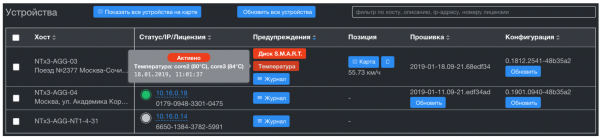
The device management system implements Zero Touch Provisioning (firmware updates, configuration, etc.) and, unlike the monitoring system, only receives issues related to the devices. These are the triggers for the operation of onboard hardware watchdog services and all life support system metrics: CPU and SSD temperature, CPU load, free space, and S.M.A.R.T health of the disks. The subsystem storage is also built on Tarantool. This gives us significant speed in aggregating time series across thousands of devices and completely solves the data synchronization issue with these devices. Tarantool has a great built-in queuing system and guaranteed delivery. We received this important feature out of the box, which is excellent!
Network Management System
What's Next
Currently, the weakest link we have is the central monitoring system. It is implemented 99.9% on a standard stack and has a number of drawbacks:
- InfluxDB loses data during power outages. Typically, the customer quickly retrieves everything coming from the devices, and the database does not hold data older than 5 minutes; however, this could become a problem in the future.
- Grafana has several issues with data aggregation and the synchronization of their display. The most common issue is when the database contains a time series with a 2-second interval starting, say, from 00:00:00, but Grafana begins displaying data in aggregation starting from +1 second. As a result, the user sees a fluctuating graph.
- Excessive code for API integration with third-party monitoring systems. It could be much more compact, and it could certainly be rewritten in Go.)
I assume you have all seen what Grafana looks like and know its problems, so I won't overload the post with pictures.
Conclusion
I deliberately chose not to describe the technical details but only outlined the core design of this system. First, it would take another article to fully describe the system technically. Second, not everyone will find this interesting. Please write in the comments what technical details you would like to know.
If anyone has questions beyond this article, you can reach me at a.rodin @ qedr.com
Source: habr.com
