

Currently, the topic of DevOps is trending. The continuous integration and delivery pipeline is being adopted by everyone who has the slightest interest. However, most do not always pay enough attention to ensuring the reliability of information systems at various stages of the CI/CD Pipeline. In this article, I would like to share my experience with automating software quality checks and implementing possible scenarios for its "self-recovery."
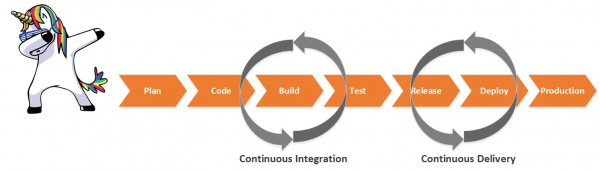
I work as an engineer in the IT service management department at My area of expertise is the implementation of various performance and availability monitoring systems. I frequently engage with IT clients from different market segments regarding current issues related to monitoring the quality of their IT services. The main goal is to minimize release cycle time and increase their frequency. This is all well and good: more releases — more new features — more satisfied users — more profits. But, in reality, things do not always turn out well. With very high deployment rates, the quality of our releases quickly comes into question. Even with a fully automated pipeline, one of the biggest problems is transitioning services from testing to production without affecting uptime and user interaction with the application.
From numerous conversations with clients, I can say that quality control of releases, application reliability issues, and the possibility of "self-recovery" (e.g., rolling back to a stable version) at various stages of the CI/CD pipeline are among the most pressing and relevant topics.
Recently, I worked on the client side — in the support service of an online bank's application. Our application's architecture utilized a large number of custom microservices. The saddest part is that not all developers were able to keep up with the rapid development pace, and the quality of some microservices suffered, leading to amusing nicknames for them and their creators. There were stories about the materials used to create these products.

Task Assignment
The high release frequency and large number of microservices make it difficult to understand the overall functioning of the application, both during the testing phase and in production. Changes are constantly occurring, and it is very challenging to monitor them without good monitoring tools. Often, after a night release, developers sit on a powder keg in the morning, waiting for things to break, even though all checks were successful during testing.
There's one more point. During the testing phase, the functionality of the software is checked: execution of the application's core functions and absence of errors. Quality assessments of performance are either lacking or do not consider all aspects of the application's operation and integration layer. Some metrics might not even be monitored. As a result, when a failure occurs in the production environment, the technical support department only learns about it when real users start to complain. We want to minimize the impact of poor-quality software on end users.
One solution is to implement quality assurance processes at various stages of the CI/CD Pipeline and to add various scenarios for system recovery in case of emergencies. We must also remember that we have DevOps. The business expects the fastest possible delivery of new products. Therefore, all our checks and scenarios must be automated.
The task can be divided into two parts:
- quality control of builds during the testing phase (automating the process of catching poor-quality builds);
- quality control of software in the production environment (mechanisms for automatic problem detection and possible scenarios for self-recovery).
Monitoring and metrics collection tool
To achieve the outlined goals, a monitoring system is required that can detect issues and relay them to automation systems at various stages of the CI/CD pipeline. It would also be beneficial if this system provides useful metrics for various teams: development, testing, and operations. And it would be absolutely fantastic if it also served the business.
To collect metrics, you can use a combination of various systems (Prometheus, ELK Stack, Zabbix, etc.), but in my opinion, APM class solutions are best suited for these tasks (), which can significantly simplify your life.
During my work in the support service, I started a similar project using the APM solution from Dynatrace. Now, working as an integrator, I have a good understanding of the monitoring systems market. My subjective opinion is that Dynatrace is best suited for such tasks.
The Dynatrace solution provides a horizontal view of each user operation with a deep level of detail down to the code execution level. You can trace the entire interaction sequence between various information services: from the frontend levels of web and mobile applications, backend application servers, integration buses to a specific database call.
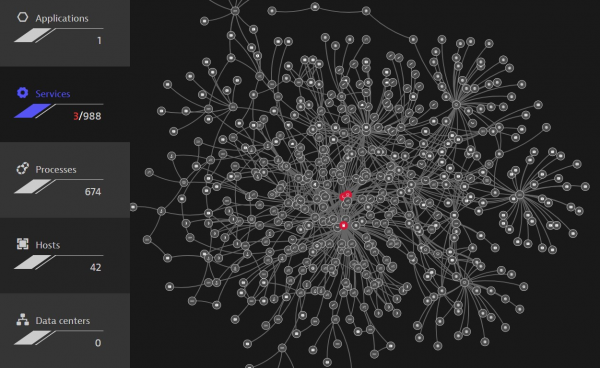 . Automatic construction of all dependencies between system components
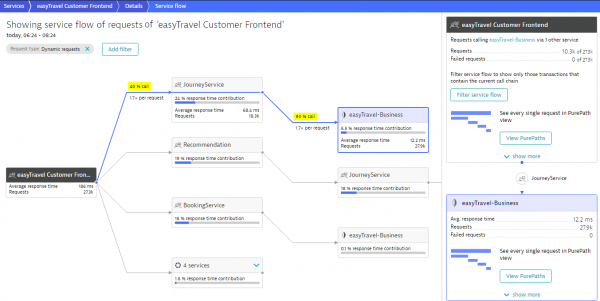 . Automatic detection and building of the service operation flow
We also need to integrate with various automation tools. Here, the solution has a convenient API that allows sending and receiving various metrics and events.
Next, we will take a closer look at how to tackle the tasks using the Dynatrace system.
Task 1. Automating quality control of builds at the testing stage
The first task is to identify problems as early as possible in the application delivery pipeline. Only 'good' code builds should reach the production environment. To achieve this, additional monitors for assessing the quality of your services should be included in your pipeline at the testing stage.
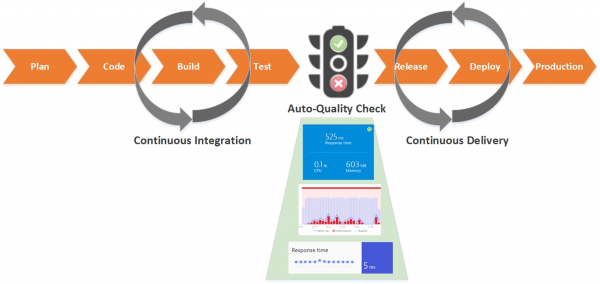
Let's examine step by step how to implement and automate this process:
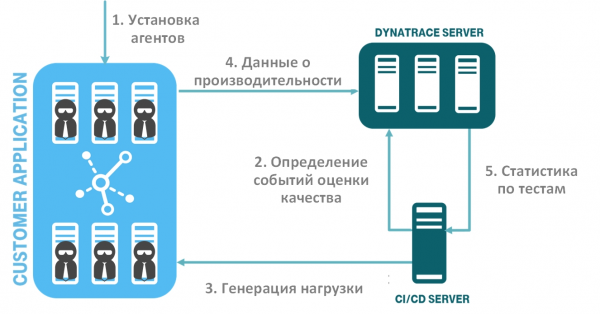
The diagram shows the flow of automated steps for software quality checks:
- deployment of the monitoring system (installation of agents);
- defining quality assessment events for your software (metrics and thresholds) and sending them to the monitoring system;
- generating load and performance tests;
- gathering performance and availability data in the monitoring system;
- data transfer of event-based software quality assessment tests from the monitoring system to the CI/CD system. Automatic analysis of builds.
Step 1. Deploying the monitoring system
First, you need to install agents in your testing environment. Dynatrace has a nice feature – it uses a universal OneAgent that installs on the OS instance (Windows, Linux, AIX), automatically detects your services, and starts collecting monitoring data for them. You do not need to separately configure an agent for each process. The same applies to cloud and container platforms. You can also automate the agent installation process. Dynatrace fits perfectly into the 'infrastructure as code' concept: there are ready-made scripts and instructions for all popular platforms. You embed the agent in your service configuration, and upon its deployment, you immediately get a new service with a working agent.
Step 2. Defining the quality assessment events of your software
Now you need to define the list of services and business operations. It is important to consider those user operations that are business-critical for your service. I recommend consulting with business and system analysts.
Next, you need to determine which metrics you want to include in the checks for each level. For example, these could be execution time (broken down into average, median, percentiles, etc.), errors (logical, service, infrastructure, etc.), and various infrastructure metrics (memory heap, garbage collector, thread count, etc.).
To automate and facilitate the use for the DevOps team, the concept of 'Monitoring as Code' emerges. What I mean by this is that a developer/tester can write a simple JSON file that defines the quality assessment metrics.
Let's take a look at an example of such a JSON file. Key/value pairs are used from the Dynatrace API objects (you can find the API description here ).
{
   "timeseries": [
   {
     "timeseriesId": "service.ResponseTime",
     "aggregation": "avg",
     "tags": "Frontend",
     "severe": 250000,
     "warning": 1000000
   },
   {
     "timeseriesId": "service.ResponseTime ",
     "aggregation": "avg",
     "tags": "Backend",
     "severe": 4000000,
     "warning": 8000000
   },
   {
     "timeseriesId": "docker.Container.Cpu",
     "aggregation": "avg",
     "severe": 50,
     "warning": 70
   }
  ]
}
The file is an array of timeseries definitions:
- timeseriesId – the metric being checked, such as Response Time, Error count, Memory used, etc.;
- aggregation — the level of metric aggregation, in our case avg, but you can use any necessary level (avg, min, max, sum, count, percentile);
- tags – the object tag in the monitoring system, or a specific object identifier can be specified;
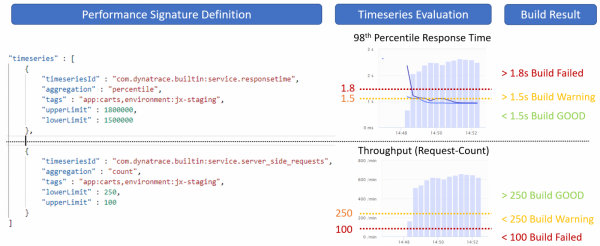
- severe and warning – these indicators regulate the threshold values of our metrics; if the test values exceed the severe threshold, our build is marked as unsuccessful.
The next illustration shows an example of using such thresholds.
Step 3. Load Generation
After we have defined the quality levels of our service, it is necessary to generate test load. You can use any testing tools that are convenient for you, such as Jmeter, Selenium, Neotys, Gatling, etc.
The Dynatrace monitoring system allows you to capture various metadata from your tests and recognize which test belongs to which release cycle and which service. It is recommended to add additional headers in the test's HTTP requests.
The next illustration shows an example where we mark that this test relates to the operation of adding a product to the cart using the additional header X-Dynatrace-Test.
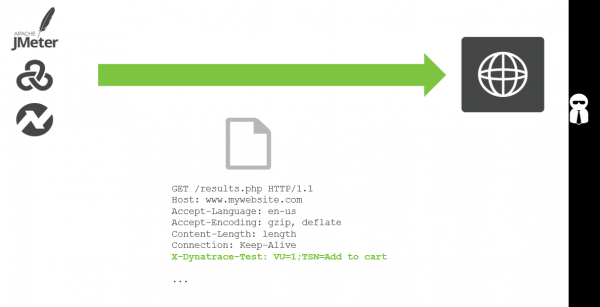
When launching each load test, you send additional contextual information to Dynatrace using the event API from the CI/CD server. This way, the system can distinguish between different tests.
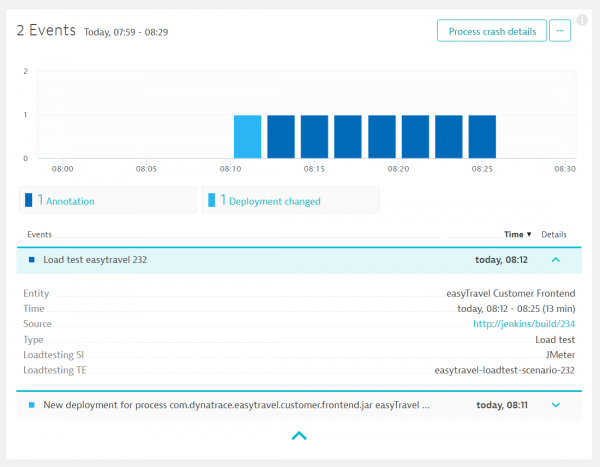 . An event in the monitoring system about starting load testing.
Step 4-5. Collecting performance data and sending data to the CI/CD system.
Along with the generated test, an event is sent to the monitoring system to collect data on service quality metrics. Our JSON file, which defines key metrics, is also specified.
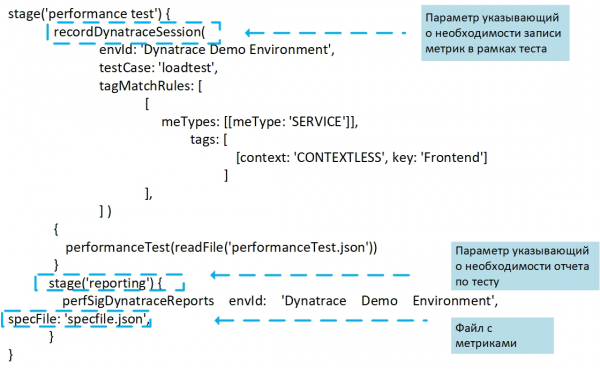 An event indicating the need for software quality verification generated on the CI/CD server for submission to the monitoring system.
In our example, the quality verification event is called perfSigDynatraceReport (Performance_Signature) – is a ready-made for integration with Jenkins, developed by the team at T-Systems Multimedia Solutions. Each launch verification event contains information about the service, build number, and testing time. The plugin collects performance metrics during the build, evaluates them, and compares the results with previous builds and non-functional requirements.
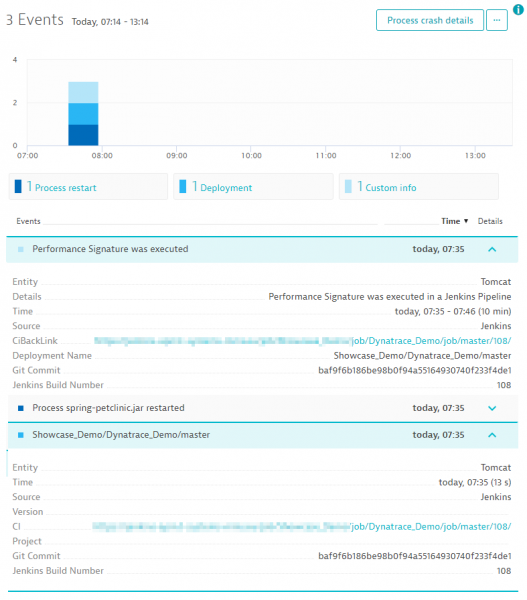 An event in the monitoring system indicating the start of the build quality verification.
After the test is completed, all the software quality assessment metrics are sent back to the continuous integration system, for example, Jenkins, which generates a report on the results.
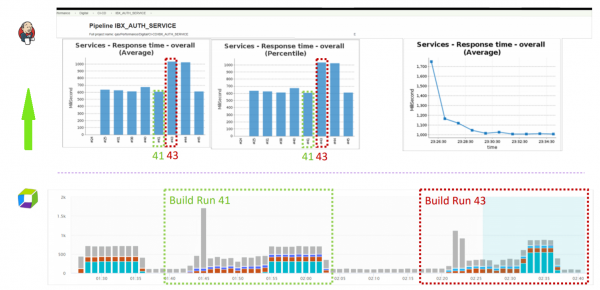 Build statistics result on the CI/CD server.
For each individual build, we see statistics for each metric we set over the course of the entire test. We also see if there were violations of specific threshold values (warning and severe thresholds). Based on the aggregate indicators, the entire build is marked as stable, unstable, or failed. For convenience, you can also add to the report the comparison metrics of the current build with the previous one.
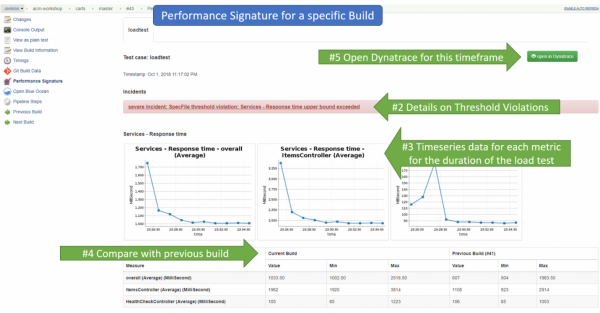 View detailed statistics on builds on the CI/CD server.
Detailed comparison of two builds.
If necessary, you can switch to the Dynatrace interface and view detailed statistics for each of your builds and compare them.
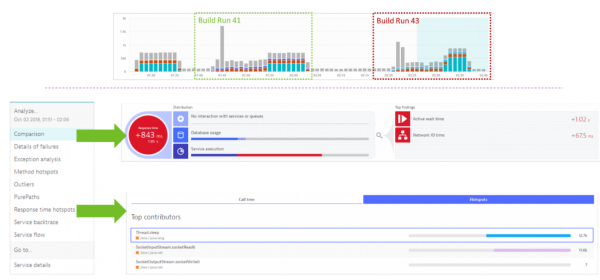 Comparison of build statistics in Dynatrace.
Conclusions
As a result, we get a service called 'monitoring as a service,' automated in the continuous integration pipeline. The developer or tester only needs to define the list of metrics in a JSON file, and everything else happens automatically. We achieve transparent quality control of releases: all notifications regarding performance, resource consumption, or architectural regressions.
Task 2. Automation of software quality control in production.
Thus, we have solved the task of how to automate the monitoring process during the testing phase in the Pipeline. This way, we minimize the percentage of poor-quality builds reaching production.
But what to do if bad software still reaches production, or something simply breaks? For an ideal situation, we would like automatic problem detection mechanisms to be in place and, if possible, for the system to restore its functionality by itself, at least at night.
For this, we need to provide for automatic quality checks of the software in the production environment, similar to the previous section, and include scenarios for self-restoration of the system.
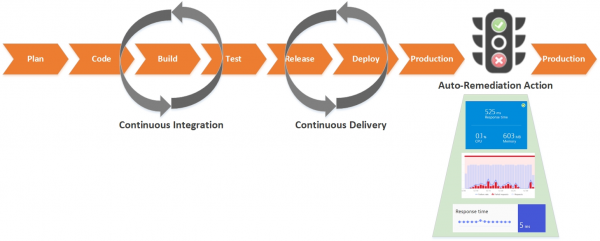
Autocorrection as Code
Most companies already have a knowledge base of various types of common problems and a list of actions to fix them, such as restarting processes, clearing resources, rolling back versions, restoring incorrect configuration changes, increasing or decreasing the number of components in a cluster, switching between blue or green stacks, etc.
Despite the fact that these use cases have been known for many years to many teams I communicate with, only a few have considered and invested in their automation.
If we think about it, there is nothing particularly complex in implementing self-restoration processes for application performance; it is necessary to represent the well-known workflows of your admins as code scenarios (the concept of 'autocorrection as code') that you have already written for each specific case. The automatic correction scenarios should aim to eliminate the root cause of the problem. You determine the proper response actions for incidents.
Any metric from your monitoring system can serve as a trigger for launching a scenario, provided that these metrics accurately determine that something is wrong, as we wouldn't want false positives in a production environment.
You can use any system or combination of systems: Prometheus, ELK Stack, Zabbix, etc. But I will give a few examples based on the APM solution (again, using Dynatrace as an example), which will also help make your life easier.
First of all, it includes everything related to performance from the application's perspective. The solution provides hundreds of metrics at various levels that you can use as triggers:
- user level (browsers, mobile apps, IoT devices, user behavior, conversion, etc.);
- service and operations level (performance, availability, errors, etc.);
- application infrastructure level (host OS metrics, JMX, MQ, web server, etc.);
- platform level (virtualization, cloud, container, etc.).
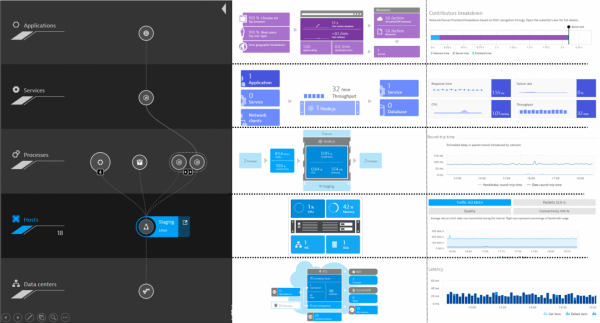 Monitoring levels in Dynatrace.
Secondly, as I mentioned earlier, Dynatrace has an open API that allows for convenient integration with various third-party systems. For example, sending a notification to the automation system when control parameters are exceeded.
Below is an example for interaction with Ansible.
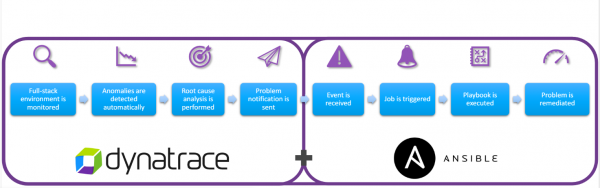
Next, I will provide several examples of what kind of automations can be implemented. This is just a part of the use cases; the list in your environment may be limited only by your imagination and the capabilities of your monitoring tools.
1. Bad deploy – rollback version
Even if we check everything very thoroughly in the test environment, there is still a chance that a new release may disrupt your application in the production environment. The human factor cannot be dismissed.
In the next illustration, we see a sharp spike in operation execution time on the service. The start of this spike coincides with the deployment time to the application. We pass all this information as events to the automation system. If the service’s functionality does not normalize after the time we set, a script that rolls back the version to the old one is automatically invoked.
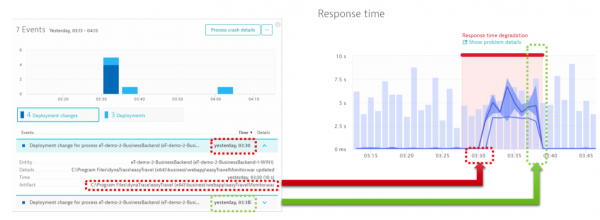 Performance degradation of operations after deployment.
2. Resource load at 100% — add a node to routing
In the next example, the monitoring system detects that one of the components is experiencing 100% CPU load.
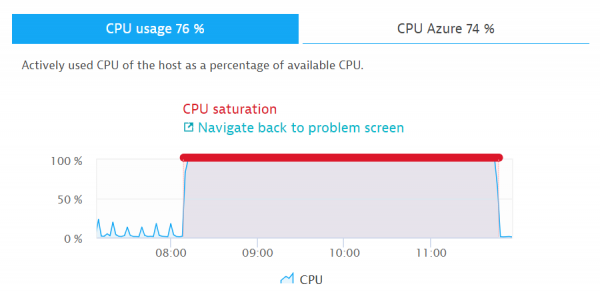 CPU Load 100%
There are several different scenarios possible for this event. For instance, the monitoring system checks whether the resource shortage is related to an increase in service load. If so, a script is executed that automatically adds a node to the routing, thereby restoring the functionality of the system as a whole.
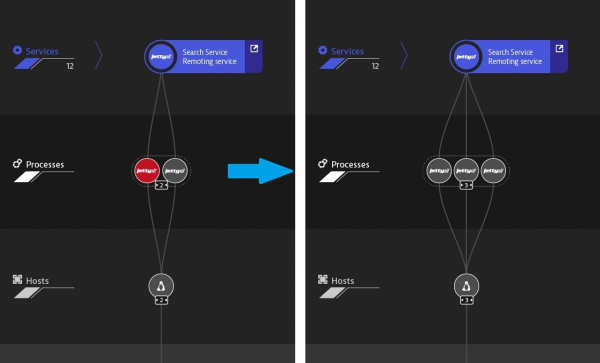 Scaling after an incident
3. No space on the hard drive – disk cleanup
I believe that these processes are already automated for many. With APM, it's also possible to monitor free space on the disk subsystem. If there is no space or the disk is running slowly, we can call a cleanup script or add more space.
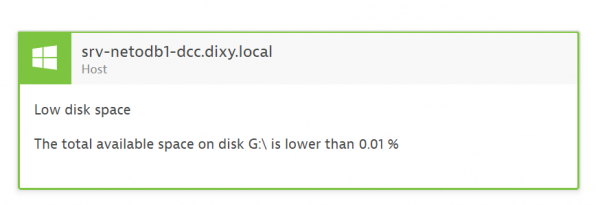
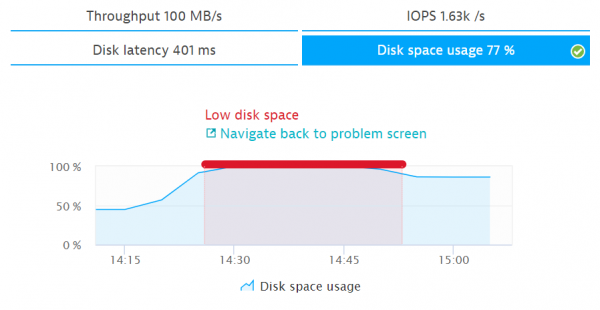 Disk usage at 100%
4. Low user activity or low conversion – switching between the blue and green branches
I often encounter clients using two environments (blue-green deploy) for applications in production. This allows for quick switching between branches during the delivery of new releases. Often, after deployment, significant changes may occur that aren't immediately noticeable. In this case, performance and availability degradation might not be observed. To respond quickly to such changes, it's better to use various metrics reflecting user behavior (number of sessions and user actions, conversion, bounce rate). The next diagram shows an example where the switch between software branches occurs due to a drop in conversion.
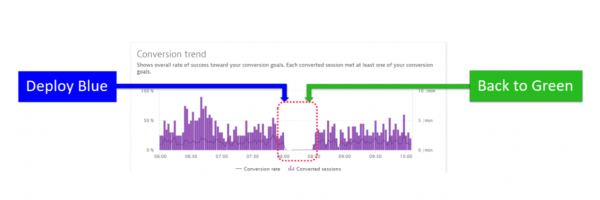 Drop in conversion after switching between software branches.
Automated issue detection mechanisms
In the end, I will provide another example of why I like Dynatrace the most.
In part of my story about automating quality checks in the testing environment, all threshold values were determined manually. This is normal for a testing environment, as the tester sets the indicators before each check depending on the load. In a production environment, it's preferable for problems to be automatically detected considering various baseline mechanisms.
Dynatrace has interesting built-in artificial intelligence tools that, based on mechanisms for detecting anomalous metrics (baselining) and mapping interactions between all components, correlate events together and identify anomalies in your service's performance, providing detailed information on each issue and root cause.
By automatically analyzing dependencies between components, Dynatrace determines not only whether the problematic service is the root cause but also its dependency on other services. In the example below, Dynatrace automatically tracks and evaluates the performance of each service during transaction execution, identifying the Golang service as the main cause.
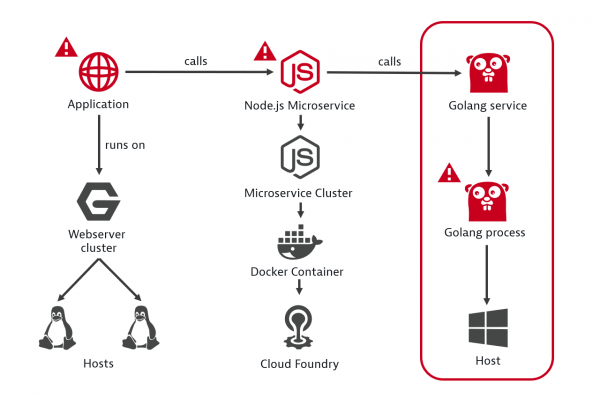 Example of root cause analysis of a failure.
The following illustration shows the process of monitoring issues with your application from the start of an incident.
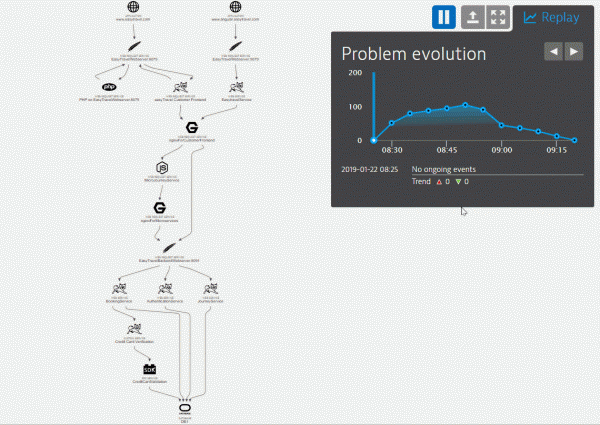 Visualization of the emerging issue, displaying all components and events related to them.
The monitoring system has compiled a complete timeline of events related to the issue. In the window below the timeline, we can see all key events for each of the components. Based on these events, you can establish procedures for automatic corrections in the form of code scripts.
Additionally, I recommend integrating the monitoring system with a Service Desk or bug tracker. When a problem arises, developers quickly receive all the information needed for analysis at the code level in the production environment.
Conclusion
As a result, we have created a CI/CD pipeline with built-in automated software quality checks in the pipeline. We minimize the number of low-quality builds, enhance the overall reliability of the system, and if the system's functionality is disrupted, we trigger recovery mechanisms.
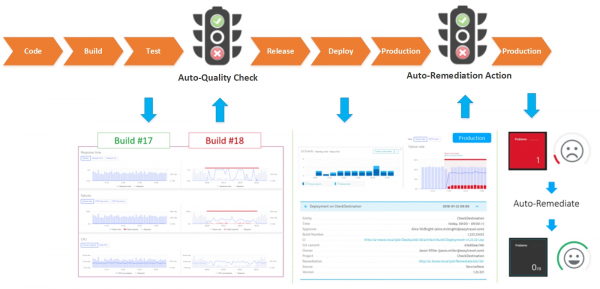
Investing efforts into automating software quality monitoring is definitely worthwhile; it may not always be a quick process but will pay off in time. I recommend considering what monitors to add for testing in the test environment immediately after resolving a new incident in production to avoid introducing a bad build into production, as well as drafting a script for automatically fixing these issues.
I hope my examples will help you in your endeavors. I would also be interested to see your examples of metrics used for implementing self-healing of system functionality.

Source: habr.com
