


Over my career in IT, I’ve had the opportunity to make dozens of presentations for colleagues, clients, and public speaking engagements. For many years, PowerPoint was my natural and reliable choice for creating slides. However, this year has brought a significant change. From February to May, I spoke at five conferences where I had to prepare slides quickly and effectively. The question of delegating the visual design of the slides to others became necessary. At one point, I tried working with a designer by emailing .pptx files back and forth, but it turned into chaos: no one knew which version of the slides was the 'latest,' and formatting issues arose due to different versions of PowerPoint and fonts on our machines. I decided to try something new, and since then, I haven’t thought about going back to PowerPoint.
What We Want
About a year and a half ago, our company stopped using Word for creating project documentation, encountering similar issues: while Word is good for typing a small document, difficulties with collaboration and achieving quality, standardized formatting arise as the volume grows. We opted for , and we continue to be pleased with that choice; however, that's a topic for another article. Around the same time, we discovered the effectiveness of one of the DevOps principles, 'everything as code,' making the choice of requirements for the new technology to create presentation slides quite obvious:
- A presentation should be a plain text file in a markup language.
- Our slides are about development projects, so the markup should allow for easy inclusion of
- code snippets with syntax highlighting,
- simple diagrams made of geometric shapes connected by arrows,
- UML diagrams, flowcharts, and more.
- The project presentation should be stored in a version control system.
- Validation and assembly of the final slides should be conducted in a CI system.
Currently, there are two basic options for creating slides in markup languages: the package for LaTeX or one of the frameworks for creating slides in HTML/CSS (, , and many others).
While my heart lies with LaTeX, my mind suggested that the choice of a solution that I wouldn't be the only one using should lean towards a familiar solution for a broader audience. Not everyone knows LaTeX, and if your daily practice isn’t related to writing scientific articles, you likely won’t have the time to delve into the vast and intricate world of this system.
However, proficiency in HTML/CSS is not exactly a widespread skill: I, for one, do not have full mastery of it. Fortunately, the familiar AsciiDoctor comes to the rescue: a converter allows you to create RevealJS slides using AsciiDoctor markup. And that markup is easy to learn and accessible to everyone!
How to Code Slides
To understand the essence of coding slides in AsciiDoctor, it’s simplest to provide concrete examples. All of them are from real slides that I made for my conference presentations this year.
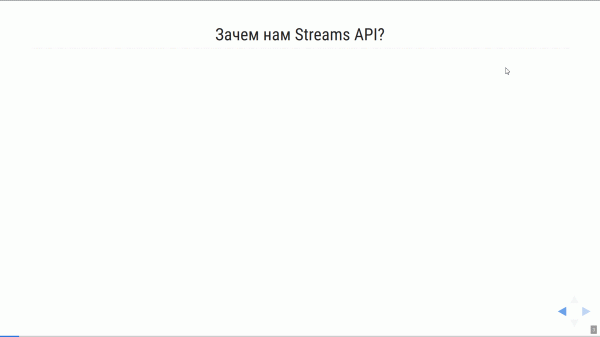
A slide with a title and a list where items appear one after another:
== Why Do We Need the Streams API?

[%step]
* Real-time stream processing
* Stream-like API (map / reduce)
* Under the hood:
** Automatic offset commit
** Rebalancing
** Internal state of processors
** Easy scaling
Result
A title and a fragment of source code with syntax highlighting:
== Kafka Streams API: General Structure of a KStreams Application

[source,java]
----
StreamsConfig config = ...;
// Here we set various options

Topology topology = new StreamsBuilder()
// Here we build the topology
....build();
----
Result
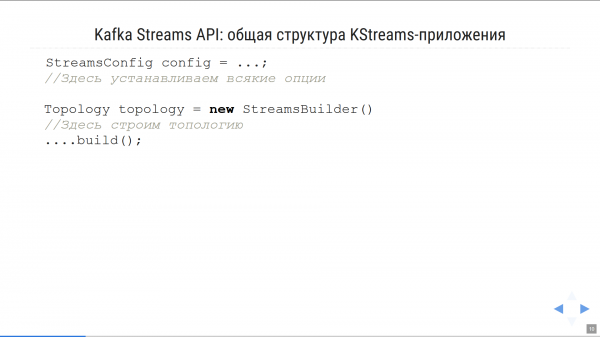
During the preparation for the presentation, demonstration code examples undergo multiple revisions and improvements, making the ability to quickly copy and paste "raw code" directly into the slide invaluable, ensuring the demo example is up-to-date without worrying about syntax highlighting.
A title, illustration, and text (we arrange the layout across the slide in cells ):
== Kafka Streams in Action

[.custom-style]
[cols="30a,70a"]
|===
|image::KSIA.jpg[]
|
* **William Bejeck**, +
"Kafka Streams in Action", November 2018
* Code examples for Kafka 1.0
|===
Result

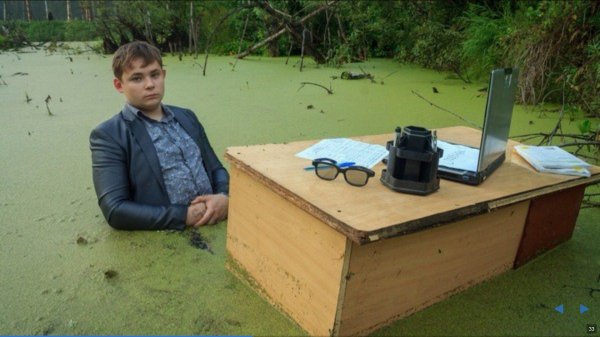
Sometimes a title isn’t necessary, and all you need to illustrate your thought is a full-screen image:
[%notitle]
== Living in Legacy is Tough

image::swampman.jpg[canvas, size=cover]
Result
Often, it’s essential to support a thought with a simple diagram, in the form of "boxes connected by arrows". Fortunately, AsciiDoctor is integrated with the — a language that allows describing graphical diagrams based on the description of nodes and the relationships between them. Learning Graphviz is worthwhile, but it’s quite easy to do based on the existing examples! Here’s what it looks like:
== Writing the 'Bet Totalling App'

What is the total payout for the bets placed if the outcome plays out?

[graphviz, "counting-topology.png"]
-----
digraph G {
graph [ dpi = 150 ];
rankdir="LR";
node [fontsize=18; shape="circle"; fixedsize="true"; width="1.1"];
Store [shape="cylinder"; label="Local Store"; fixedsize="true"; width="1.5"]
Source -> MapVal -> Sum -> Sink
Sum -> Store [dir=both; label=" n "]
{rank = same; Store; Sum;}
}
-----
Result
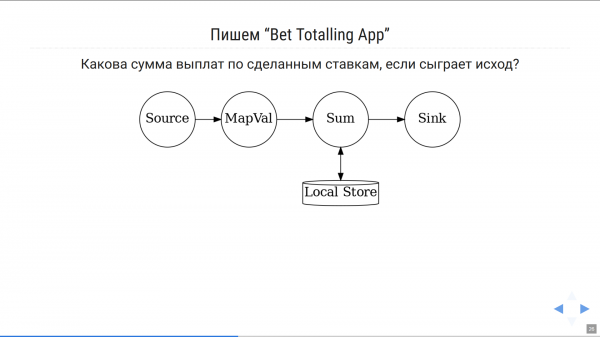
In cases where you need to edit the label on a shape, change the direction of an arrow, etc., this can be done directly in the presentation code instead of redrawing an image and reinserting it into the slide. This significantly increases the speed of working on the slides.
A slightly more complex example:
== Non-reproducible assembly
[graphviz, "unstable-update.png"]
-----
digraph G {
  rankdir="LR";
  graph [ dpi = 150 ];
  u -> r0;
  u[shape=plaintext; label="linter update\n 13 warnings"]
  r0[shape=point, width = 0]
  r1 -> r0[ arrowhead = none, label="master branch" ];
  r0-> r2 [];   b1 -> b4;  r1->b1
  r1[label="150 warnings"]
  b1[label="± 0 warnings"]
  b4[label="± 0 warnings"]
  b4->r2
  r2[label="163 warnings", color="red", xlabel=<merge blocked>]
  {rank = same; u; r0; b4;}
}
-----
Result
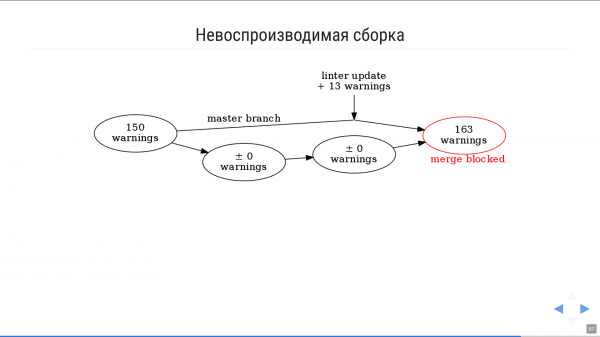
By the way, experimenting with Graphviz and debugging images is convenient on the page .
Finally, if you need to insert a flowchart, class diagram, or any other standardized diagram into a slide, another integrated system that works with AsciiDoctor may come in handy, . My colleague Nikolay Potashnikov wrote about the extensive capabilities of PlantUML in .
Turning the presentation project into code stored in a version control system allows organizing collaborative work on the presentation, primarily dividing the tasks of creating content and formatting. The design of slides (fonts, backgrounds, indents) in RevealJS is described using CSS. My personal ability to manage CSS is best conveyed by — but it's not scary when there are people who work with CSS much more skillfully and faster than I do. As a result, in the context of a rapidly approaching presentation deadline, we can work simultaneously on different files via Git and enhance collaborative speed, which would be impossible when sending .pptx files via email.
Assembling an HTML page with slides
Plain text sources are great, but how do you compile them into the actual presentation?
AsciiDoctor is a project written in Ruby and can be run in several ways. First, you can install Ruby and run asciidoctor directly, which might be the closest approach for Ruby developers.
If you prefer not to deal with Ruby installation, you can use the docker image , which allows you to mount a folder with the project's sources via VOLUME during startup and get the output in the specified location.
The option I settled on may seem a bit unexpected, but it’s the most convenient for me as a Java developer. It requires neither Ruby installation nor docker, yet allows for generating slides using a Maven script.
The thing is, the project — the Java implementation of Ruby — is so good that it allows running almost everything created for Ruby within the Java machine, and launching AsciiDoctor is one of the most common uses of JRuby.
The presence of allows compiling AsciiDoctor documentation as part of a Java project (which we actively use). AsciiDoctor and JRuby are automatically downloaded by Maven, and AsciiDoctor runs in the JRuby environment: there’s nothing to install on your machine! (Except for the package graphviz, which is needed if you want to use GraphViz or PlantUML graphics.) Just place your .adoc files in the folder src/main/asciidoc/. Here’s , generating slides with diagrams.
Converting slides to PDF
Although the HTML version of the slides is quite self-sufficient, having a PDF version can also be necessary. First, it happens that some conferences, which do not provide the speaker the opportunity to connect their own laptop, require slides ‘strictly in pptx or pdf format’, without expecting them to be in HTML. Second, it’s good practice to send the organizers an unalterable version of your slides as they were displayed during the presentation, in PDF format for inclusion in the conference materials.
Fortunately, this task is handled by the Node.js utility , built on top of — a browser automation system for Chrome. You can convert a RevealJS presentation to PDF with the command
node decktape.js -s 3200x1800 --slides 1-500
  reveal "file:///index.html?fragments=true" slides.pdf
Two tricks when running decktape that I arrived at through trial and error:
permission via parameter
-sshould be set with a twofold margin; otherwise, conversion results may have issuesthe URL of the HTML version of the presentation needs to pass the parameter
?fragments=true, which will allow creating a separate PDF page for each intermediate state of your slide (for example, five pages for five list items if they are shown one after another). This will allow using such a PDF on its own as a presentation during the talk.
Automatic assembly and web publication
It's convenient when slides are automatically assembled upon changes in the version control system, and even more convenient when automatically compiled slides are uploaded to the internet for public use. Slide presentations from the internet can be easily 'played' in front of an audience from any machine connected to the internet and a projector.
Since we use GitHub for our work, the natural choice of CI system is , and for hosting ready presentations — . The idea of github.io is that any static content placed in the gh-pages branch of your GitHub project becomes accessible at the address .github.io/.
The full configuration file for TravisCI, including the compilation of the HTML version of the page using Maven, converting to PDF with decktape, and uploading the results to the branch gh-pages for publication on github.io, looks .
To build such a project on the TravisCI side, it is necessary to configure the environment variables
GH_REF— value in the form of github.com/inponomarev/csa-hbGH_TOKEN— access token for GitHub. It can be obtained in GitHub in your profile settings, Developer Settings -> Personal Access Tokens. If you are publishing a presentation in a public repository, it's enough to grant this token just the 'Access public repositories' permission.GH_USER_EMAIL/GH_USER_NAME— a pair of name/email under which the push to the branch will be madegh-pages.
Thus, every commit of the presentation code on GitHub leads to the automatic reconstruction of slides in HTML and PDF formats and their re-upload to github.io. (Of course, you should only publish those presentations on github.io that you want to make public in the end.)
Examples of projects
Lastly, here are links to a couple of example presentation projects with configured Maven scripts and CI configuration for Travis-CI that you can clone and use when creating your own presentation projects:
(my talk for JPoint 2019)
(my talk for Heisenbug 2019)
Goodbye, PowerPoint! I don't think I'll ever need you for technical presentations 🙂
Source: habr.com
