

Red Hat Satellite is a system management solution that simplifies the deployment, scaling, and management of Red Hat infrastructure in physical, virtual, and cloud environments. Satellite enables users to configure and update systems to ensure their effective and secure operation according to various standards. By automating most tasks related to system maintenance, Satellite helps organizations enhance efficiency, reduce operational costs, and respond more readily to strategic business requests.

While you can perform basic administrative tasks with the Red Hat services included in the Red Hat Enterprise Linux subscription, Red Hat Satellite adds extensive capabilities to manage the entire lifecycle.
Some of these capabilities include:
- Patch management;
- Subscription management;
- Initialization;
- Configuration management.
From a single console, you can manage thousands of systems as easily as one, which increases availability, reliability, and provides auditing capabilities.
And now we have the new Red Hat Satellite 6.5!
One of the cool things introduced in Red Hat Satellite 6.5 is the new reporting engine.
Satellite Server often serves as the hub where all information about corporate Red Hat systems converges, and this new engine allows for creating and exporting reports containing information about Satellite client hosts, software subscriptions, applicable errata, and more. Reports are programmed in the built-in Ruby language (ERB).
Satellite 6.5 comes with ready-made reports, and the engine gives users the ability to customize these reports or create their own. Built-in reports from Satellite 6.5 are generated in CSV format, but in this post, we will show how to create reports in HTML format as well.
Built-in Reports of Satellite 6.5
Satellite 6.5 includes four built-in reports:
- Applicable errata – a list of software defects (errata) that need to be addressed on content hosts (optionally filtered by hosts or defects);
- Host statuses – a report on the status of Satellite hosts (optionally filtered by hosts);
- Registered hosts – Information about Satellite hosts: IP address, OS version, software subscriptions (optionally filtered by hosts);
- Subscriptions – Information about software subscriptions: total number of subscriptions, number of free ones, SKU codes (optionally filtered by subscription parameters).
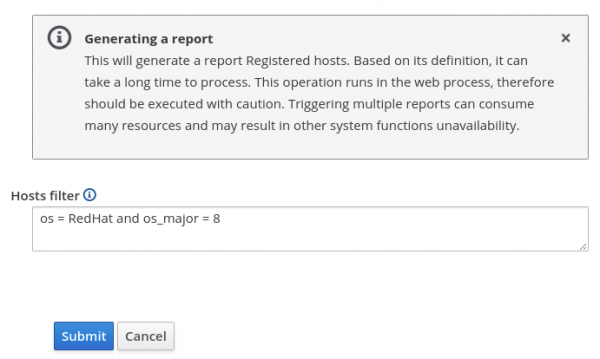
To generate a report, open the menu Monitor, select Report Templates and click the Generate button to the right of the report you need. Leave the filter field empty to include all data in the report, or enter something to limit the results. For example, if the report for Registered Hosts should display only RHEL 8 hosts, specify the filter os = RedHat and os_major = 8, as shown in the screenshot below:
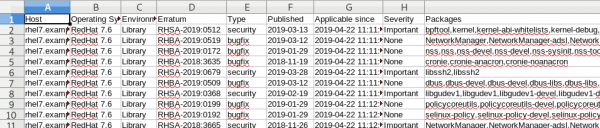
After generating the report, it can be downloaded and opened in a spreadsheet program like LibreOffice Calc, which imports data from CSV and distributes it into columns, for example, as shown in the screenshot below: Applicable errata Notice that the properties of built-in reports have the option enabled
(Default), so they are automatically added to all new organizations and locations you create in Satellite. the net/http Customization of built-in reports
Let's discuss customization using the example of a built-in report.
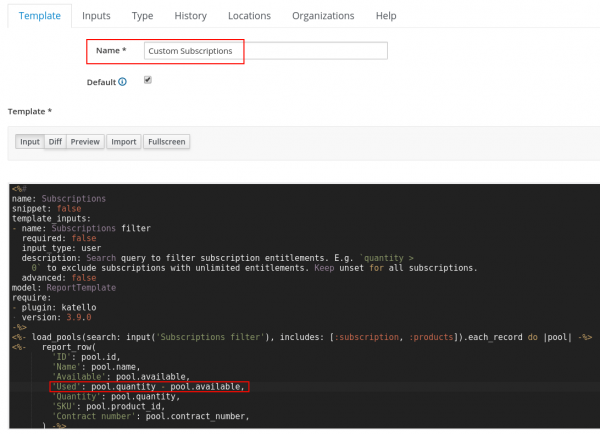
By default, this report reflects the total number of subscriptions (1), as well as the number available, that is, free subscriptions (2). We will add a column for the number of used subscriptions, which is defined as (1) - (2). For example, if we have a total of 50 RHEL subscriptions and 10 of them are free, then 40 subscriptions are used. SubscriptionsSince editing built-in reports is blocked and modifying them is not recommended, you will need to clone the built-in report, give it a new name, and then modify this cloned copy.
So, if we want to modify the report
, we first need to clone it. Therefore, open the menu Subscriptions, select Monitorand in the dropdown menu to the right of the template Report Templates choose Subscriptions Clone . Then enter the name of the cloned report (let's call itCustom Subscriptions ) and between the linesQuantity Available and add the line ‘Used’: pool.quantity — pool.available, – note the comma at the end of the line. Here's how it looks in the screenshot: Then click the button
Submit , which takes us back to the page. There, click the button Report TemplatesGenerate to the right of the report just created . Leave the Subscriptions filter field empty and click ) and between the linesWe leave the Subscriptions filter field empty and click. , which takes us back to the pageAfter that, a report is created and uploaded, including the column we added. Used.

The help for the built-in Ruby language can be found in the tab. Help in the report editing window. It contains an overview of syntax, as well as available variables and methods.
Creating Your Own Report
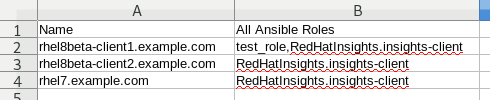
Now let's look at creating custom reports using the example of a report on Ansible roles assigned to hosts in Satellite. Open the menu Monitor, click Report Templates and then press the button Create Template. We will name our report Ansible Roles Report and insert the following ERB code:
This code generates a report on hosts, displaying the 'all_ansible_roles' attribute for them.
Then go to the tab Inputs and click the button + Add Input. We state that name equals hosts, and the description type is Filter by hosts (optional). Then click , which takes us back to the page and then press the button to the right of the report just created next to the recently created report. You can set a host filter, or press , which takes us back to the page, to generate a report on all hosts. The generated report will look something like this in LibreOffice Calc:
Creating HTML Reports
The Satellite report engine allows for generating reports not only in CSV format. For example, we will create our own report based on the built-in report Host Statuses, but only as an HTML table with cell color-coding based on status. To do this, we clone Host Statuses, and then replace its ERB code with the following:
<!DOCTYPE html>
<html>
<head>
   <title>Host Statuses</title>
   <style>
       th {
           background-color: black;
           color: white;
       }
       td.green {
           background-color:#92d400;
           color:black;
       }
       td.yellow {
           background-color:#f0ab00;
           color:black;
       }
       td.red {
           background-color:#CC0000;
           color:black;
       }
       table,th,td {
               border-collapse:collapse;
               border: 1px solid black;
       }
   </style>
</head>
<body>
<table>
<tr>
       <th> Hostname </th>
       <th> Status </th>
<% load_hosts(search: input('hosts'), includes: :host_statuses).each_record do |host| -%>
   <% all_host_statuses_hash(host).each do |key, value|  -%>
       <th> <%= key %> </th>
   <% end -%>
   <% break -%>
<% end -%>
</tr>

<%- load_hosts(search: input('hosts'), includes: :host_statuses).each_record do |host| -%>
   <tr>
   <td> <%= host.name   %> </td>
   <% if host.global_status == 0 -%>
       <td class="green"> OK </td>
   <% elsif host.global_status == 1 -%>
       <td class="yellow"> Warning </td>
   <% else -%>
       <td class="red"> Error (<%= host.global_status %>) </td>
   <% end -%>

   <% all_host_statuses_hash(host).each do |key, value|  -%>
       <% if value == 0 -%>
           <td class="green"> OK </td>
       <% elsif value == 1  -%>
           <td class="yellow"> Warning </td>
       <% else -%>
           <td class="red"> Error (<%= value %>) </td>
       <% end -%>
   <% end -%>
   </tr>
<% end -%>

</table>
</body>
</html>
This report generates HTML which will look approximately like this in the browser:

Running Reports from the Command Line
To run a report from the command line, the command used is hammer, and the cron utility allows automating this process.
Use the command hammer report-template generate —name «», for example:
# hammer report-template generate —name "Host statuses HTML"
The report content will be reflected on the console. The information can be redirected to a file, after which cron can be set up to run a shell script for generating the report and sending it via email. The HTML format displays perfectly in email clients, allowing for regular delivery of reports to interested parties in an easily digestible form.
Thus, the reporting engine in Satellite 6.5 is a powerful tool for exporting critical data held by companies in Satellite. It is highly flexible and allows the use of both built-in reports and their modified versions. Additionally, users can create their own reports from scratch. Details about the Satellite Reporting Engine are available in our video on YouTube.
Our speaker is Aram Kanанов, manager of the Platforms and Systems Management development department at Red Hat for Europe, the Middle East, and Africa. Aram's work at Red Hat includes comprehensive market, industry, and competitor analysis, as well as positioning and marketing of products for the platforms business unit, which encompasses managing the entire product lifecycle from implementation to end-of-life.
Source: habr.com
