


Linux has a wide range of tools for debugging the kernel and applications. Most of them negatively affect application performance and cannot be used in production.
A couple of years ago, — eBPF. It allows tracing the kernel and user applications with low overhead and without the need to rebuild programs or load third-party modules into the kernel.
There are now many application utilities that use eBPF, and in this article, we will explore how to write our own profiling utility based on the . The article is based on real events. We will trace the path from the emergence of the problem to its resolution, illustrating how existing utilities can be used in specific situations.
Ceph Is Slow
A new host was added to the Ceph cluster. After migrating part of the data to it, we noticed that the write request processing speed was much lower than on other servers.
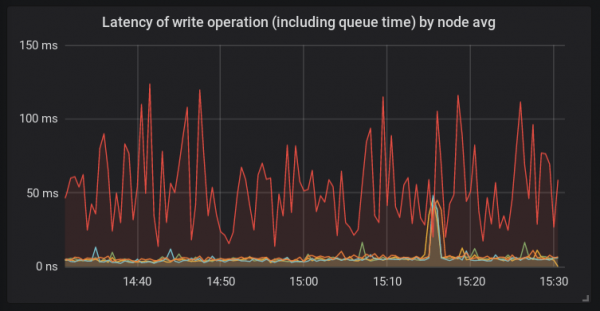
Unlike other platforms, this host utilized bcache and the new Linux kernel 4.15. This configuration was used here for the first time. At that moment, it was clear that the root of the problem could theoretically be anything.
Investigating the Host
Let's start by examining what happens inside the ceph-osd process. For this, we will use and (more details can be read ):
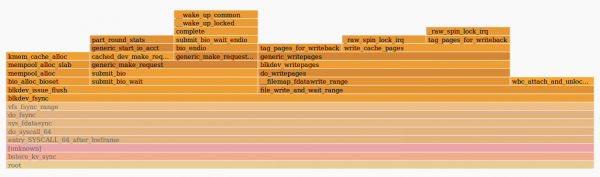
The image tells us that the function fdatasync() spent a lot of time sending a request in the function generic_make_request(). This means that the cause of the problems is probably outside the osd daemon itself. It could either be the kernel or the disks. The iostat output showed high latency in handling requests by the bcache disks.
Upon checking the host, we found that the systemd-udevd daemon was consuming a large amount of CPU time — about 20% on several cores. This strange behavior needs further investigation. Since systemd-udevd works with uevents, we decided to look at them using udevadm monitor. It turns out that a large number of change events were being generated for each block device in the system. This is quite unusual, so we need to see what generates all these events.
Using the BCC Toolkit
As we have already determined, the kernel (and ceph daemon in the system call) spends a lot of time in generic_make_request()Let's try to measure the speed of this function. In there is already a great tool — funclatency. We will trace the daemon by its PID with an interval of 1 second between outputs and display the results in milliseconds.
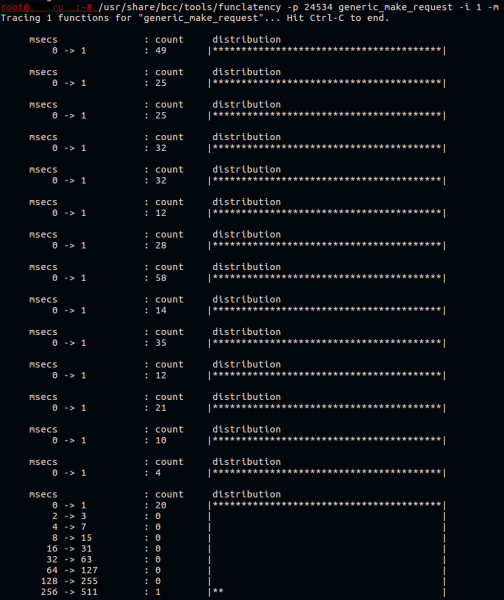
Usually, this function operates quickly. All it does is send the request to the device driver queue.
Bcache is a complex device that actually consists of three disks:
- the backing device (cacheable disk), which in this case is a slow HDD;
- the caching device (cache disk), here it is one partition of an NVMe device;
- a virtual bcache device, with which the application interacts.
We know that the request transmission is slowing down, but for which of these devices? We will sort this out a bit later.
Right now, we know that uevents are likely causing issues. Identifying what specifically triggers their generation is not so easy. Let's assume it's some software that runs periodically. We'll see what software is running in the system using the script execsnoop from the same We'll run it and direct the output to a file.
For example, like this:
/usr/share/bcc/tools/execsnoop | tee ./execdump
We won't provide the full execsnoop output here, but one line of interest looked like this:
sh 1764905 5802 0 sudo arcconf getconfig 1 AD | grep Temperature | awk -F '[:\/]' '{print $2}' | sed 's\/^ ([0-9]*) C.*\/1\/'
The third column is the PPID (parent PID) of the process. The process with PID 5802 turned out to be one of the threads of our monitoring system. When checking the configuration of the monitoring system, incorrectly set parameters were found. The temperature of the HBA adapter was being measured every 30 seconds, which is much more often than necessary. After changing the checking interval to a longer one, we found that the request processing delay on this host was no longer distinguished against other hosts.
But it's still unclear why the bcache device was slowing down so much. We prepared a test platform with an identical configuration and tried to reproduce the problem by running fio on bcache while periodically triggering udevadm to generate uevents.
Writing BCC-Based Tools
Let's try to write a simple utility to trace and output the slowest calls to the screen. generic_make_request()We are also interested in the name of the disk for which this function was invoked.
The plan is simple:
- Registering kprobe to generic_make_request():
- We'll store the name of the disk available through the function argument in memory;
- We’ll save a timestamp.
- Registering kretprobe on return from generic_make_request():
- Getting the current timestamp;
- Searching for the saved timestamp and comparing it with the current one;
- If the result exceeds the specified value, we find the saved disk name and output it to the terminal.
Kprobes and kretprobes use a breakpoint mechanism to modify function code on the fly. You can read and article on this topic. If you take a look at the code of various utilities in , you may notice that they have an identical structure. So in this article we will skip parsing the script arguments and move on to the BPF program itself.
The eBPF text inside the python script looks as follows:
bpf_text = ''' # Here will be the bpf program code '''
To exchange data between functions, eBPF programs use . We will do the same. We will use the PID of the process as the key and define the structure as the value:
struct data_t {
	u64 pid;
	u64 ts;
	char comm[TASK_COMM_LEN];
	u64 lat;
	char disk[DISK_NAME_LEN];
};

BPF_HASH(p, u64, struct data_t);
BPF_PERF_OUTPUT(events);
Here we register the hash table called p, with a key of type u64 and a value of type struct data_t. The table will be accessible in the context of our BPF program. The BPF_PERF_OUTPUT macro registers another table called events, which is used for to user space.
When measuring delays between function calls and returns, or between different function calls, it is important to remember that the collected data must belong to the same context. In other words, we need to keep in mind the possibility of parallel execution of functions. We have the ability to measure the delay between a function call in the context of one process and the return from that function in the context of another process, but this is likely to be useless. A good example here is the , where a pointer to struct request, which represents a single disk request, is used as the key for the hash table.
Next, we need to write the code that will be executed when the function we are investigating is called:
void start(struct pt_regs *ctx, struct bio *bio) {
	u64 pid = bpf_get_current_pid_tgid();
	struct data_t data = {};
	u64 ts = bpf_ktime_get_ns();
	data.pid = pid;
	data.ts = ts;
	bpf_probe_read_str(&data.disk, sizeof(data.disk), (void*)bio->bi_disk->disk_name);
	p.update(&pid, &data);
}
Here the second argument will be the first argument of the called function . After that, we get the process PID in the context we are working with, and the current timestamp in nanoseconds. We record this all in freshly allocated struct data_t data. We get the disk name from the structure bio, which is passed during the call generic_make_request(), and save it in the same structure data. The last step is to add an entry to the hash table mentioned earlier.
The next function will be called on return from generic_make_request():
void stop(struct pt_regs *ctx) {
    u64 pid = bpf_get_current_pid_tgid();
    u64 ts = bpf_ktime_get_ns();
    struct data_t* data = p.lookup(&pid);
    if (data != 0 && data->ts > 0) {
        bpf_get_current_comm(&data->comm, sizeof(data->comm));
        data->lat = (ts - data->ts) / 1000;
        if (data->lat > MIN_US) {
            FACTOR
            data->pid >>= 32;
            events.perf_submit(ctx, data, sizeof(struct data_t));
        }
        p.delete(&pid);
    }
}
This function is similar to the previous one: we find out the process PID and timestamp, but do not allocate memory for a new data structure. Instead, we look for an existing structure in the hash table using the key equal to the current PID. If the structure is found, we retrieve the name of the running process and add it to it.
The binary shift we use here is necessary to get the thread GID, i.e., the PID of the main process that started the thread in the context we are working with. The function we call returns both the thread GID and its PID in a single 64-bit value.
When outputting to the terminal, we are currently not interested in the thread but in the main process. After comparing the obtained latency with the specified threshold, we pass our structure data to user space through the table events, after which we delete the entry from p.
In the Python script that will load this code, we need to replace MIN_US and FACTOR with the latency thresholds and time units that we will pass through arguments:
bpf_text = bpf_text.replace('MIN_US', str(min_usec))
if args.milliseconds:
	bpf_text = bpf_text.replace('FACTOR', 'data->lat /= 1000;')
	label = "msec"
else:
	bpf_text = bpf_text.replace('FACTOR', '')
	label = "usec"
Now we need to prepare the BPF program using and register the probes:
b = BPF(text=bpf_text)
b.attach_kprobe(event="generic_make_request", fn_name="start")
b.attach_kretprobe(event="generic_make_request", fn_name="stop")
We also have to define struct data_t in our script, otherwise, nothing will be readable:
TASK_COMM_LEN = 16	# linux/sched.h
DISK_NAME_LEN = 32	# linux/genhd.h
class Data(ct.Structure):
	_fields_ = [("pid", ct.c_ulonglong),
            	("ts", ct.c_ulonglong),
            	("comm", ct.c_char * TASK_COMM_LEN),
            	("lat", ct.c_ulonglong),
            	("disk", ct.c_char * DISK_NAME_LEN)]
The last step is to output the data to the terminal:
def print_event(cpu, data, size):
    global start
    event = ct.cast(data, ct.POINTER(Data)).contents
    if start == 0:
        start = event.ts
    time_s = (float(event.ts - start)) / 1000000000
    print("%-18.9f %-16s %-6d   %-1s %s   %s" % (time_s, event.comm, event.pid, event.lat, label, event.disk))

b["events"].open_perf_buffer(print_event)
# format output
start = 0
while 1:
    try:
        b.perf_buffer_poll()
    except KeyboardInterrupt:
        exit()
The script is available on . Let's try to run it on a test platform where fio is running, writing to bcache, and trigger udevadm monitor:
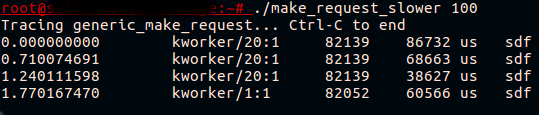
Finally! Now we see that what looked like a bottleneck for the bcache device was actually a bottleneck in the call generic_make_request() for the cached disk.
Dig into the Kernel
What exactly is slowing down during the request transfer? We observe that the delay occurs even before the accounting for the request begins, i.e. the accounting of the specific request for further statistical output (from /proc/diskstats or iostat) has not started yet. This can be easily verified by running iostat during the reproduction of the problem, or , which is based on the start and end of request accounting. None of these utilities will show problems for requests to the cached disk.
If we look at the function generic_make_request(), we will see that two more functions are called before the request accounting begins. The first is generic_make_request_checks(), which performs legitimacy checks of the request against the disk settings. The second is , which contains an interesting call to :
ret = wait_event_interruptible(q->mq_freeze_wq,
	(atomic_read(&q->mq_freeze_depth) == 0 &&
	(preempt || !blk_queue_preempt_only(q))) ||
	blk_queue_dying(q));
In it, the kernel waits for the queue to be unfrozen. Let's measure the delay blk_queue_enter():
~# /usr/share/bcc/tools/funclatency  blk_queue_enter -i 1 -m
Tracing 1 functions for "blk_queue_enter"... Hit Ctrl-C to end.

 	msecs           	: count 	distribution
     	0 -> 1      	: 341  	|****************************************|

 	msecs           	: count 	distribution
     	0 -> 1      	: 316  	|****************************************|

 	msecs           	: count 	distribution
     	0 -> 1      	: 255  	|****************************************|
     	2 -> 3      	: 0    	|                                    	|
     	4 -> 7      	: 0    	|                                    	|
     	8 -> 15     	: 1    	|                                    	|
It seems we are close to solving it. The functions used for "freezing/unfreezing" the queue are and . They are used when it is necessary to change queue settings that could be potentially harmful to requests in that queue. When calling blk_mq_freeze_queue() the function increments a counter q->mq_freeze_depth. After this, the kernel waits for the queue to be emptied in .
The wait time for clearing this queue is equivalent to the disk latency, as the kernel waits for all queued operations to finish. Once the queue is empty, the configuration changes are applied. After which, , decrementing the counter freeze_depth.
Now we know enough to resolve the issue. The udevadm trigger command ultimately leads to the configuration being applied for the block device. These configurations are described in the udev rules. We can find out which specific settings 'freeze' the queue by attempting to change them through sysfs or by looking at the kernel source code. Additionally, we can try the BCC utility , which will output the kernel and user space stack traces for each call to blk_freeze_queue, for example:
~# /usr/share/bcc/tools/trace blk_freeze_queue -K -U
PID 	TID 	COMM        	FUNC
3809642 3809642 systemd-udevd   blk_freeze_queue
    	blk_freeze_queue+0x1 [kernel]
    	elevator_switch+0x29 [kernel]
    	elv_iosched_store+0x197 [kernel]
    	queue_attr_store+0x5c [kernel]
    	sysfs_kf_write+0x3c [kernel]
    	kernfs_fop_write+0x125 [kernel]
    	__vfs_write+0x1b [kernel]
    	vfs_write+0xb8 [kernel]
    	sys_write+0x55 [kernel]
    	do_syscall_64+0x73 [kernel]
    	entry_SYSCALL_64_after_hwframe+0x3d [kernel]
    	__write_nocancel+0x7 [libc-2.23.so]
    	[unknown]

3809631 3809631 systemd-udevd   blk_freeze_queue
    	blk_freeze_queue+0x1 [kernel]
    	queue_requests_store+0xb6 [kernel]
    	queue_attr_store+0x5c [kernel]
    	sysfs_kf_write+0x3c [kernel]
    	kernfs_fop_write+0x125 [kernel]
    	__vfs_write+0x1b [kernel]
    	vfs_write+0xb8 [kernel]
    	sys_write+0x55 [kernel]
    	do_syscall_64+0x73 [kernel]
    	entry_SYSCALL_64_after_hwframe+0x3d [kernel]
    	__write_nocancel+0x7 [libc-2.23.so]
    	[unknown]
Udev rules change quite rarely and usually this happens under control. So we see that even applying already set values causes a surge in the request transmission delay from the application to the disk. Of course, generating udev events when there are no changes in disk configuration (e.g., the device is not being connected/disconnected) is not a very good practice. Nevertheless, we can help the kernel avoid doing unnecessary work and not 'freeze' the queue of requests if there is no need for it. resolve the issue.
Conclusion
eBPF is a very flexible and powerful tool. In this article, we explored one practical case and demonstrated a small part of what is possible. If you are interested in BCC utility development, it’s worth looking at the , which well describes the basics of operation.
There are also other interesting tools for debugging and profiling based on eBPF. One of them is , which allows writing powerful one-liners and small scripts in an awk-like language. Another is , which allows collecting low-level high-resolution metrics directly into your Prometheus server, with the possibility of obtaining beautiful visualizations and even alerts later.
Source: habr.com
