

To be honest, Ivan often laughed at the futile efforts of his colleagues in the monitoring department. They put enormous effort into implementing the metrics that the company management ordered. They were so busy that they didn't want to do anything else.
But the management was never satisfied – they constantly ordered new metrics, quickly forgetting about the ones that had already been created.
Recently, everyone was talking about Lead Time – the time it takes to deliver business features. The metric showed a staggering number – 200 days to deliver a single task. Everyone gasped, sighed, and raised their hands to the sky!
After a while, the noise gradually subsided, and management came up with a request for yet another metric.
Ivan understood that this new metric would quietly fade away in a dark corner just like the previous ones.
Indeed, Ivan thought, knowing the number doesn't tell anyone anything. Whether it's 200 days or 2 days makes no difference because the number doesn't help to identify the cause or to understand whether it's good or bad.
This is the typical trap of metrics: it seems that the new metric will reveal the essence of existence and explain some secret. Everyone hopes for it, but somehow nothing happens. It's because the secret should not be sought in the metrics at all!
For Ivan, this was a phase he had already gone through. He understood that for measurements, but all secrets should be sought in the , i.e., in what shapes this metric.
For an online store, the object of influence would be its customers bringing in money, and for DevOps – the teams that create and deploy distributions using a pipeline.
One day, settling into a comfortable chair in the lobby, Ivan decided to carefully think about how he would like to see DevOps metrics, considering that the object of influence is the teams.
The goal of DevOps metrics
It's clear that everyone wants to reduce delivery time. 200 days is, of course, unacceptable.
But how, that's the question?
The company has hundreds of teams, and thousands of distributions pass through the DevOps pipeline each day. The actual delivery time will look like a distribution. Each team will have its own time and its own peculiarities. How can anything be found amidst this mess?
The answer came to itself – we need to identify the problematic teams and figure out what is happening with them and why it takes so long, while learning from the 'good' teams how to do everything quickly. For this, it is necessary to measure the time spent by teams on each DevOps stand:
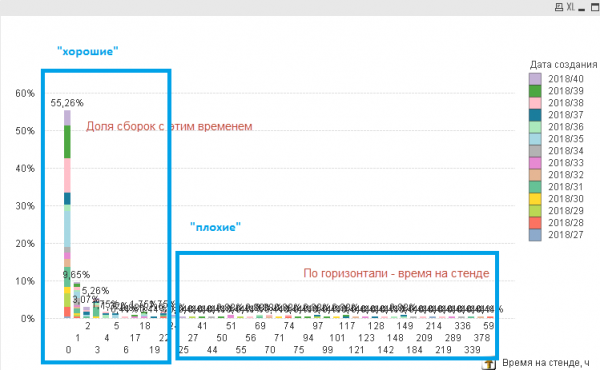
The goal of the system will be to select teams based on stand passage time, meaning we should end up with a list of teams along with their selected times, rather than just numbers.
If we find out how much total time was spent on the stand and how much time was spent on downtime between stands, we can contact the teams, investigate the reasons in more detail, and address them," Ivan thought.
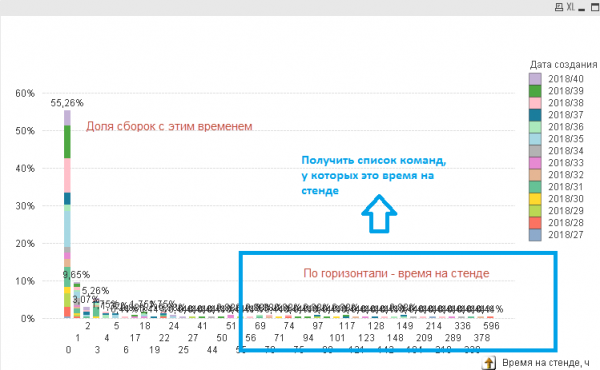
How to calculate delivery time for DevOps
To perform this calculation, it was necessary to delve into the DevOps process and its entities.
The company uses a limited number of systems, and information can only be obtained from them and nowhere else.
All tasks in the company were logged in Jira. When a task was taken up, a branch was created for it, and after implementation, a commit was made in BitBucket and a Pull Request was created. Upon PR acceptance, a distribution was automatically created and stored in Nexus.

The distribution was then deployed on several stands using Jenkins for verifying the correctness of the deployment, automatic and manual testing:
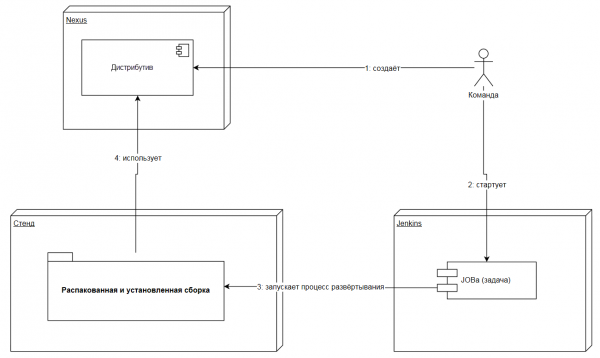
Ivan outlined what information can be extracted from which systems to calculate the time on the stands:
- From Nexus – The time of distribution creation and the name of the folder where the team's code was stored.
- From Jenkins – The start time, duration, and result of each job's execution, the name of the stand (in the job parameters), stages (job steps), and a link to the distribution in Nexus.
- Ivan decided not to include Jira and BitBucket in the pipeline, as they were more related to the development phase rather than to the deployment of the ready distribution on the stands.
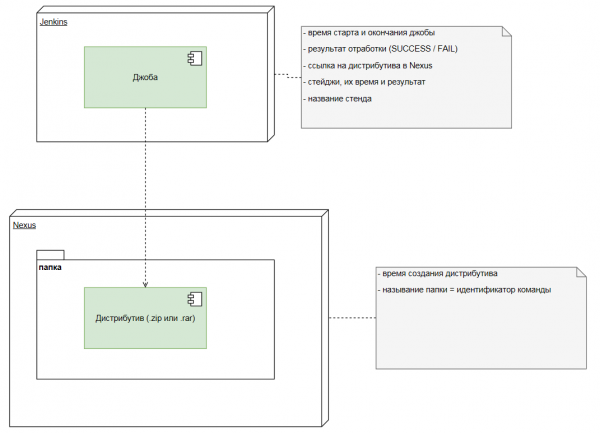
Based on the available information, the following scheme was drawn:
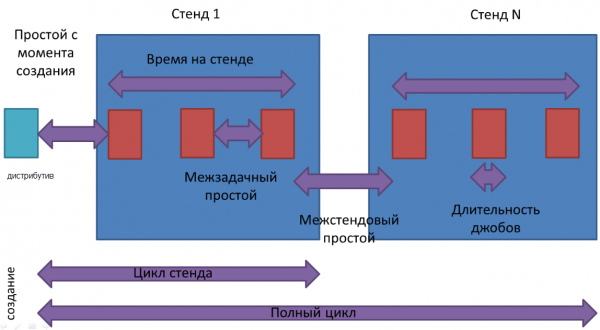
Knowing how much time it takes to create distributions and how much time is spent on each of them allows us to easily calculate the total costs for passing through the entire DevOps pipeline (full cycle).
Here are the DevOps metrics Ivan ended up with:
- The number of distributions created
- The share of distributions that 'entered' the stand and 'passed' the stand
- Time spent on the stand (stand cycle)
- Full cycle (total time across all stands)
- Job duration
- Idle time between stands
- Idle time between job launches on the same stand
On one hand, the metrics characterized the DevOps pipeline very well in terms of time, on the other hand, they were considered too simplistic.
Satisfied with the job well done, Ivan prepared a presentation and went to present it to the management.
On his way back, he looked gloomy and had his hands down.
"This is a fiasco, bro," smiled the ironic colleague…
Read more in the article "».
Source: habr.com
