

Today we will analyze the metrics of the disk subsystem in vSphere. Storage issues are the most common reason for slow virtual machine performance. While troubleshooting CPU and RAM issues typically ends at the hypervisor level, disk problems may require looking into the data transfer network and storage systems.
I will discuss this topic using block access to storage systems as an example, although the metrics are similar for file access.
A Bit of Theory
When discussing the performance of the disk subsystem in virtual machines, attention is usually paid to three interrelated parameters:
- the number of input/output operations (Input/Output Operations Per Second, IOPS);
- throughput;
- latency of input/output operations.
The number of IOPS is usually important for workloads of a random nature: accessing disk blocks located in different places. Examples of such workloads include databases, business applications (ERP, CRM), etc.
Throughput is important for sequential workloads: accessing blocks located one after another. For example, file servers (but not always) and video surveillance systems may generate such workloads.
Throughput is related to the number of input/output operations as follows:
Throughput = IOPS * Block size, where Block size is the size of the block.
Block size is a fairly important characteristic. Modern versions of ESXi handle blocks up to 32,767 KB. If the block is larger, it is divided into several smaller blocks. Not all storage systems can effectively work with such large blocks, which is why there is a parameter in the Advanced Settings of ESXi called DiskMaxIOSize. This can be used to reduce the maximum block size that the hypervisor processes (more details ). I recommend consulting with the storage system manufacturer before changing this parameter or at least testing changes in a lab environment.
A large block size can adversely affect the performance of the storage system. Even if the number of IOPS and throughput is relatively low, high latencies can be observed with a large block size. Therefore, pay attention to this parameter.
Latency – the most interesting performance parameter. The latency of input/output operations for a virtual machine consists of:
- delays within the hypervisor (KAVG, Average Kernel MilliSec/Read);
- delays introduced by the data transmission network and storage array (DAVG, Average Driver MilliSec/Command).
The overall delay visible in the guest OS (GAVG, Average Guest MilliSec/Command) is the sum of KAVG and DAVG.
GAVG and DAVG are measured, while KAVG is calculated: GAVG–DAVG.
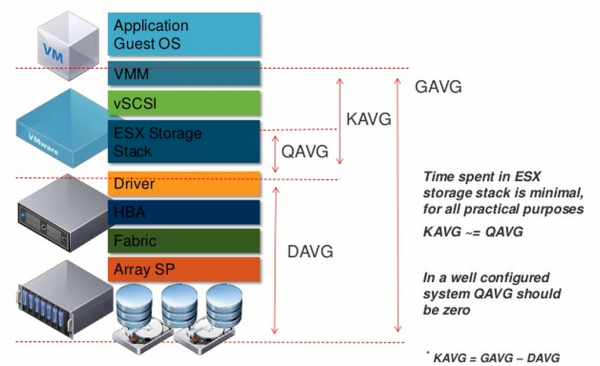
Let's take a closer look at KAVG. Under normal operating conditions, KAVG should aim for zero or at least be significantly lower than DAVG. The only known occurrence where KAVG is expected to be high is due to IOPS limitations on the VM's disk. In this case, KAVG will increase when trying to exceed the limit.
The most significant component of KAVG is QAVG – the time spent in the queue for processing inside the hypervisor. The other components of KAVG are negligible.
The queue in the disk adapter driver and the queues to the LUNs have a fixed size. For heavily loaded environments, it can be beneficial to increase this size. describes how to increase the queues in the adapter driver (the queue to the LUNs will also increase). This setting works when only one VM interacts with a LUN, which is rare. If multiple VMs are on a LUN, it's also necessary to increase the parameter Disk.SchedNumReqOutstanding (instruction ). By increasing the queue, you reduce both QAVG and KAVG accordingly.
But, again, first familiarize yourself with the documentation from the HBA vendor and test the changes in a lab environment.
The size of the queue to the LUN can be affected by enabling the SIOC (Storage I/O Control) mechanism. It ensures fair access to the LUN from all cluster servers by dynamically adjusting the queue length to the LUN on the servers. That is, if a VM on one of the hosts requires disproportionately high performance (noisy neighbor VM), SIOC reduces the length of the queue to the LUN on that host (DQLEN). For more information, .
We have covered KAVG, now a bit about DAVG. This one is straightforward: DAVG is the delay introduced by the external environment (data transmission network and storage array). In any modern, and even not so modern, storage array, there are performance counters. It's worthwhile to look at them when analyzing DAVG issues. If everything is fine from the ESXi and storage array side, check the data transmission network.
To avoid performance issues, choose the correct Path Selection Policy (PSP) for your storage system. Virtually all modern storage systems support PSP Round-Robin (with or without ALUA, Asymmetric Logical Unit Access). This policy allows the use of all available paths to the storage system. In the case of ALUA, only the paths to the controller that owns the LUN are used. Not all storage systems on ESXi have default rules that set the Round-Robin policy. If there are no rules for your storage system, use the plugin from the storage manufacturer to create an appropriate rule on all cluster hosts, or create a rule yourself. Details .
Also, some storage manufacturers recommend changing the number of IOPS on the path from the standard value of 1000 to 1. In our experience, this has allowed us to 'extract' more performance from the storage system and significantly reduce the time required for failover in the event of controller failure or upgrades. Check the vendor's recommendations, and if there are no contraindications, try changing this parameter. Details .
Main performance counters of the virtual machine's disk subsystem
The disk subsystem performance counters in vCenter are collected in the Datastore, Disk, Virtual Disk sections:
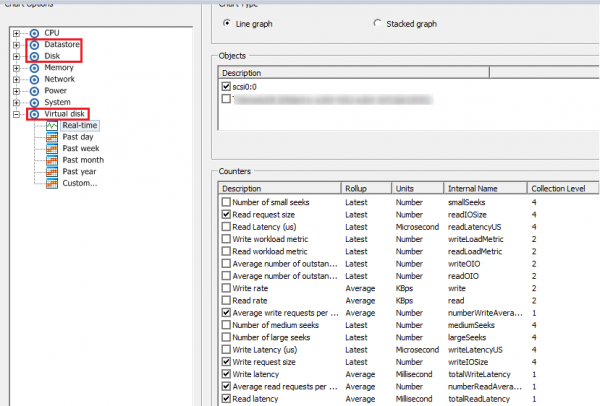
In the section Datastore contains metrics for vSphere datastores that host the VM disks. Here you will find the standard counters for:
- IOPS (Average read/write requests per second),
- throughput (Read/Write rate),
- latencies (Read/Write/Highest latency).
From the names of the counters, it's generally clear. I would like to emphasize once again that the statistics here are not for a specific VM (or VM disk), but general for the entire datastore. In my opinion, this statistic is easier to view in ESXTOP, especially considering that the minimum measurement period there is 2 seconds.
In the section Disk contains metrics for block devices used by the VM. Here you'll find counters for IOPS types such as summation (the number of input/output operations over the measurement period) and several counters related to block access (Commands aborted, Bus resets). In my opinion, this information is also easier to view in ESXTOP.
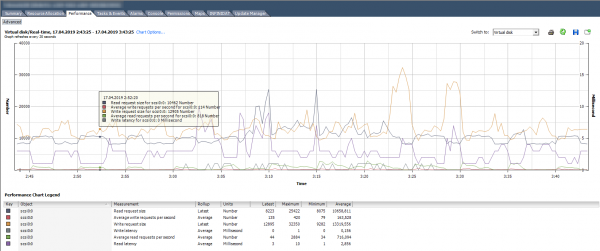
Partition Virtual Disk is the most useful for diagnosing the performance issues of the VM's disk subsystem. Here, you can view the performance of each virtual disk. This information is essential to understand if there is a problem with a specific virtual machine. In addition to standard counters for the number of I/O operations, read/write volume, and latencies, this section includes useful counters that show block sizes: Read/Write request size.
In the image below, the performance graph of the VM's disk shows the number of IOPS, latencies, and block size.
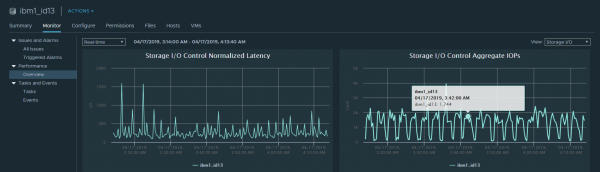
Performance metrics can also be viewed across the datastore if SIOC is enabled. Here, basic information on average latency and IOPS is presented. By default, this information can only be viewed in real-time.
ESXTOP
In ESXTOP, there are several screens that provide information about the host's disk subsystem as a whole, as well as individual virtual machines and their disks.
Let's start with information about virtual machines. The "Disk VM" screen is accessed by pressing the "v" key:
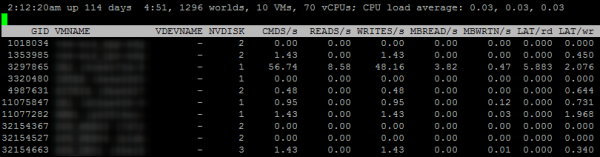
NVDISK is the number of disks of the VM. To view information about each disk, press "e" and enter the GID of the VM of interest.
The values of the other parameters on this screen are clear from their names.
Another useful screen for troubleshooting is the Disk adapter. It is accessed by pressing the "d" key (in the image below, fields A, B, C, D, E, G are selected):

NPTH is the number of paths to the LUNs that are visible from this adapter. To get information about each path on the adapter, press "e" and enter the adapter name:
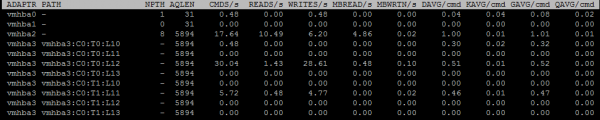
AQLEN is the maximum queue size on the adapter.
This screen also displays the latency counters that I mentioned earlier: KAVG/cmd, GAVG/cmd, DAVG/cmd, QAVG/cmd.
On the Disk device screen, which is accessed by pressing the "u" key, information about individual block devices – LUNs (in the image below, fields A, B, F, G, I are selected) is presented. Here, you can see the state of the queue to the LUNs.

DQLEN is the queue size for the block device.
ACTV is the number of I/O commands in the ESXi kernel.
QUED is the number of I/O commands in the queue.
%USD is AFTV / DQLEN × 100%.
LOAD is (ACTV + QUED) / DQLEN.
If %USD is high, consider the possibility of increasing the queue. The more commands in the queue, the higher QAVG and, correspondingly, KAVG.
You can also see on the Disk device screen whether VAAI (vStorage API for Array Integration) is running on the storage system. To check this, select fields A and O.
The VAAI mechanism allows some tasks to be offloaded from the hypervisor directly to the storage system, such as zeroing, block copying, or locking.

As shown in the image above, VAAI is operational on this storage system: primitives Zero and ATS are in active use.
Tips for optimizing disk subsystem performance on ESXi
- Pay attention to the block size.
- Set the optimal queue size on the HBA.
- Don’t forget to enable SIOC on datastores.
- Choose PSP according to the storage system manufacturer’s recommendations.
- Ensure VAAI is working.
Useful articles on the topic:
Source: habr.com
