

How can we grow the number of database queries tenfold without moving to a more powerful server while maintaining system functionality? I will share how we tackled the decline in our database performance, optimizing SQL queries to serve as many users as possible without increasing computing resource costs.
I provide a service for managing business processes in construction companies. We work with about 3,000 companies. More than 10,000 people interact with our system daily for 4-10 hours. It addresses various tasks such as planning, notification, alerting, and validation… We use PostgreSQL 9.6. Our database contains around 300 tables, and it receives up to 200 million queries (10,000 distinct) daily. On average, we handle 3,000 to 4,000 queries per second, with peaks exceeding 10,000 queries per second. Most of the queries are OLAP. Additions, modifications, and deletions are significantly fewer, meaning the OLTP load is relatively small. I present these figures so you can evaluate the scale of our project and understand how our experience may benefit you.
Scene One. Lyrical
When we began development, we didn’t give much thought to the load the database would bear or what we would do if the server couldn’t keep up. In designing the database, we followed general guidelines and tried to avoid shooting ourselves in the foot, but didn’t go beyond general advice like “don’t use the Entity Attribute Values pattern.” we didn’t delve deeper. We designed based on normalization principles, avoiding data redundancy and not focusing on speeding up specific queries. Once we started getting our first users, we encountered performance issues. As usual, we were completely unprepared for this. The initial problems were relatively simple. Typically, they were resolved by adding a new index. But there came a point when simple fixes stopped working. Realizing we lacked experience and found it increasingly difficult to comprehend the root of the problems, we hired specialists who helped us correctly configure the server, set up monitoring, and pointed us in the direction to look for solutions. .
Scene Two. Statistical
We have around 10,000 different queries that are executed on our database daily. Among these 10,000, there are monsters that are executed 2-3 million times with an average execution time of 0.1-0.3 ms, as well as queries with an average execution time of 30 seconds that are called 100 times a day.
Optimizing all 10,000 queries wasn't feasible, so we decided to figure out where to direct our efforts to correctly enhance database performance. After several iterations, we started categorizing the queries by type.
TOP queries
These are the heaviest queries that consume the most time (total time). They are either called very frequently or have very long execution times (long and frequent queries were optimized during the initial iterations aimed at speed). In total, the server spends the most time executing them. It’s important to separate top queries by total execution time and separately by IO time. The methods for optimizing these queries differ slightly.
It is common practice among all companies to work with TOP queries. There are only a few of them, and optimizing even one query can free up 5-10% of resources. However, as the project 'grows up,' optimizing TOP queries becomes an increasingly non-trivial task. All simple methods have already been utilized, and even the 'heaviest' query consumes only 'about' 3-5% of resources. If TOP queries together occupy less than 30-40% of the time, then you've likely already put in the effort to ensure they run quickly, and it’s time to move on to optimizing queries from the next group.
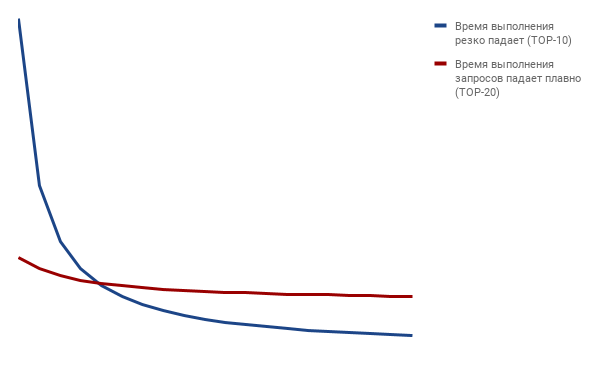
The question remains how many top queries to include in this group. I usually take no fewer than 10 but no more than 20. I aim for the execution time of the first and last in the TOP group to differ by no more than 10 times. That is, if the execution time of queries drops sharply from 1st to 10th place, I take TOP-10; if the decline is more gradual, I increase the group size to 15 or 20.
Middling queries (medium)
These are all the queries that follow TOP, excluding the last 5-10%. Usually, the opportunity to significantly improve server performance is hidden in the optimization of these queries. These queries can account for up to 80%. But even if their share exceeds 50%, it's time to take a closer look at them.
Tail queries (tail)
As mentioned, these queries are at the end and they take 5-10% of the time. You can forget about them, unless you are using automated query analysis tools; then optimizing them can also be inexpensive.
How to evaluate each group?
I use an SQL query that helps to make such an evaluation for PostgreSQL (I'm sure a similar query can be written for many other DBMS).
SQL query for estimating the size of TOP-MEDIUM-TAIL groups
SELECT sum(time_top) AS sum_top, sum(time_medium) AS sum_medium, sum(time_tail) AS sum_tail
FROM
(
  SELECT CASE WHEN rn  20 AND rn  800              THEN tt_percent ELSE 0 END AS time_tail
  FROM (
    SELECT total_time / (SELECT sum(total_time) FROM pg_stat_statements) * 100 AS tt_percent, query,
    ROW_NUMBER () OVER (ORDER BY total_time DESC) AS rn
    FROM pg_stat_statements
    ORDER BY total_time DESC
  ) AS t
)
AS ts
The result of the query is three columns, each containing the percentage of time spent processing queries from this group. Inside the query, there are two numbers (in my case, these are 20 and 800) that separate the queries of one group from another.
This is roughly how the shares of queries at the beginning of the optimization work compare to now.
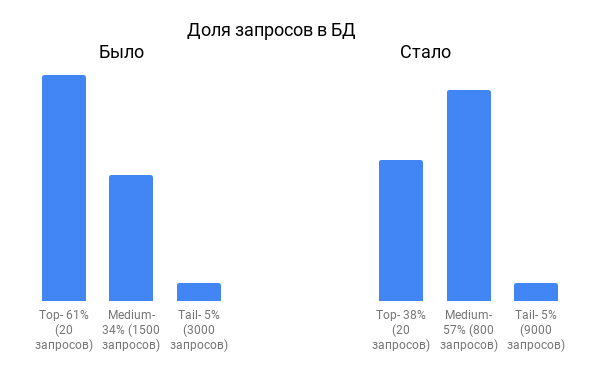
The diagram shows that the share of TOP queries has sharply decreased, while the 'medium' queries have increased.
Initially, the TOP queries included blatant errors. Over time, these teething problems disappeared, the share of TOP queries decreased, and more effort was required to speed up the heavy queries.
To get the query texts, we use the following query
SELECT * FROM (
  SELECT ROW_NUMBER () OVER (ORDER BY total_time DESC) AS rn, total_time / (SELECT sum(total_time) FROM pg_stat_statements) * 100 AS tt_percent, query
  FROM pg_stat_statements
  ORDER BY total_time DESC
) AS T
WHERE
rn  20 AND rn  800  -- TAIL
Here is a list of the most commonly used techniques that helped us speed up the TOP queries:
- Redesigning the system, for example, reworking notification logic to use a message broker instead of periodic database queries.
- Adding or changing indexes.
- Rewriting ORM queries to pure SQL.
- Rewriting lazy data loading logic.
- Caching through denormalization of data. For example, we have a relationship between tables Delivery -> Invoice -> Request -> Application. Each delivery is linked to an application through other tables. To avoid linking all tables in each query, we duplicated the reference to the application in the Delivery table.
- Caching static tables with reference data and infrequently changing tables in the program's memory.
Sometimes changes led to a substantial redesign, but resulted in a 5-10% reduction in system load and were justified. Over time, the payoff became less significant, whereas the redesign required became more serious.
At that point, we focused on the second group of queries - the middle range. This group had significantly more queries, and it seemed that analyzing the entire group would take a lot of time. However, most queries turned out to be very simple to optimize, and many problems repeated themselves in various forms dozens of times. Here are examples of some typical optimizations we applied to dozens of similar queries, with each group of optimized queries reducing the DB load by 3-5%.
- Instead of checking for the existence of records using COUNT and fully scanning the table, we started using EXISTS.
- We eliminated DISTINCT (there's no universal recipe for this, but sometimes it can be easily removed, speeding up the query 10-100 times).
For example, instead of querying all drivers from a large delivery table (DELIVERY)
SELECT DISTINCT P.ID, P.FIRST_NAME, P.LAST_NAME
FROM DELIVERY D JOIN PERSON P ON D.DRIVER_ID = P.ID
we made a query on a comparatively small PERSON table
SELECT P.ID, P.FIRST_NAME, P.LAST_NAME
FROM PERSON
WHERE EXISTS(SELECT D.ID FROM DELIVERY WHERE D.DRIVER_ID = P.ID)
It seemed we were using a correlated subquery, but it provided a speedup of more than 10 times.
- In many cases, we completely abandoned COUNT and
- instead of
UPPER(s) LIKE JOHN%’use
s ILIKE “John%”
Each individual query was sometimes sped up by 3-1000 times. Despite the impressive metrics, initially, we thought there was no point in optimizing a query that runs in 10 ms, ranks among the top 300 most resource-intensive queries, and takes up a fraction of a percent of the overall DB load time. However, applying the same recipe to a group of similar queries allowed us to recoup several percentage points. To avoid spending time manually reviewing all hundreds of queries, we wrote several simple scripts that used regular expressions to identify similar queries. As a result, the automated grouping of queries allowed us to further enhance our performance with modest effort.
As a result, we have been operating on the same hardware for three years. The average daily load is about 30%, peaking up to 70%. The number of requests and users has increased approximately tenfold. All of this is thanks to constant monitoring of these request groups: TOP and MEDIUM. As soon as a new request appears in the TOP group, we analyze it immediately and try to speed it up. We review the MEDIUM group once a week using request analysis scripts. If new requests come up that we already know how to optimize, we quickly make those changes. Sometimes we find new optimization methods that can be applied to several requests at once.
According to our forecasts, the current server can handle an increase in the number of users by another 3-5 times. However, we still have one ace up our sleeve — we have not yet switched the SELECT queries to a mirror, as is recommended. We deliberately do not do this, as we want to fully exhaust the possibilities of 'smart' optimization before resorting to 'heavy artillery.'
A critical look at the work done may suggest using vertical scaling. Buying a more powerful server instead of wasting specialists' time. A server may not cost as much, especially since our limits for vertical scaling have not yet been exhausted. However, the number of requests has only increased tenfold. Over the years, the functionality of the system has increased, and now there are more varieties of requests. The functionality that existed is now executed with fewer requests due to caching, and these requests are more effective. This means we can confidently multiply by another 5 to get the actual acceleration ratio. So, by the most conservative estimates, we can say that the acceleration is 50 times or more. Vertically scaling the server by 50 times would have been more expensive. Especially considering that once optimization is performed, it works all the time, while the bill for the rental server comes every month.
Source: habr.com
