


In the last few years, time-series databases have transformed from a curious thing (applied either in specialized open monitoring systems or tied to specific solutions, or in Big Data projects) into a 'mass consumer product'. In Russia, we owe a special thanks for this to Yandex and ClickHouse. Until then, if you needed to store a large amount of time-series data, you had to either accept the need to deploy a monstrous Hadoop stack and maintain it, or deal with protocols specific to each system.
It may seem that in 2019, an article about which TSDB to use would consist of just one sentence: 'just use ClickHouse'. But... there are nuances.
Indeed, ClickHouse is actively developing, the user base is growing, and support is being conducted very actively, but have we become hostages to the public success of ClickHouse, which has overshadowed other, perhaps more efficient/reliable solutions?
At the beginning of last year, we began reworking our own monitoring system, during which the question of choosing a suitable database for data storage arose. I want to recount the history of this choice here.
Task Definition
First of all — the necessary preface. Why do we need our own monitoring system at all and how was it structured?
We started providing support services in 2008, and by 2010 it became clear that aggregating data on processes occurring in client infrastructure using solutions available at that time became difficult (we are talking about, God forbid, Cacti, Zabbix, and the budding Graphite).
Our main requirements were:
- support (at that time — dozens, and in the future — hundreds) of clients within a single system, while having a centralized alert management system;
- flexibility in managing the alerting system (alert escalation between duty officers, schedule accounting, knowledge base);
- the ability to deeply detail graphs (Zabbix at that time rendered graphs as images);
- long-term storage of large amounts of data (a year or more) and the ability to quickly retrieve it.
In this article, we are interested in the last point.
Speaking of storage, the requirements were as follows:
- the system must operate quickly;
- it would be preferable for the system to have an SQL interface;
- the system must be stable and have an active user base and support (at one time we encountered the necessity of maintaining systems like MemcacheDB, which was no longer being developed, or distributed storage MooseFS, whose bug tracker was maintained in Chinese: we didn't want to repeat this story for our project);
- compliance with the CAP theorem: Consistency (essential) — data must be current, we don't want the notification management system to miss new data and flood us with alerts about the lack of data across all projects; Partition Tolerance (mandatory) — we do not want to face a Split Brain situation; Availability (not critical, in the presence of an active replica) — we can switch to the backup system ourselves in the event of a failure, via code.
Strangely enough, at that time, the perfect solution for us turned out to be MySQL. Our data structure was extremely simple: server ID, counter ID, timestamp, and value; rapid retrieval of hot data was ensured by a large buffer pool size, while historical data retrieval was facilitated by SSDs.
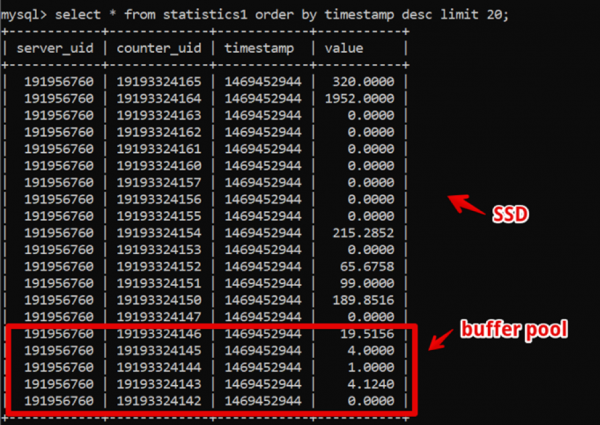
As a result, we achieved the retrieval of fresh two-week data with second-level granularity in 200 ms before the full data rendering, and we lived in this system for quite a long time.
Meanwhile, time passed and the amount of data grew. By 2016, the data volumes reached tens of terabytes, which was a significant expense in the context of rented SSD storage.
By this time, columnar databases had become widely used, which we began to actively consider: in columnar databases, data is stored, as you can understand, in columns, and looking at our data, it was easy to see a large number of duplicates that could be compressed in the event of using a columnar database.
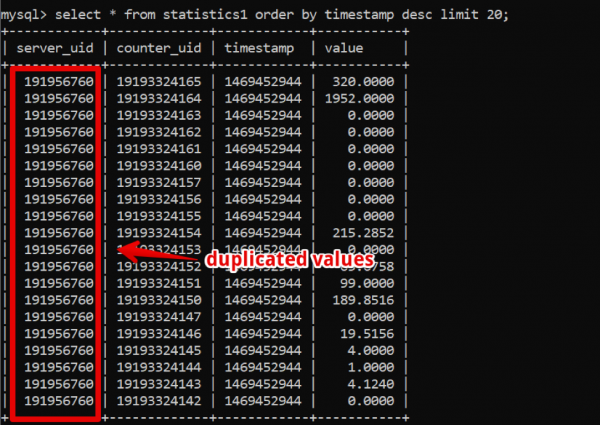
However, the company's key system continued to operate steadily, and we didn't want to experiment with transitioning to something else.
In 2017, during the Percona Live conference in San Jose, the developers of Clickhouse probably made their first significant impact. At first glance, the system appeared to be production-ready (after all, Yandex.Metrics represents a tough production environment), support was quick and straightforward, and, most importantly, the operation was simple. Starting in 2018, we initiated the transition process. However, by that time, many mature and time-tested TSDB systems had emerged, and we decided to dedicate considerable time to comparing alternatives to ensure that there were no other solutions that met our requirements besides Clickhouse.
In addition to the already stated requirements for the storage system, new ones emerged:
- the new system must provide at least the same performance as MySQL on the same hardware;
- the new system's storage should occupy significantly less space;
- the database must still be easy to manage;
- we wanted to make minimal changes to the application when switching databases.
Which systems we began to consider
Apache Hive/Apache Impala
The old proven Hadoop stack. Essentially, it’s a SQL interface built on top of data stored in proprietary formats in HDFS.
Pros.
- With stable operation, it is very easy to scale data.
- There are columnar data storage solutions (using less space).
- Very fast execution of parallel tasks when resources are available.
Cons.
- This is Hadoop, and it is complex to operate. If we are not ready to use a ready-made solution in the cloud (and we are not due to cost), the entire stack will need to be assembled and maintained manually by admins, which is undesirable.
- Data is aggregated .
However:
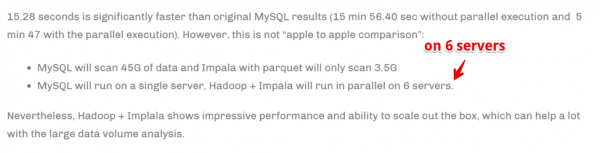
Speed is achieved by scaling the number of computing servers. In simpler terms, if we are a large company engaged in analytics and it is critically important for the business to aggregate information as quickly as possible (even at the cost of using a large amount of computational resources), this could be our choice. But we were not prepared to significantly increase our hardware fleet for the speed of task execution.
Druid/Pinot
These are much more specifically about TSDB, but again, it’s a Hadoop stack.
There is .
In a few words: Druid/Pinot appear to outperform Clickhouse in cases where:
- You have a heterogeneous nature of data (in our case, we are recording only time series of server metrics, and this is essentially one table. However, there may be other cases: time series for equipment, economic time series, etc. — each with its own structure that needs to be aggregated and processed).
- At the same time, there is a lot of this data.
- Tables and data with time series appear and disappear (meaning some set of data arrives, it gets analyzed, and then it gets deleted).
- There is no clear criterion by which the data can be partitioned.
In opposite cases, ClickHouse performs better, and this is our case.
ClickHouse
- SQL-like.
- Easy to manage.
- People say it works.
Makes it to the testing shortlist.
InfluxDB
A foreign alternative to ClickHouse. The downside is that High Availability is available only in the commercial version, but it needs to be compared.
Makes it to the testing shortlist.
Cassandra
On the one hand, we know that monitoring systems like, for example, use it for storing metric time series, such as or OkMeter. However, there are specifics.
Cassandra is not a columnar database in the traditional sense. It resembles a row-oriented database, but each row can have a different number of columns, making it easy to organize a columnar representation. In this sense, it is clear that with a limit of 2 billion columns, one can store certain data in columns (like time series). For example, in MySQL, there is a limit of 4096 columns, and one can easily encounter an error with code 1117 if attempting to do the same.
Cassandra is a database engine designed for storing large volumes of data in a distributed system without a master. According to the aforementioned CAP theorem, Cassandra leans more towards AP, meaning it emphasizes data availability and resistance to partitioning. Thus, this tool can be very suitable if the requirement is mainly to write to the database and read from it infrequently. It makes sense to use Cassandra as a "cold" storage solution, serving as a long-term reliable repository for vast amounts of historical data that are rarely needed but can be retrieved when necessary. Nonetheless, for the sake of completeness, we will also test it. However, as I mentioned earlier, I do not wish to actively rewrite the code for the selected database solution, so our testing will be somewhat limited—without adapting the database structure to Cassandra's specifications.
Prometheus
Out of curiosity, we decided to test the performance of the Prometheus storage—simply to understand whether it is faster or slower than our current solutions and by how much.
Testing Methodology and Results
So, we tested 5 databases in the following 6 configurations: ClickHouse (1 node), ClickHouse (distributed table on 3 nodes), InfluxDB, MySQL 8, Cassandra (3 nodes), and Prometheus. The testing plan is as follows:
- we upload historical data for a week (840 million values per day; 208,000 metrics);
- we generate write load (considering 6 load modes, see below);
- concurrently with writing, we periodically make queries, simulating a user interacting with charts. To keep it simple, we selected data for 10 metrics (which is exactly how many are displayed on the CPU chart) over the week.
We load by emulating the behavior of our monitoring agent, which sends values to each metric every 15 seconds. In doing so, we are interested in varying:
- the total number of metrics to which data is written;
- the interval for sending values to a single metric;
- the batch size.
Regarding batch size. Since almost all our test databases do not recommend loading single inserts, we will need a relay that collects incoming metrics, groups them by a certain amount, and writes them to the database using batch inserts.
To better understand how to interpret the data we receive later, let's imagine that we are not just sending a bunch of metrics, but that the metrics are organized into servers — with 125 metrics per server. Here, the server is just a virtual entity — simply to understand that, for example, 10,000 metrics correspond to about 80 servers.
Taking all this into account, here are our 6 write load modes for the database:
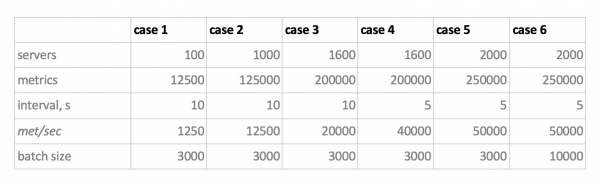
There are two points to note. First, for Cassandra, these batch sizes turned out to be too large; we used values of 50 or 100 there. Second, since Prometheus operates strictly in pull mode, meaning it fetches data from metric sources itself (and even the push gateway, despite its name, does not fundamentally change the situation), the corresponding loads were implemented using a combination of static configs.
The testing results are as follows:
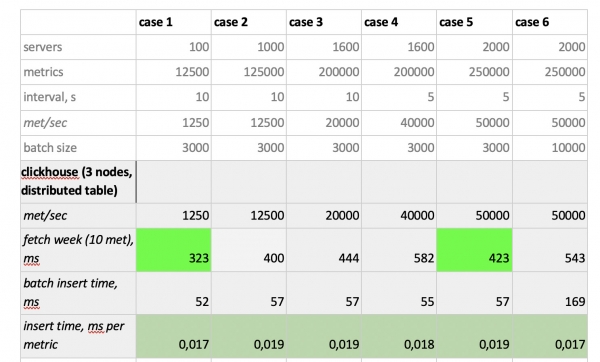
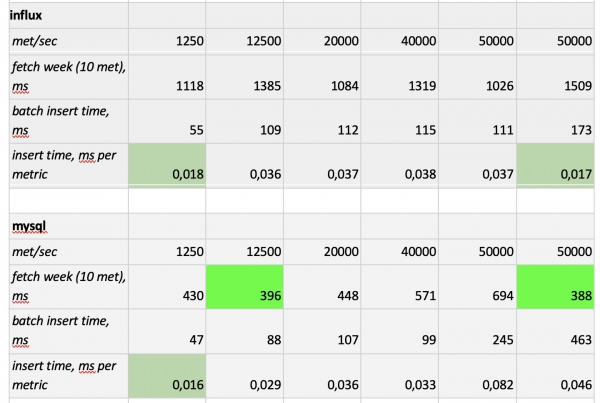
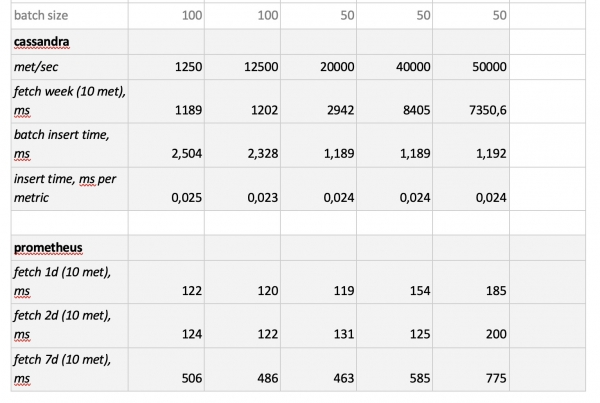
What is worth noting: fantastically fast queries from Prometheus, alarmingly slow queries from Cassandra, and unacceptably slow queries from InfluxDB; in terms of write speed, ClickHouse won all competitions, while Prometheus does not participate in the contest because it performs inserts internally without any measurements.
As a result,: ClickHouse and InfluxDB performed the best, but a cluster of Influx can only be built on the Enterprise version, which costs money, whereas ClickHouse is free and developed in Russia. Logically, in the US the choice is likely in favor of InfluxDB, while here it's in favor of ClickHouse.
Source: habr.com
