

The Webalizer utility and Google Analytics tool have helped me for many years to understand what is happening on websites. Now I realize they provide very little useful information. With access to my access.log file, analyzing statistics becomes very simple, using basic tools such as SQLite, HTML, SQL language, and any scripting programming language.
The data source for Webalizer is the access.log file. server. This is how its columns and numbers appear, which only give an overview of the total traffic:
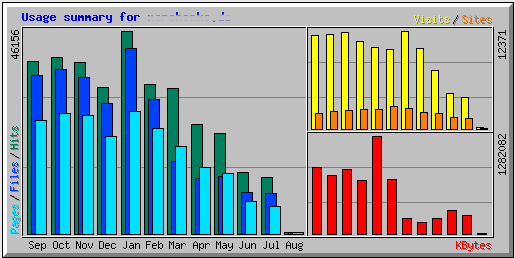
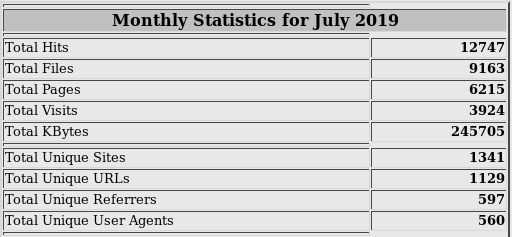
Tools like Google Analytics collect data from the loaded page themselves. They display a couple of charts and lines, based on which it's often difficult to draw accurate conclusions. Perhaps more effort should have been made? I don't know.
So, what did I want to see in the website visit statistics?
Traffic from users and bots
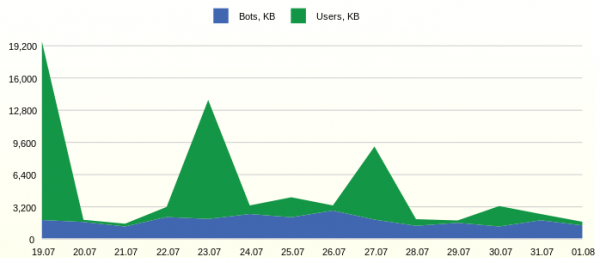
Often, website traffic has limitations, and it is necessary to see how much useful traffic is being utilized. For example, like this:
SQL report query
SELECT
1 as 'StackedArea: Traffic generated by Users and Bots',
strftime('%d.%m', datetime(FCT.EVENT_DT, 'unixepoch')) AS 'Day',
SUM(CASE WHEN USG.AGENT_BOT!='n.a.' THEN FCT.BYTES ELSE 0 END)/1000 AS 'Bots, KB',
SUM(CASE WHEN USG.AGENT_BOT='n.a.' THEN FCT.BYTES ELSE 0 END)/1000 AS 'Users, KB'
FROM
  FCT_ACCESS_USER_AGENT_DD FCT,
  DIM_USER_AGENT USG
WHERE FCT.DIM_USER_AGENT_ID=USG.DIM_USER_AGENT_ID
  AND datetime(FCT.EVENT_DT, 'unixepoch') >= date('now', '-14 day')
GROUP BY strftime('%d.%m', datetime(FCT.EVENT_DT, 'unixepoch'))
ORDER BY FCT.EVENT_DT
The chart shows consistent activity from bots. It would be interesting to study the most active representatives in detail.
Annoying bots
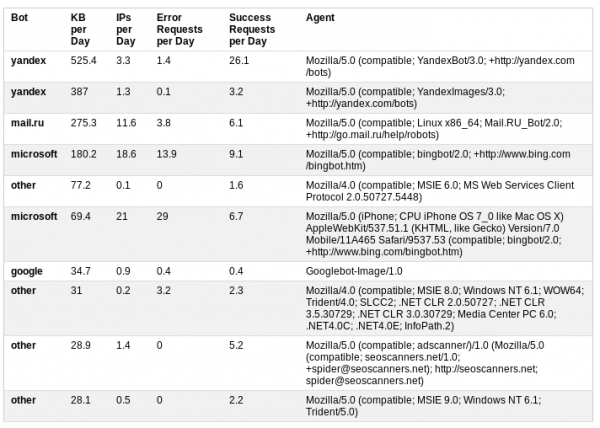
We classify bots based on user agent information. Additional statistics on daily traffic, the number of successful and unsuccessful requests provide a good insight into bot activity.
SQL report query
SELECT
1 AS 'Table: Annoying Bots',
MAX(USG.AGENT_BOT) AS 'Bot',
ROUND(SUM(FCT.BYTES)/1000 / 14.0, 1) AS 'KB per Day',
ROUND(SUM(FCT.IP_CNT) / 14.0, 1) AS 'IPs per Day',
ROUND(SUM(CASE WHEN STS.STATUS_GROUP IN ('Client Error', 'Server Error') THEN FCT.REQUEST_CNT / 14.0 ELSE 0 END), 1) AS 'Error Requests per Day',
ROUND(SUM(CASE WHEN STS.STATUS_GROUP IN ('Successful', 'Redirection') THEN FCT.REQUEST_CNT / 14.0 ELSE 0 END), 1) AS 'Success Requests per Day',
USG.USER_AGENT_NK AS 'Agent'
FROM FCT_ACCESS_USER_AGENT_DD FCT,
     DIM_USER_AGENT USG,
     DIM_HTTP_STATUS STS
WHERE FCT.DIM_USER_AGENT_ID = USG.DIM_USER_AGENT_ID
  AND FCT.DIM_HTTP_STATUS_ID = STS.DIM_HTTP_STATUS_ID
  AND USG.AGENT_BOT != 'n.a.'
  AND datetime(FCT.EVENT_DT, 'unixepoch') >= date('now', '-14 day')
GROUP BY USG.USER_AGENT_NK
ORDER BY 3 DESC
LIMIT 10
In this case, the analysis resulted in a decision to restrict access to the site by adding to the robots.txt file.
User-agent: AhrefsBot
 Disallow: /
 User-agent: dotbot
 Disallow: /
 User-agent: bingbot
 Crawl-delay: 5
The first two bots disappeared from the table, while the MS robots moved down from the top positions.
Day and time of the highest activity
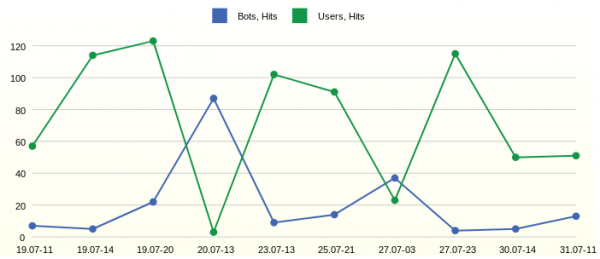
Traffic shows peaks. To investigate them in detail, it is essential to highlight the time of their occurrence, without necessarily displaying all hours and days of the time measurement. This will make it easier to find specific requests in the log file, if detailed analysis is needed.
SQL report query
SELECT
1 AS 'Line: Day and Hour of Hits from Users and Bots',
strftime('%d.%m-%H', datetime(EVENT_DT, 'unixepoch')) AS 'Date Time',
HIB AS 'Bots, Hits',
HIU AS 'Users, Hits'
FROM (
	SELECT
	EVENT_DT,
	SUM(CASE WHEN AGENT_BOT!='n.a.' THEN LINE_CNT ELSE 0 END) AS HIB,
	SUM(CASE WHEN AGENT_BOT='n.a.' THEN LINE_CNT ELSE 0 END) AS HIU
	FROM FCT_ACCESS_REQUEST_REF_HH
	WHERE datetime(EVENT_DT, 'unixepoch') >= date('now', '-14 day')
	GROUP BY EVENT_DT
	ORDER BY SUM(LINE_CNT) DESC
	LIMIT 10
) ORDER BY EVENT_DT
We observe the most active hours at 11, 14, and 20 on the first day in the graph. However, on the next day, bots were active at 1 PM.
Average daily user activity by week
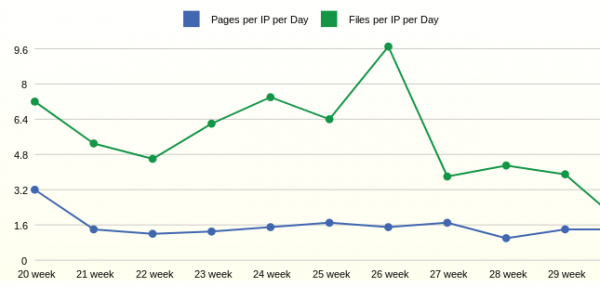
We have sorted out the activity and traffic a bit. The next question was the activity of the users themselves. For this kind of statistics, longer aggregation periods are desirable, such as a week.
SQL report query
SELECT
1 as 'Line: Average Daily User Activity by Week',
strftime('%W week', datetime(FCT.EVENT_DT, 'unixepoch')) AS 'Week',
ROUND(1.0*SUM(FCT.PAGE_CNT)/SUM(FCT.IP_CNT),1) AS 'Pages per IP per Day',
ROUND(1.0*SUM(FCT.FILE_CNT)/SUM(FCT.IP_CNT),1) AS 'Files per IP per Day'
FROM
  FCT_ACCESS_USER_AGENT_DD FCT,
  DIM_USER_AGENT USG,
  DIM_HTTP_STATUS HST
WHERE FCT.DIM_USER_AGENT_ID=USG.DIM_USER_AGENT_ID
  AND FCT.DIM_HTTP_STATUS_ID = HST.DIM_HTTP_STATUS_ID
  AND USG.AGENT_BOT='n.a.' /* users only */
  AND HST.STATUS_GROUP IN ('Successful') /* good pages */
  AND datetime(FCT.EVENT_DT, 'unixepoch') > date('now', '-3 month')
GROUP BY strftime('%W week', datetime(FCT.EVENT_DT, 'unixepoch'))
ORDER BY FCT.EVENT_DT
Statistics for the week show that, on average, one user opens 1.6 pages per day. The number of requested files per user, in this case, depends on the addition of new files to the site.
All requests and their statuses
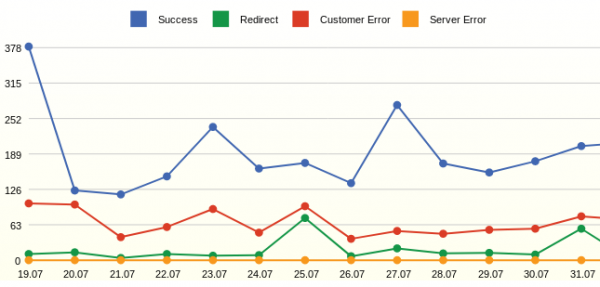
Webalizer has always shown specific page codes, and it's desirable to see just the number of successful requests and errors.
SQL report query
SELECT
1 as 'Line: All Requests by Status',
strftime('%d.%m', datetime(FCT.EVENT_DT, 'unixepoch')) AS 'Day',
SUM(CASE WHEN STS.STATUS_GROUP='Successful' THEN FCT.REQUEST_CNT ELSE 0 END) AS 'Success',
SUM(CASE WHEN STS.STATUS_GROUP='Redirection' THEN FCT.REQUEST_CNT ELSE 0 END) AS 'Redirect',
SUM(CASE WHEN STS.STATUS_GROUP='Client Error' THEN FCT.REQUEST_CNT ELSE 0 END) AS 'Customer Error',
SUM(CASE WHEN STS.STATUS_GROUP='Server Error' THEN FCT.REQUEST_CNT ELSE 0 END) AS 'Server Error'
FROM
  FCT_ACCESS_USER_AGENT_DD FCT,
  DIM_HTTP_STATUS STS
WHERE FCT.DIM_HTTP_STATUS_ID=STS.DIM_HTTP_STATUS_ID
  AND datetime(FCT.EVENT_DT, 'unixepoch') >= date('now', '-14 day')
GROUP BY strftime('%d.%m', datetime(FCT.EVENT_DT, 'unixepoch'))
ORDER BY FCT.EVENT_DT
The report shows requests, not clicks (hits). Unlike the LINE_CNT metric, REQUEST_CNT is counted as COUNT(DISTINCT STG.REQUEST_NK). The goal is to highlight effective events; for example, MS bots query the robots.txt file hundreds of times a day, and in this case, such queries will be counted once. This helps to smooth out spikes in the graph.
The chart reveals numerous errors—these are non-existent pages. The analysis resulted in adding redirects from deleted pages.
Error Requests
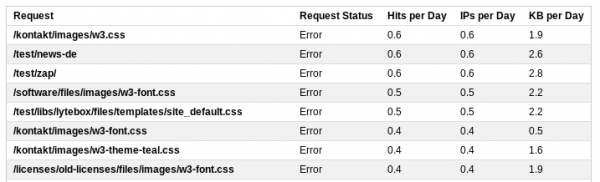
For a detailed examination of requests, detailed statistics can be produced.
SQL report query
SELECT
  1 AS 'Table: Top Error Requests',
  REQ.REQUEST_NK AS 'Request',
  'Error' AS 'Request Status',
  ROUND(SUM(FCT.LINE_CNT) / 14.0, 1) AS 'Hits per Day',
  ROUND(SUM(FCT.IP_CNT) / 14.0, 1) AS 'IPs per Day',
  ROUND(SUM(FCT.BYTES)/1000 / 14.0, 1) AS 'KB per Day'
FROM
  FCT_ACCESS_REQUEST_REF_HH FCT,
  DIM_REQUEST_V_ACT REQ
WHERE FCT.DIM_REQUEST_ID = REQ.DIM_REQUEST_ID
  AND FCT.STATUS_GROUP IN ('Client Error', 'Server Error')
  AND datetime(FCT.EVENT_DT, 'unixepoch') >= date('now', '-14 day')
GROUP BY REQ.REQUEST_NK
ORDER BY 4 DESC
LIMIT 20
This list will also include all calls, for example, a request to /wp-login.php. By adjusting the rewrite rules for requests, proxy server it is possible to adjust the server's response to such requests and redirect them to the homepage.
Thus, a few simple reports based on the server log file provide a fairly comprehensive picture of what is happening on the site.
How to obtain the information?
SQLite databases are sufficient. We will create tables: a helper one for logging ETL processes.
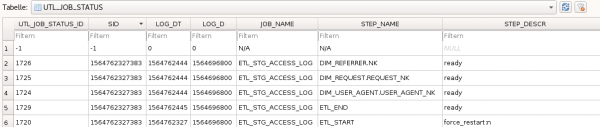
A staging table where we will write log files using PHP. Two aggregate tables. We will create a daily table with statistics on user agents and request statuses, and an hourly table with statistics on requests, status groups, and agents. A total of four corresponding dimension tables.
As a result, the following relational model was created:
Data model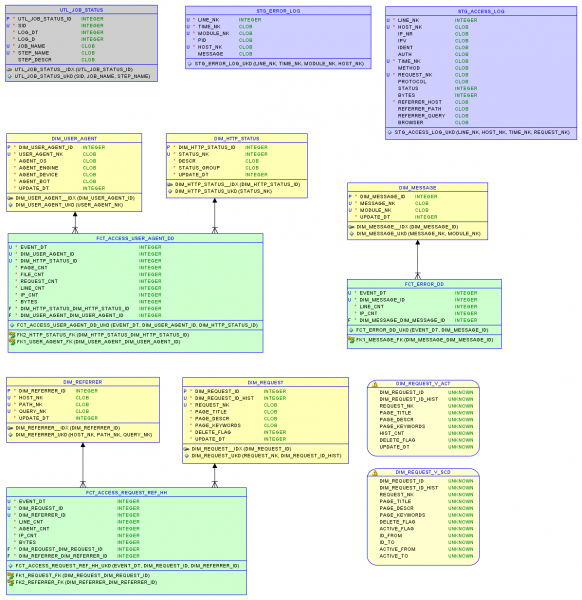
Script to create an object in the SQLite database:
DDL creation of the object
DROP TABLE IF EXISTS DIM_USER_AGENT;
CREATE TABLE DIM_USER_AGENT (
  DIM_USER_AGENT_ID INTEGER NOT NULL PRIMARY KEY AUTOINCREMENT,
  USER_AGENT_NK     TEXT NOT NULL DEFAULT 'n.a.',
  AGENT_OS          TEXT NOT NULL DEFAULT 'n.a.',
  AGENT_ENGINE      TEXT NOT NULL DEFAULT 'n.a.',
  AGENT_DEVICE      TEXT NOT NULL DEFAULT 'n.a.',
  AGENT_BOT         TEXT NOT NULL DEFAULT 'n.a.',
  UPDATE_DT         INTEGER NOT NULL DEFAULT 0,
  UNIQUE (USER_AGENT_NK)
);
INSERT INTO DIM_USER_AGENT (DIM_USER_AGENT_ID) VALUES (-1);
Stage
In the case of the access.log file, it is necessary to read, parse, and write all requests to the database. This can be done either directly using scripting language tools or by utilizing sqlite tools.
Log file format:
//67.221.59.195 - - [28/Dec/2012:01:47:47 +0100] "GET /files/default.css HTTP/1.1" 200 1512 "https://project.edu/" "Mozilla/4.0"
//host ident auth time method request_nk protocol status bytes ref browser
$log_pattern = '/^([^ ]+) ([^ ]+) ([^ ]+) ([[^]]+]) "(.*) (.*) (.*)" ([0-9-]+) ([0-9-]+) "(.*)" "(.*)"$/';
Key Propagation
When raw data is in the database, it is necessary to write the keys that are not present into the dimension tables. This will allow referencing the dimensions. For example, in the DIM_REFERRER table, the key is a combination of three fields.
SQL Query for key propagation
/* Propagate the referrer from access log */
INSERT INTO DIM_REFERRER (HOST_NK, PATH_NK, QUERY_NK, UPDATE_DT)
SELECT
	CLS.HOST_NK,
	CLS.PATH_NK,
	CLS.QUERY_NK,
	STRFTIME('%s','now') AS UPDATE_DT
FROM (
	SELECT DISTINCT
	REFERRER_HOST AS HOST_NK,
	REFERRER_PATH AS PATH_NK,
	CASE WHEN INSTR(REFERRER_QUERY,'&sid')>0 THEN SUBSTR(REFERRER_QUERY, 1, INSTR(REFERRER_QUERY,'&sid')-1) /* отрезаем sid - специфика цмс */
	ELSE REFERRER_QUERY END AS QUERY_NK
	FROM STG_ACCESS_LOG
) CLS
LEFT OUTER JOIN DIM_REFERRER TRG
ON (CLS.HOST_NK = TRG.HOST_NK AND CLS.PATH_NK = TRG.PATH_NK AND CLS.QUERY_NK = TRG.QUERY_NK)
WHERE TRG.DIM_REFERRER_ID IS NULL
Propagation to the user agents table may contain bot logic, for instance, an SQL snippet:
CASE
WHEN INSTR(LOWER(CLS.BROWSER),'yandex.com')>0
	THEN 'yandex'
WHEN INSTR(LOWER(CLS.BROWSER),'googlebot')>0
	THEN 'google'
WHEN INSTR(LOWER(CLS.BROWSER),'bingbot')>0
	THEN 'microsoft'
WHEN INSTR(LOWER(CLS.BROWSER),'ahrefsbot')>0
	THEN 'ahrefs'
WHEN INSTR(LOWER(CLS.BROWSER),'mj12bot')>0
	THEN 'majestic-12'
WHEN INSTR(LOWER(CLS.BROWSER),'compatible')>0 OR INSTR(LOWER(CLS.BROWSER),'http')>0
	OR INSTR(LOWER(CLS.BROWSER),'libwww')>0 OR INSTR(LOWER(CLS.BROWSER),'spider')>0
	OR INSTR(LOWER(CLS.BROWSER),'java')>0 OR INSTR(LOWER(CLS.BROWSER),'python')>0
	OR INSTR(LOWER(CLS.BROWSER),'robot')>0 OR INSTR(LOWER(CLS.BROWSER),'curl')>0
	OR INSTR(LOWER(CLS.BROWSER),'wget')>0
	THEN 'other'
ELSE 'n.a.' END AS AGENT_BOT
Aggregate Tables
Finally, we will load the aggregate tables; for example, the daily table might be loaded as follows:
SQL Query for loading aggregates
/* Load fact from access log */
INSERT INTO FCT_ACCESS_USER_AGENT_DD (EVENT_DT, DIM_USER_AGENT_ID, DIM_HTTP_STATUS_ID, PAGE_CNT, FILE_CNT, REQUEST_CNT, LINE_CNT, IP_CNT, BYTES)
WITH STG AS (
SELECT
	STRFTIME( '%s', SUBSTR(TIME_NK,9,4) || '-' ||
	CASE SUBSTR(TIME_NK,5,3)
	WHEN 'Jan' THEN '01' WHEN 'Feb' THEN '02' WHEN 'Mar' THEN '03' WHEN 'Apr' THEN '04' WHEN 'May' THEN '05' WHEN 'Jun' THEN '06'
	WHEN 'Jul' THEN '07' WHEN 'Aug' THEN '08' WHEN 'Sep' THEN '09' WHEN 'Oct' THEN '10' WHEN 'Nov' THEN '11'
	ELSE '12' END || '-' || SUBSTR(TIME_NK,2,2) || ' 00:00:00' ) AS EVENT_DT,
	BROWSER AS USER_AGENT_NK,
	REQUEST_NK,
	IP_NR,
	STATUS,
	LINE_NK,
	BYTES
FROM STG_ACCESS_LOG
)
SELECT
	CAST(STG.EVENT_DT AS INTEGER) AS EVENT_DT,
	USG.DIM_USER_AGENT_ID,
	HST.DIM_HTTP_STATUS_ID,
	COUNT(DISTINCT (CASE WHEN INSTR(STG.REQUEST_NK,'.')=0 THEN STG.REQUEST_NK END) ) AS PAGE_CNT,
	COUNT(DISTINCT (CASE WHEN INSTR(STG.REQUEST_NK,'.')>0 THEN STG.REQUEST_NK END) ) AS FILE_CNT,
	COUNT(DISTINCT STG.REQUEST_NK) AS REQUEST_CNT,
	COUNT(DISTINCT STG.LINE_NK) AS LINE_CNT,
	COUNT(DISTINCT STG.IP_NR) AS IP_CNT,
	SUM(BYTES) AS BYTES
FROM STG,
	DIM_HTTP_STATUS HST,
	DIM_USER_AGENT USG
WHERE STG.STATUS = HST.STATUS_NK
  AND STG.USER_AGENT_NK = USG.USER_AGENT_NK
  AND CAST(STG.EVENT_DT AS INTEGER) > $param_epoch_from /* load epoch date */
  AND CAST(STG.EVENT_DT AS INTEGER) < strftime('%s', date('now', 'start of day'))
GROUP BY STG.EVENT_DT, HST.DIM_HTTP_STATUS_ID, USG.DIM_USER_AGENT_ID
The sqlite database allows for complex queries. WITH contains the preparation of data and keys. The main query gathers all links to the dimensions.
This condition will prevent loading the history again: CAST(STG.EVENT_DT AS INTEGER) > $param_epoch_from, where the parameter is a result of the query
'SELECT COALESCE(MAX(EVENT_DT), '3600') AS LAST_EVENT_EPOCH FROM FCT_ACCESS_USER_AGENT_DD'
This condition will only load a full day: CAST(STG.EVENT_DT AS INTEGER) < strftime('%s', date('now', 'start of day'))
Counting pages or files is done in a primitive way by searching for a point.
Reports
In complex visualization systems, there is a possibility to create a meta-model based on database objects, dynamically manage filters and aggregation rules. Ultimately, all decent tools generate SQL queries.
In this example, we will create ready-made SQL queries and save them as views in the database — these are our reports.
Visualization
Bluff: Beautiful graphs in JavaScript was used as the visualization tool.
To do this, we needed to traverse all reports using PHP and generate an HTML file with tables.
$sqls = array(
'SELECT * FROM RPT_ACCESS_USER_VS_BOT',
'SELECT * FROM RPT_ACCESS_ANNOYING_BOT',
'SELECT * FROM RPT_ACCESS_TOP_HOUR_HIT',
'SELECT * FROM RPT_ACCESS_USER_ACTIVE',
'SELECT * FROM RPT_ACCESS_REQUEST_STATUS',
'SELECT * FROM RPT_ACCESS_TOP_REQUEST_PAGE',
'SELECT * FROM RPT_ACCESS_TOP_REQUEST_REFERRER',
'SELECT * FROM RPT_ACCESS_NEW_REQUEST',
'SELECT * FROM RPT_ACCESS_TOP_REQUEST_SUCCESS',
'SELECT * FROM RPT_ACCESS_TOP_REQUEST_ERROR'
);
The tool simply visualizes the result tables.
Output
In the example of web analysis, the article describes the mechanisms necessary for building data warehouses. As the results show, the simplest tools are sufficient for deep analysis and data visualization.
Later, using this warehouse as an example, we will try to implement structures such as slowly changing dimensions, metadata, levels of aggregation, and data integration from various sources.
We will also take a closer look at a simple tool for managing ETL processes based on a single table.
Let’s return to the topic of measuring data quality and automating this process.
We will study the problems of the technical environment and the maintenance of data warehouses, for which we will implement a storage server with minimal resources, for example, based on a Raspberry Pi.
Source: habr.com
