

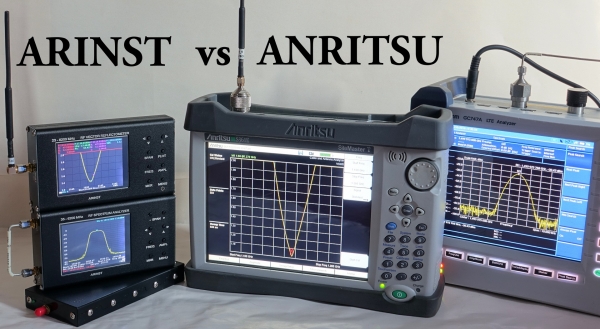
A pair of devices from the Russian developer 'Kroks' has arrived for independent testing and review. These are quite compact radio frequency meters, namely: a spectrum analyzer with a built-in signal generator, and a vector network analyzer (reflectometer). Both devices have a frequency range of up to 6.2 GHz.
There is an interest in understanding whether these are yet another set of pocket 'indicators' (toys), or truly noteworthy devices, as the manufacturer positions them: - 'The device is intended for amateur radio use, as it is not a professional measuring instrument.'
Attention readers! These tests were conducted in an amateur capacity and do not claim to be metrological studies of measuring instruments based on state registry standards and other related matters. Amateur radio enthusiasts are interested in comparative measurements of devices commonly used in practice (antennas, filters, attenuators), rather than the theoretical 'abstractions' associated with metrology, for example: mismatched loads, inhomogeneous transmission lines, or sections of short-circuited lines, which were not utilized in this test.
To avoid the influence of interference during comparative antenna measurements, aanechoic chamber or open space is required. Due to the absence of the former, measurements were conducted outdoors, with all antennas having directional radiation patterns 'looking' at the sky, secured on a tripod without spatial displacement when switching devices.
A phase-stable coaxial cable of measurement class, Anritsu 15NNF50-1.5C, and N-SMA adapters from well-known companies: Midwest Microwave, Amphenol, Pasternack, and Narda were used in the tests.
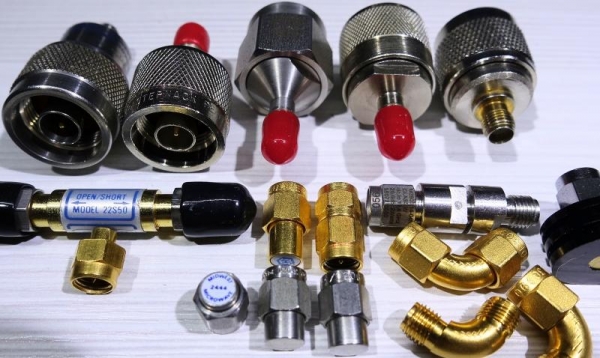
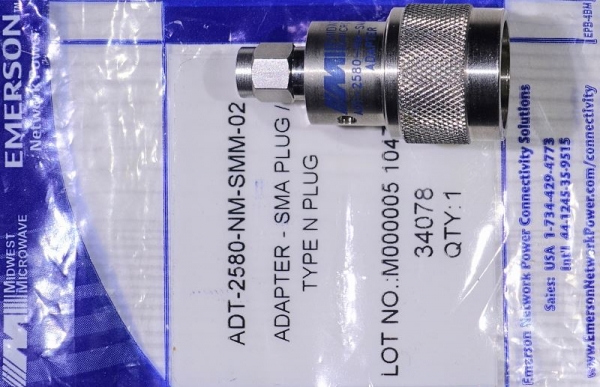
Cheap adapters of Chinese manufacture were not used, due to frequent issues with contact reproducibility during reconnections, as well as the peeling of the non-durable anti-oxidation coating, which they use instead of standard gold plating...
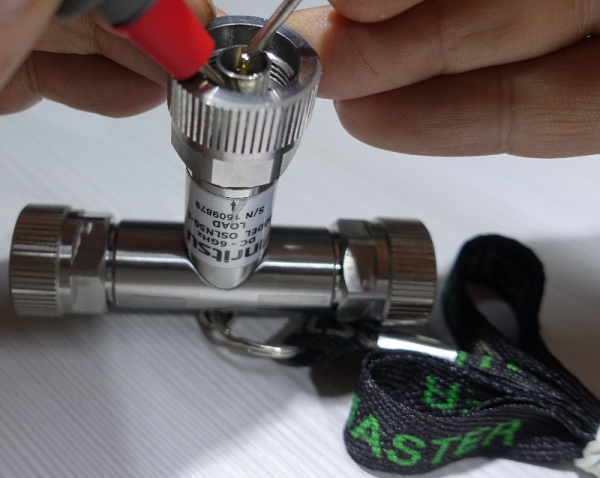
To ensure equal comparative conditions, all instruments were calibrated with the same set of OSL calibrators before each measurement, across the same frequency band and current temperature range. OSL stands for 'Open', 'Short', 'Load', which are the standard set of calibration measures: 'open circuit', 'short circuit', and 'matched load of 50.0 ohms', typically used to calibrate vector network analyzers. The Anritsu 22S50 calibration set was used for the SMA format, standardized in the frequency range from DC to 26.5 GHz, with a reference to the datasheet (49 pages):
For the calibration of the N-type format, the Anritsu OSLN50-1 was used, standardized from DC to 6 GHz.
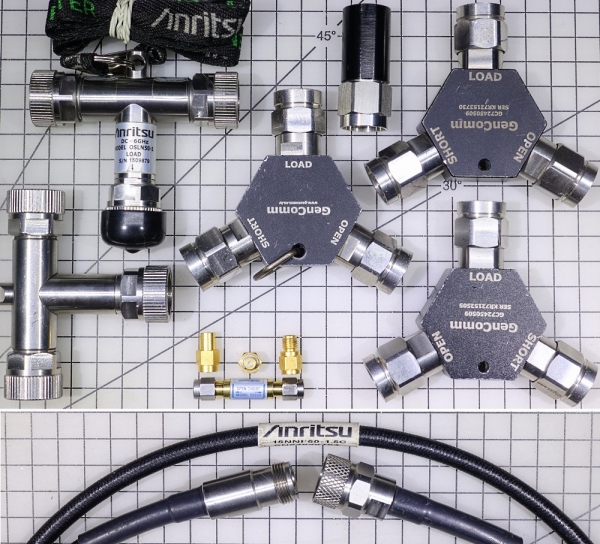
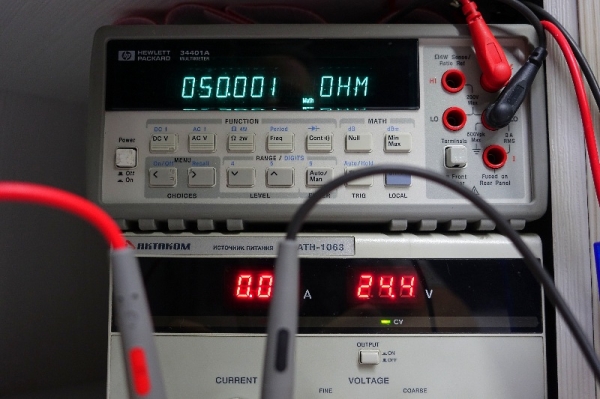
The measured resistance at the matched load of the calibrators was 50 ±0.02 ohms. Measurements were carried out with calibrated, precision laboratory-grade multimeters from HP and Fluke.
To ensure the best accuracy and the most consistent conditions in comparative tests, similar IF filter passband was set on the instruments, as the narrower this passband, the higher the measurement accuracy and signal-to-noise ratio. The highest number of scanning points was also selected (close to 1000).
For a comprehensive overview of all the functions of the examined reflectometer, a link to the illustrated factory manual is available:
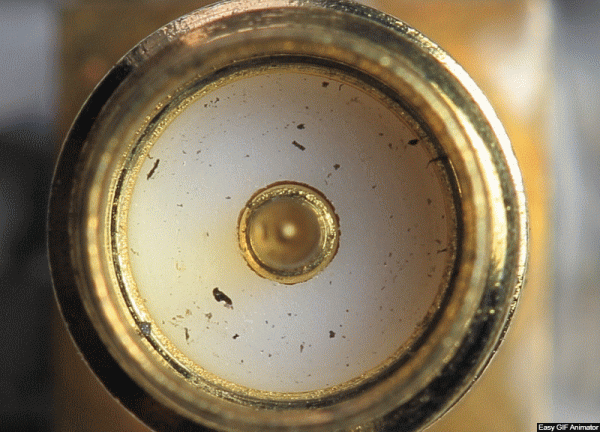
Before each measurement, all mating surfaces in coaxial connectors (SMA, RP-SMA, N type) were carefully checked, as at frequencies above 2-3 GHz, the cleanliness and condition of the anti-oxidation surface of these contacts begin to noticeably influence the measurement results and their repeatability stability. It is very important to keep the outer surface of the center pin in the coaxial connector clean, as well as the corresponding inner surface of the socket on the mating half. The same applies to the 'braided' contact. Such inspection and necessary cleaning are usually performed under a microscope or under a high magnification lens.
It is also important to prevent the presence of shedding metal shavings on the surfaces of the insulators in the mating coaxial connectors, as they begin to introduce parasitic capacitance, significantly interfering with performance and signal transmission.
Example of typical metallized contamination of SMA connectors, not visible to the eye:
According to the factory requirements of microwave coaxial connector manufacturers with threaded connection types, the central contact of the incoming connector must NOT rotate in the receiving sleeve during connection. It is necessary to hold the axial base of the screw-on half of the connector, allowing only the nut to rotate, not the entire screw-on assembly. This significantly reduces scratching and other mechanical wear on the mating surfaces, ensuring better contact and prolonging the number of switching cycles.
Unfortunately, few enthusiasts are aware of this, and most screw the entire assembly, scraping the already thin layer of the contact surfaces each time. This is consistently evidenced by numerous videos on YouTube from so-called 'tester-reviewers' of new microwave equipment.
In this test review, all numerous connections of coaxial connectors and calibrators were carried out strictly in accordance with the aforementioned operational requirements.
In comparative tests, several different antennas were measured to verify the readings of the reflectometer in various frequency ranges.
Comparison of a 7-element Yagi antenna in the 433 MHz range (LPD)
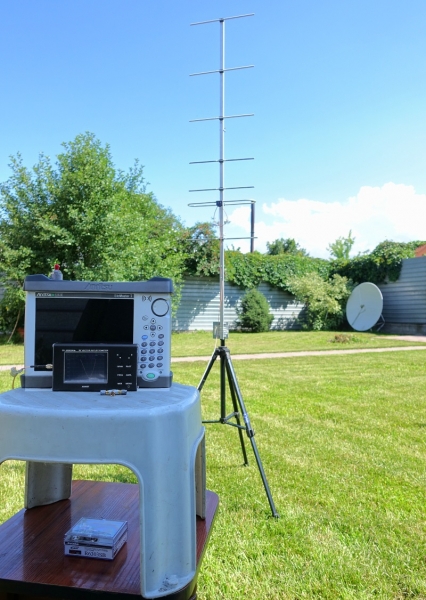
Since antennas of this type always have a quite pronounced rear lobe as well as several side lobes, all surrounding conditions of immobility were particularly observed for the purity of the test, even to the extent of locking the cat indoors. This was to ensure that when photographing different modes on displays, it did not inadvertently come within the influence of the rear lobe, thereby disturbing the graph.
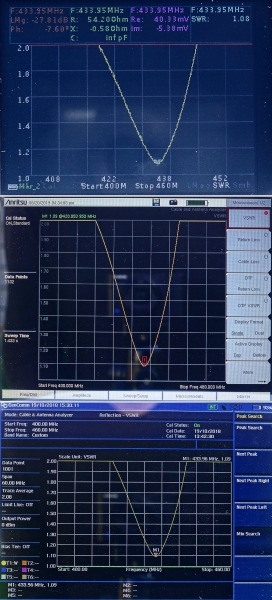
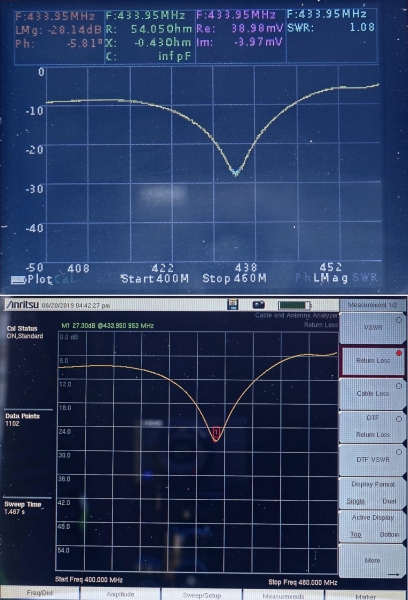
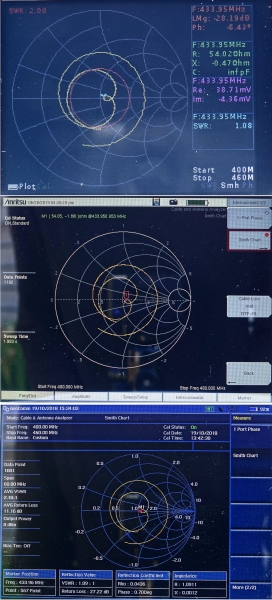
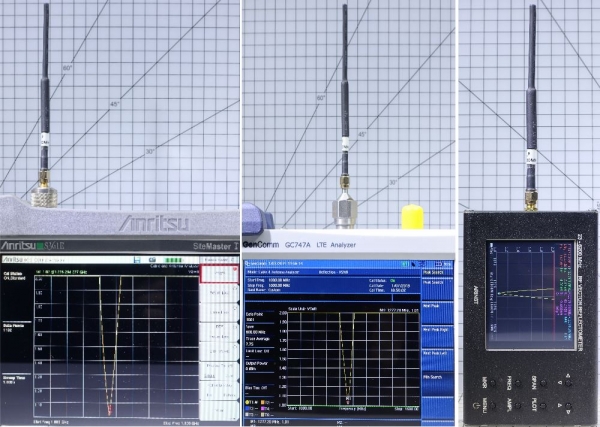
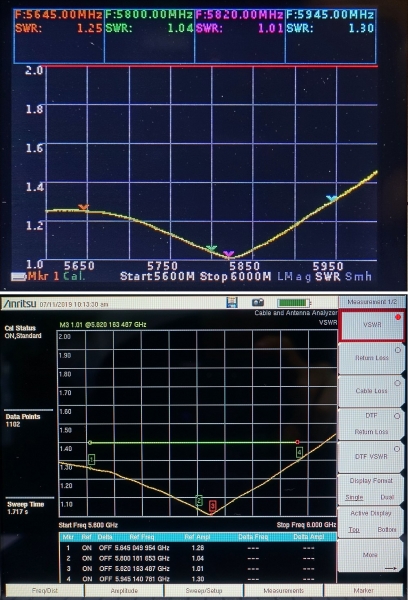
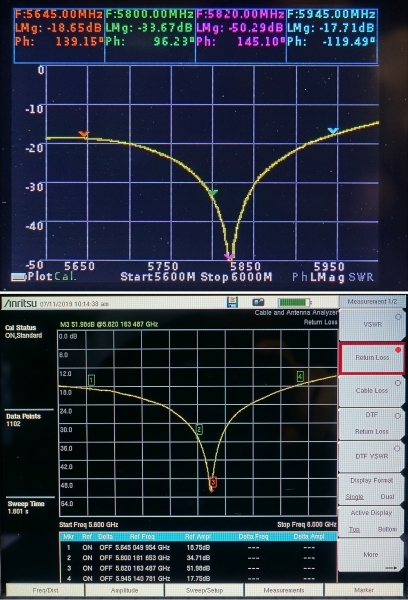
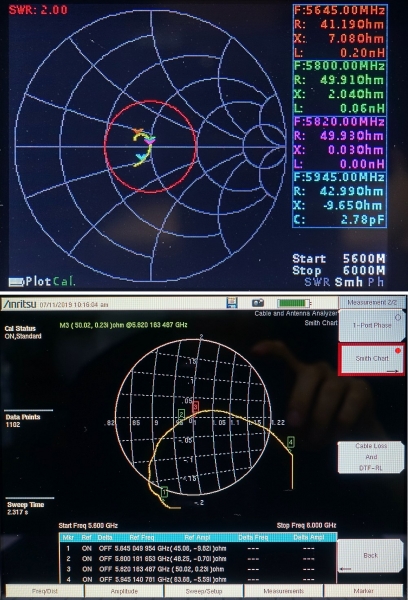
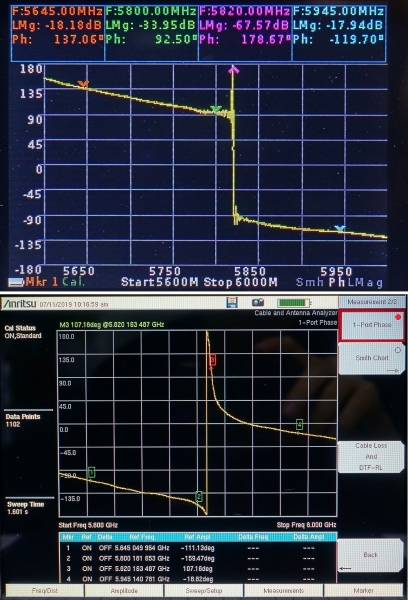
The images collected show photos from three devices, with 4 modes from each.
The top image is from the subject VR 23-6200, the middle one from Anritsu S361E, and the bottom one from GenCom 747A.
SWR curves:
Reflected loss curves:
Wolpert-Smith complete impedance diagram curves:
Phase curves:
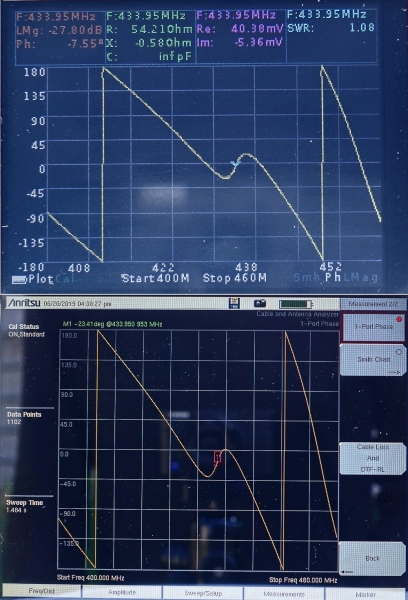
As seen, the resulting curves are very similar, and the measurement values have a scatter within 0.1% error.
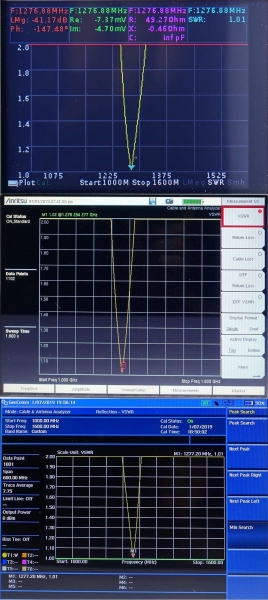
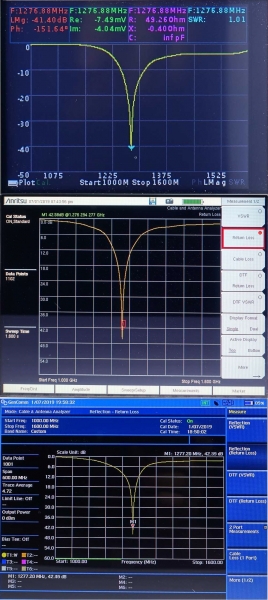
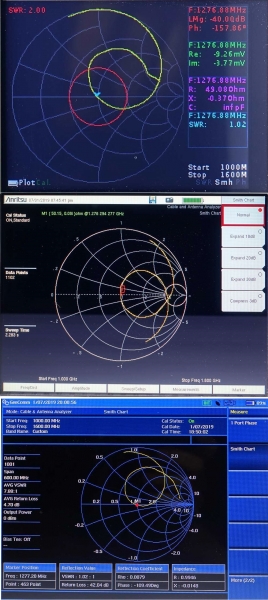
Comparison of a coaxial dipole in the 1.2 GHz range
SWR:
Return losses:
Wolpert-Smith diagram:
Phase:
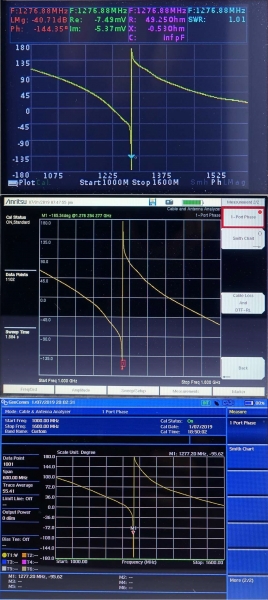
Here too, all three devices measured the resonance frequency of this antenna within a range of 0.07%.
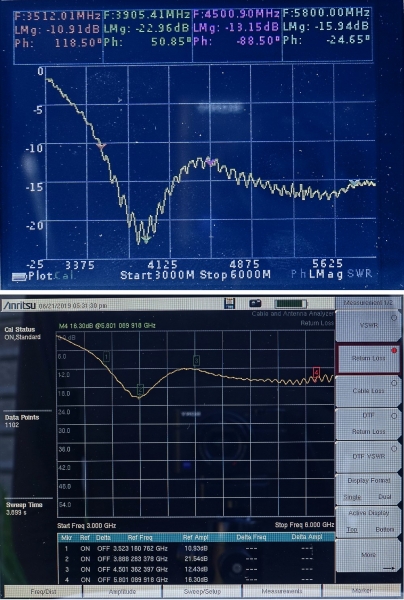
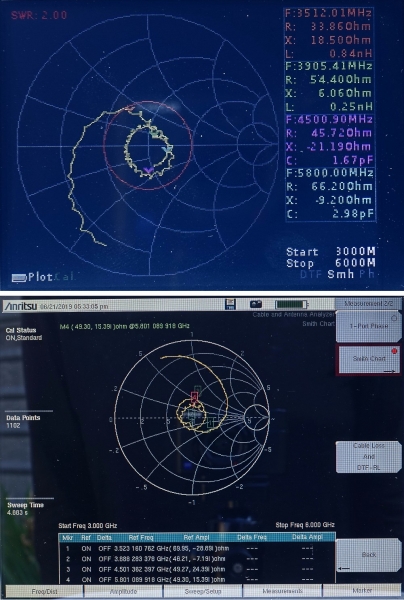
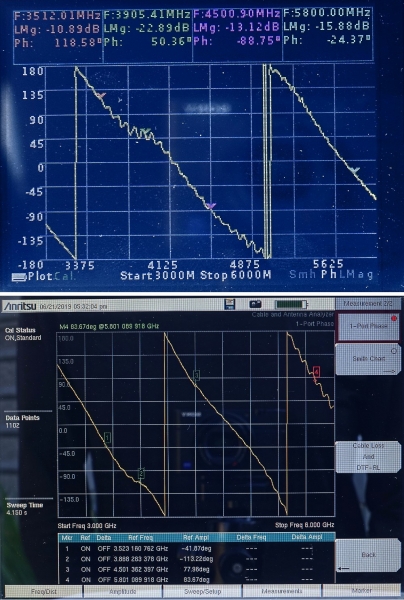
Comparison of the horn antenna in the 3-6 GHz range
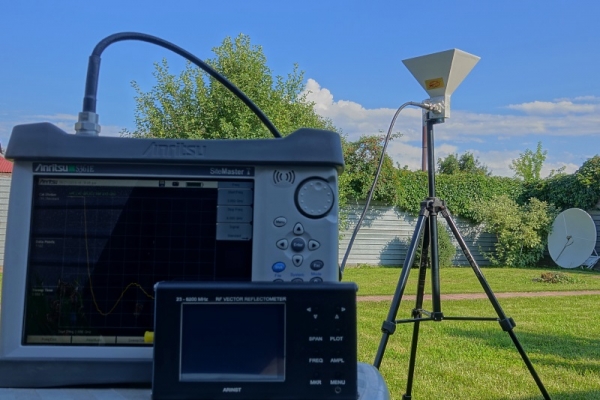
An extension cable with N-type connectors was used here, which introduced some irregularity in the measurements. However, since the goal was simply to compare the devices, rather than the cables or antennas, any potential issue in the path should be reflected by the devices as they are.
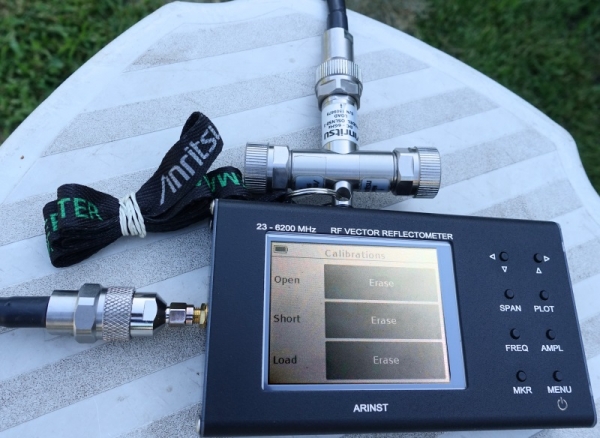
Calibration of the measurement (reference) plane taking into account the adapter and feeder:
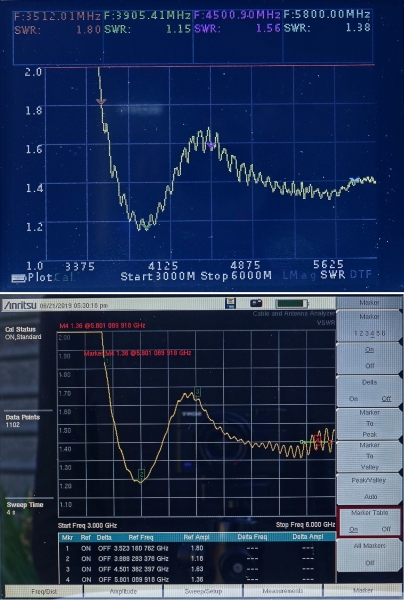
VSWR in the band from 3 to 6 GHz:
Return losses:
Wolpert-Smith diagram:
Phase graphs:
Comparison of the circular polarization antenna in the 5.8 GHz range
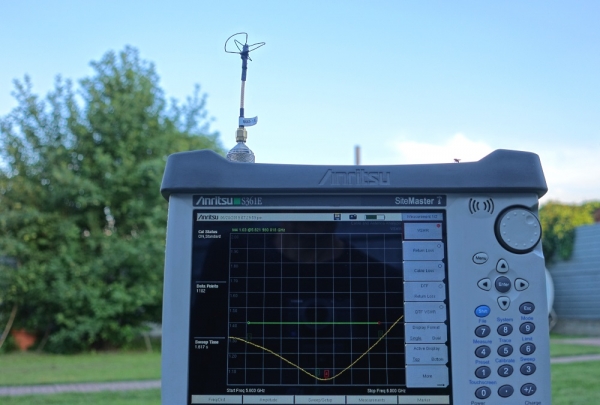
SWR:
Return losses:
Wolpert-Smith diagram:
Phase:
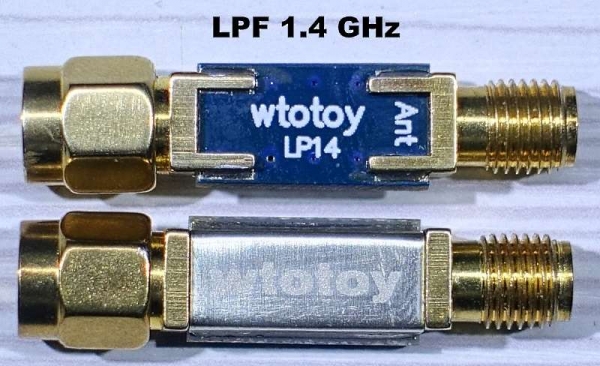
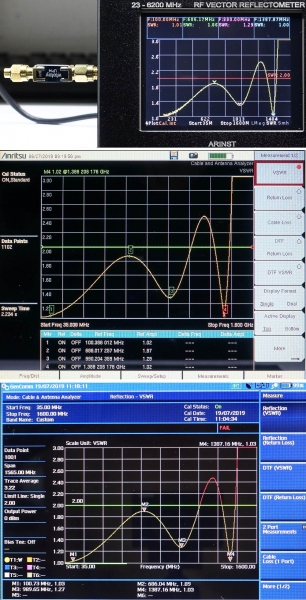
Comparative measurement of the VSWR of the Chinese LPF filter at 1.4 GHz
Appearance of the filter:
SWR curves:
Comparative measurement of the feeder length (DTF)
I decided to measure a new coaxial cable with N-type connectors:
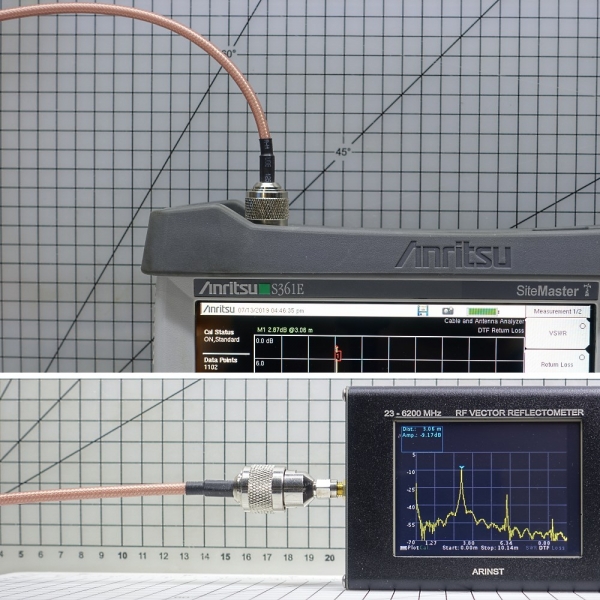
With a two-meter tape measure in three tries, I measured 3 meters and 5 centimeters.
Here’s what the devices showed:
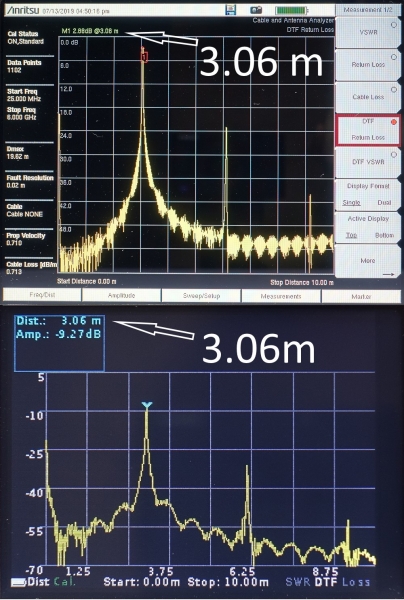
As they say, comments are unnecessary here.
Comparison of the accuracy of the built-in tracking generator
In this GIF image, 10 photographs of the readings from the frequency counter Ch3-54 are compiled. The upper halves of the images show the readings of the tested VR 23-6200. The lower halves display the signals fed from the Anritsu reflectometer. Five frequencies were selected for testing: 23, 50, 100, 150, and 200 MHz. If Anritsu fed the frequency with zeros in the lower digits, the compact VR provided slightly above it, with the numerical excess increasing with frequency.
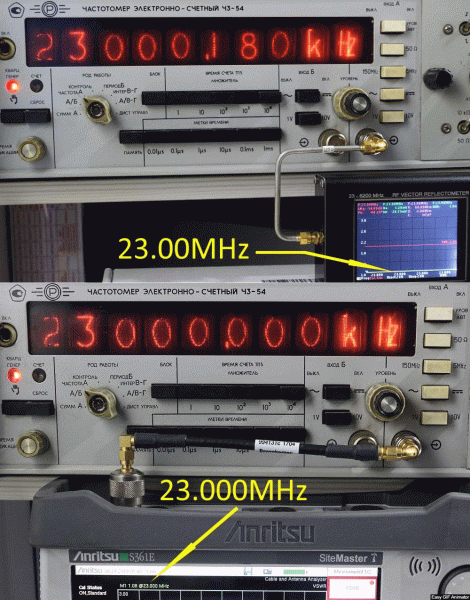
Although according to the manufacturer’s specifications, this cannot be considered a 'minus' as it does not exceed the stated two digits after the decimal point.
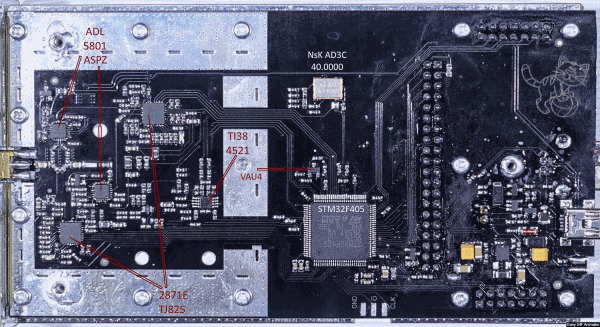
Images compiled into a GIF about the internal 'layout' of the device:
Pros:
The advantages of the VR 23-6200 device include its low cost, portable compactness with full autonomy, which does not require an external display from a computer or smartphone, as well as a fairly wide frequency range shown in the labeling. Additionally, it is worth noting that this is not a scalar, but a fully vector measuring device. As seen from comparative measurement results, VR practically does not lag behind larger, well-known, and quite expensive devices. In any case, accessing the roof (or mast) to check the condition of feeders and antennas is preferable with this little gadget rather than with a larger and heavier device. And for the now fashionable 5.8GHz range for FPV racing (radio-controlled flying multirotors and airplanes with onboard video transmission to goggles or displays), it is a must-have. It allows for easy selection of the optimal antenna from spares during flights or even straightening and tuning the antenna, crumpled after a racing drone crash. The device can be considered
There are also some downsides noted:
1) The biggest operational drawback of the reflectometer is the inability to quickly find markers for minimum or maximum on the graph, not to mention the search for “delta” or the auto-search for subsequent (or previous) minima/maxima.
This is particularly often required in LMag and SWR modes, as there is a significant lack of such marker control functionality. It is necessary to activate the marker in the corresponding menu and then manually move the marker to the minimum of the curve to calculate the frequency and value of the SWR at that point. Perhaps the manufacturer will add this feature in future firmware updates.
1 a) The device also cannot reassign the required display mode for markers when switching between measurement modes.
For example, if I switch from the VSWR mode to LMag (Return Loss), the markers still display the VSWR value, whereas they should logically show the reflection coefficient magnitude in dB, that is, what is currently shown by the selected graph.
The same applies in all other modes. To read the values corresponding to the selected graph in the marker table, it is necessary each time to manually reassign the display mode for each of the 4 markers. It may seem like a small detail, but a bit of automation would be appreciated.
1 b) In the most demanded VSWR measurement mode, the amplitude scale cannot be switched to a more detailed setting below 2.0 (for example, 1.5 or 1.3).
2) There is a small peculiarity in the inconsistent calibration process. It is always 'open' or 'parallel' calibration. That is, there isn't a sequential ability to record the measured reading from the calibrator, as is typical with other VNA devices. Usually, in calibration mode, the device sequentially prompts which specific calibration measure to set and read for recording.
On the ARINST, there is the simultaneous option to select all three recording button presses, which places a higher demand for attention on the operator during the calibration phase. Although I have never become confused, there is a slight chance of making a mistake by pressing a button that does not correspond to the currently connected calibrator end.
In possible future firmware upgrades, the developers might change this open 'parallel' selection to 'sequential' to eliminate potential operator errors. After all, large devices use a clear sequence in actions with calibration measures specifically to avoid such confusion.
3) Very narrow temperature calibration range. If Anritsu offers a range (for example) from +18°C to +48°C after calibration, then Arinst only allows ±3°C from the calibration temperature, which may be insufficient during fieldwork (outdoors), in the sun, or in the shade.
For example: if you calibrated after lunch and worked with measurements until the evening, the sun set, the temperature dropped, and the readings became incorrect.
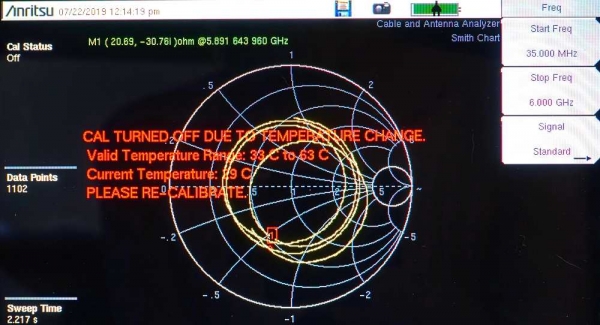
For some reason, the stop message does not pop up, stating - "recalibrate due to exceeding the temperature range of the previous calibration." Instead, erroneous measurements begin with a shifted zero, significantly affecting the measurement results.
In comparison, here's how this is reported by the Anritsu reflectometer:
4) The display is normal for indoor use, but very dim for open areas.
On a sunny day, it is completely unreadable outside, even when shading the screen with a hand.
Brightness adjustment for the display is not provided at all.
5) I want to re-solder the hardware buttons as some do not respond to presses immediately.
6) The touchscreen is unresponsive in some areas and overly sensitive in others.
Conclusions on the VR 23-6200 reflectometer
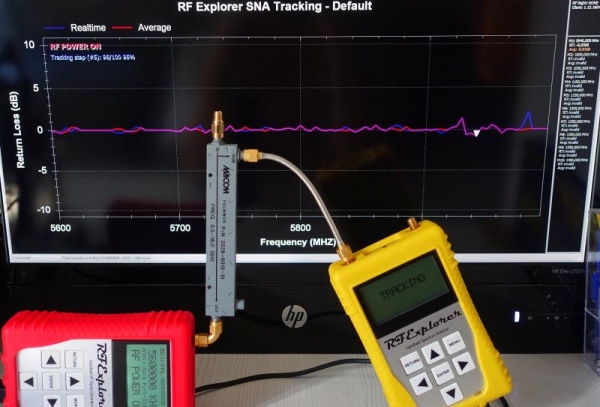
If we overlook the downsides, compared to other budget, portable, and freely available solutions on the market, such as RF Explorer, N1201SA, KC901V, RigExpert, SURECOM SW-102, NanoVNA — this Arinst VR 23-6200 appears to be the most successful choice. The others either have prices that are not very budget-friendly, are limited in frequency bands making them not universal, or are essentially toy-type measuring devices. Despite its modesty and relatively low price, the vector reflectometer VR 23-6200 turns out to be surprisingly decent, and quite portable. If the manufacturers could address the downsides and slightly extend the lower frequency range for shortwave radio enthusiasts, this device would take a podium position among all global budget devices of this type, offering an accessible price range from "KВ to эФПэВэ" (i.e., from 2 MHz on HF (160 meters) to 5.8 GHz for FPV (5 centimeters)). Ideally, it should also be gapless across the entire range, unlike the RF Explorer:
Undoubtedly, even cheaper solutions in such a wide frequency range are likely to emerge soon, which would be excellent! But for now (June-July 2019), in my humble opinion, this reflectometer is the best in the world among portable and inexpensive, serially available options.
— Part Two
Spectrum analyzer with tracking generator SSA-TG R2
The second device is no less interesting than the vector reflectometer.
It allows for the measurement of the 'through' parameters of various microwave devices in a 2-port measurement mode (type S21). For example, it can check the functionality and accurately measure the gain of boosters, amplifiers, or the signal attenuation (loss) in attenuators, filters, coaxial cables (feeders), and other active and passive devices and modules, which cannot be achieved with a single-port reflectometer.
This is a full-fledged spectrum analyzer with a very wide and continuous frequency range, which is not often found among inexpensive amateur equipment. In addition, there is a built-in tracking generator for radiofrequency signals, also across a wide range. This is also a useful complement to the reflectometer and antenna meter. It allows you to check for any carrier frequency deviations in transmitters, parasitic intermodulation, clipping, and more...
With a tracking generator and spectrum analyzer, adding an external directional coupler (or bridge) makes it possible to measure the same SWR of antennas, although only in scalar measurement mode, without considering the phase, as would be done in a vector format.
Link to the factory manual:
This device was mainly compared with the combined measurement complex GenCom 747A, with an upper frequency limit of 4 GHz. The tests also included the new precision class power meter Anritsu MA24106A, which has factory-calibrated correction tables for the measured frequency and temperature, normalized to 6 GHz.
The own noise floor of the spectrum analyzer, with a matched 'terminator' at the input:
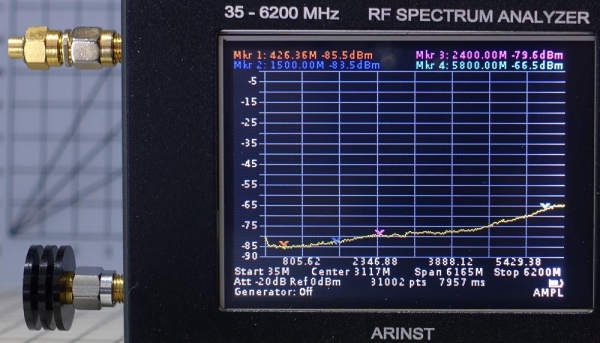
Minimum -85.5 dB, was found around LPD (426 MHz).
Further, as the frequency increases, the noise threshold slightly rises, which is quite natural:
1500 MHz — 83.5 dB. 2400 MHz — 79.6 dB. At 5800 MHz — 66.5 dB.
Measurement of the gain of an active Wi-Fi booster based on the XQ-02A module.
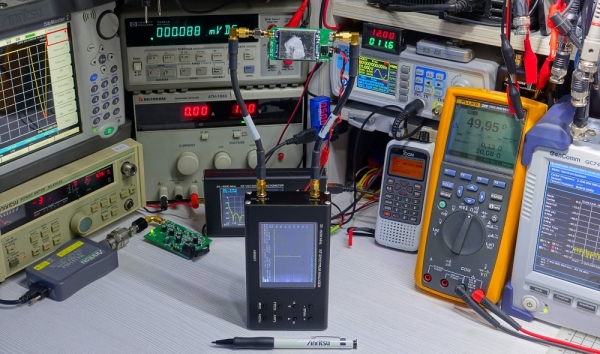
A distinctive feature of this booster is its automatic activation, which does not immediately keep the amplifier on when power is supplied. By experimenting with attenuators on a large device, we were able to determine the activation threshold of the built-in automation. It turned out that the booster switches to an active state and starts amplifying the passing signal only if it is greater than minus 4 dBm (0.4 mW):
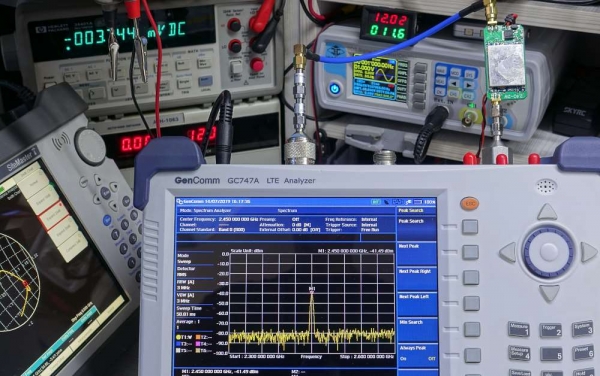
For this test, the small device simply lacked the output level of the built-in generator, which has a documented adjustment range, from minus 15 to minus 25 dBm. But here, minus 4 was required, significantly greater than minus 15. Yes, an external amplifier could have been used, but that wasn't the goal.
Using the large device, I measured the gain of the powered-on booster, which turned out to be 11 dB, in accordance with the specifications.
With the small device, I was able to determine the attenuation level of the powered-off booster while power was supplied. It turned out that the unpowered booster attenuated the passing signal to the antenna by 12,000 times. For this reason, once while flying and forgetting to supply power to the external booster, the long-range hexacopter, after flying 60-70 meters, stopped and switched to auto-return to the launch point. Then, it became necessary to find out the passing attenuation of the powered-off amplifier. It turned out to be about 41-42 dB.
Noise generator 1-3500 MHz
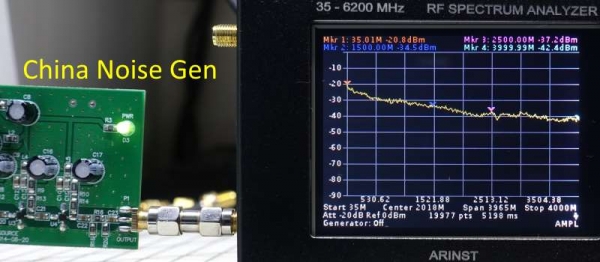
A simple noise generator of amateur class, made in China.
Linear comparison of readings in dB is somewhat inappropriate here due to the constant change of amplitude at different frequencies, caused by the very nature of the noise.
Nevertheless, both devices were able to produce very similar comparative frequency response graphs:
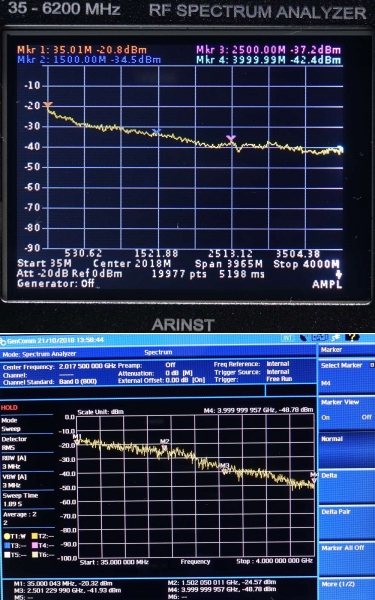
Here, the frequency range on the devices was set equal, from 35 to 4000 MHz.
And in terms of amplitude, it is evident that quite similar values were also obtained.
Passband frequency response (measurement S21) of the LPF 1.4 filter
This filter was mentioned in the first part of the review. But there, its SWR was measured, and here the transmission frequency response is shown, where it is clearly visible what and with what attenuation it passes, as well as where and how much it cuts.
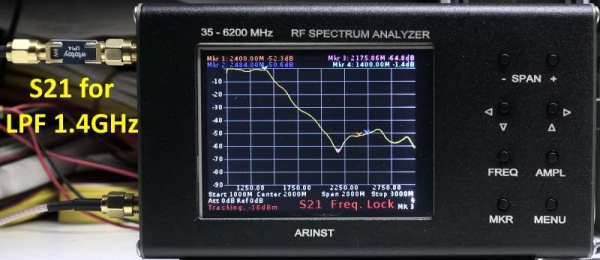
Here it is more clearly visible that both devices measured the frequency response of this filter almost the same:
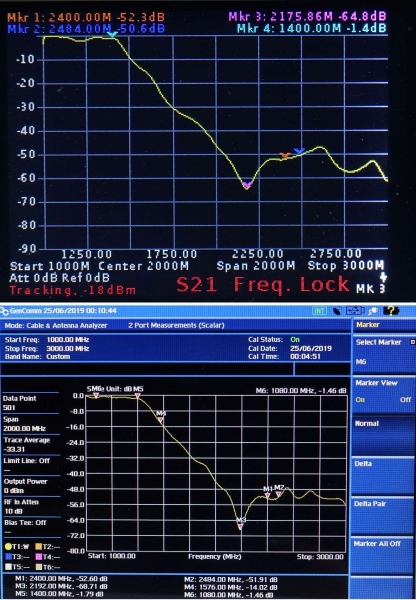
At the beginning of the cut-off frequency of 1400 MHz, Arinst showed an amplitude of minus 1.4 dB (blue marker Mkr 4), while GenCom showed minus 1.79 dB (marker M5).
Measurement of Attenuator Loss
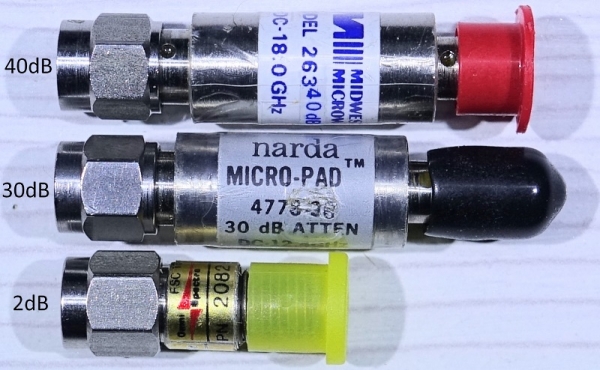
For comparative measurements, I chose the most accurate, branded attenuators. Specifically, not Chinese ones, due to their considerable variance.
The frequency range remains the same, from 35 to 4000 MHz. Calibration of the dual port measurement mode was conducted with strict attention, including mandatory monitoring of the cleanliness of all contact surfaces on the interfaced coaxial connectors.
Calibration result at 0 dB level:
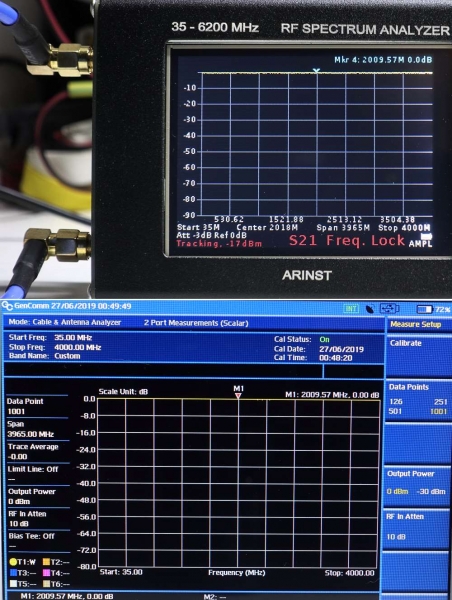
The sampling frequency was set at the midpoint of the specified band, namely 2009.57 MHz. The number of scanning points was also equal, at 1000+1.
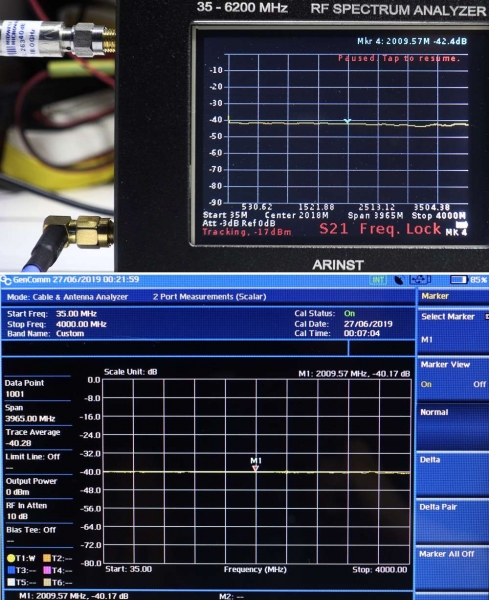
As can be seen, the measurement result of the same attenuator at 40 dB, although close, does not exactly match. Arinst SSA-TG R2 showed 42.4 dB, while GenCom showed 40.17 dB, under otherwise equal conditions.
30 dB Attenuator
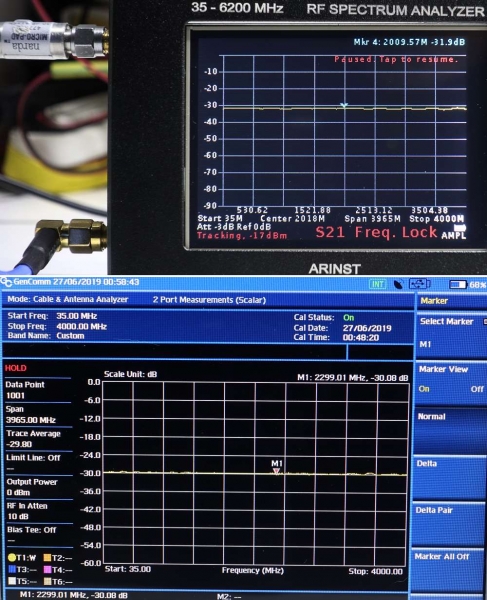
Arinst = 31.9 dB
GenCom = 30.08 dB
A similarly slight variance in percentage was also observed when measuring other attenuators. However, to save the reader's time and space in the article, they were not included in this review as they are similar to the measurements presented above.
Min and Max Trace
Despite the portability and simplicity of the device, manufacturers have added such a useful feature as displaying accumulated minimums and maximums of changing traces, which is often needed during various settings.
Three snapshots compiled into a gif image, using an example of an LPF filter in the 5.8 GHz range, into which connection disturbances were intentionally introduced:
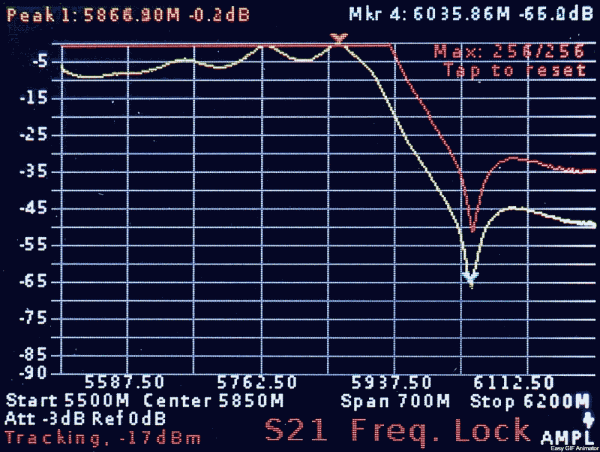
Yellow trace — the current curve of the extreme sweep.
Red trace — stored maximums from previous sweeps.
Dark green trace (appearing gray after processing and compressing the images) — accordingly, the minima of the frequency response.
Measuring VSWR of Antennas
As mentioned at the beginning of the review, this device has the ability to connect an external directional coupler (Direct coupler), or a measuring bridge offered separately (but only up to 2.7 GHz). The software allows for OSL calibration to provide the device with a reference point for VSWR.
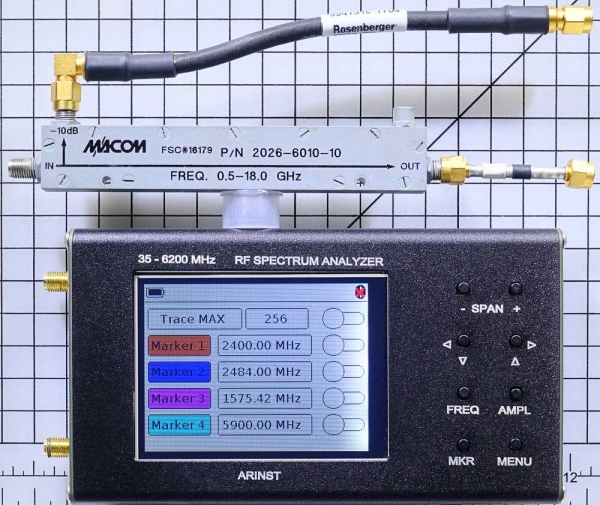
Here is a directional splitter with phase-stable measuring feeders, but it has already been disconnected from the device after completing the measurements of the VSWR. However, it is shown in an expanded position here, so please disregard the inconsistency with the apparent connection. The directional splitter connects on the left to the device, but in an inverted marking back view. Thus, the input of the incident wave from the generator (top port) and the reflected signal taken at the input of the analyzer (bottom port) will be correct.
The combined two photographs show an example of such a connection and the measurement of the VSWR from the previously measured circularly polarized antenna type 'Clever', operating in the 5.8 GHz range.
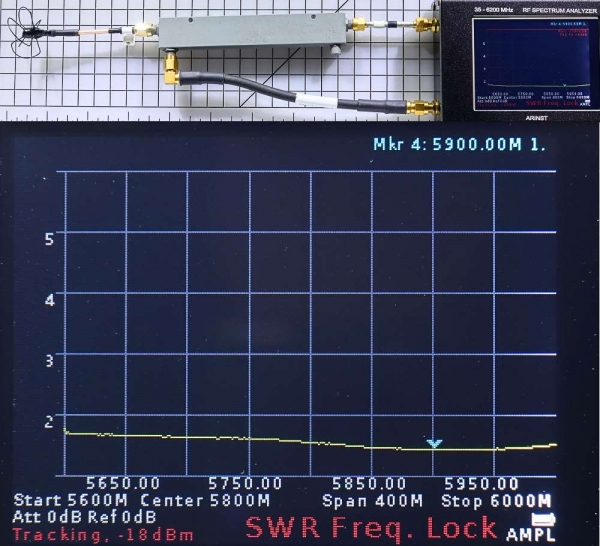
Although such a capability to measure VSWR is not among the primary purposes of this device, there are still reasonable questions about it (as seen in the screenshot of the display). The fixed and unchangeable scale for displaying the VSWR graph has a large maximum value of 6 units. Although the graph approximately shows the correct VSWR curve of this antenna, the numerical value at the marker does not display the exact reading, omitting tenths and hundredths. Only whole numbers, such as 1, 2, 3... are shown. This leaves a sense of incompleteness in the measurement result.
Even though rough estimates to generally understand whether the antenna is functional or damaged are quite acceptable. However, fine-tuning when working with the antenna will be more challenging, although still entirely possible.
Accuracy measurement of the built-in generator
Just like with the reflectometer, the specifications only claim 2 digits of accuracy after the decimal point.
It is indeed naive to expect a budget handheld device to include a rubidium frequency standard. *smiley face*
Nevertheless, a curious reader will certainly be interested in the degree of error of such a miniature generator. However, since the calibrated precision frequency meter was only available up to 250 MHz, the investigation was limited to four frequencies at the lower end of the range, simply to understand the trend of the error if any was detected. It should be noted that even at higher frequencies, photographs from another device were also prepared. But for the sake of space in the article, they were not included in this overview, due to confirming numerically the same percentage error present in the lower digits.
Four photographs at four frequencies were compiled into a gif image, also for the sake of space: 50.00; 100.00; 150.00; and 200.00 MHz.
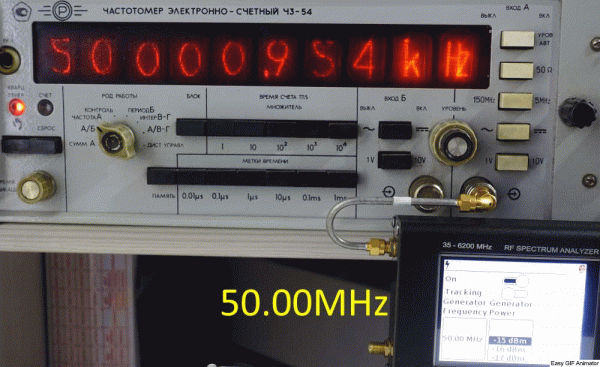
The trend and magnitude of the existing error are clearly visible:
At 50.00 MHz, there is a slight excess in the generator frequency, specifically by 954 Hz.
At 100.00 MHz, it is slightly more, +1.79 kHz.
At 150.00 MHz, even more, +1.97 kHz.
At 200.00 MHz, +3.78 kHz.
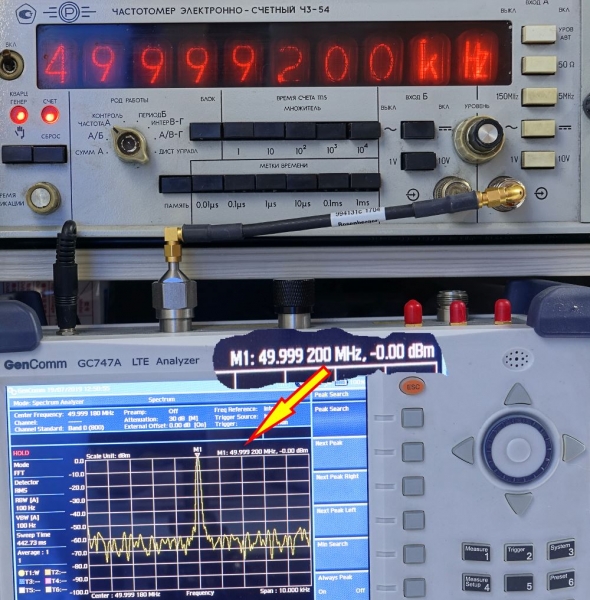
Next, at the upper end, the frequency was measured by the GenCom analyzer, which had a good frequency meter. For example, if the built-in generator in GenCom was under by 800 Hz at 50.00 MHz, not only did the external frequency meter show this, but the spectrum analyzer measured exactly the same:
Next is one of the display photographs, with the measured frequency of the built-in generator in the SSA-TG R2, for the middle of the Wi-Fi range at 2450 MHz:
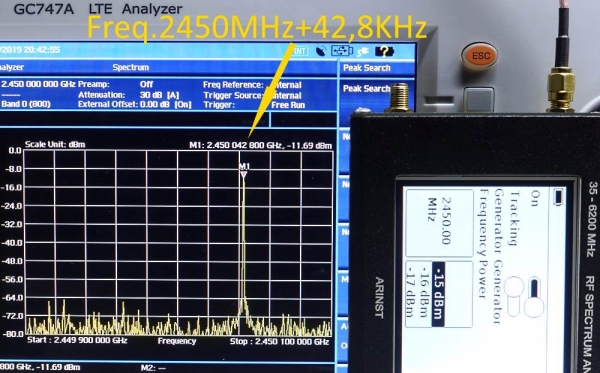
To save space in the article, I also did not include the other similar display photographs; instead, here’s a brief summary of the measurement results for ranges above 200 MHz:
At a frequency of 433.00 MHz, the excess was +7.92 kHz.
At a frequency of 1200.00 MHz, = +22.4 kHz.
At a frequency of 2450.00 MHz, = +42.8 kHz (in the previous photo).
At a frequency of 3999.50 MHz, = +71.6 kHz.
However, the two decimal places claimed in the factory specifications are strictly maintained across all ranges.
Comparison of signal amplitude measurement.
In the following gif image, six photographs are compiled, where the Arinst SSA-TG R2 analyzer measures its own generator at six arbitrarily chosen frequencies.
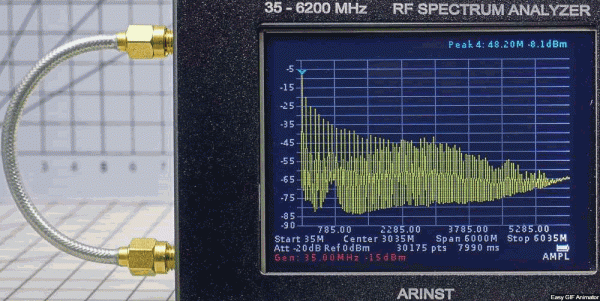
50 MHz -8.1 dBm; 200 MHz -9.0 dBm; 1000 MHz -9.6 dBm;
2500 MHz -9.1 dBm; 3999 MHz — 5.1 dBm; 5800 MHz -9.1 dBm.
Although the maximum amplitude of the generator is stated to be no higher than minus 15 dBm, the actual values reveal otherwise.
To identify the reasons for such amplitude indication, measurements were conducted using the Arinst SSA-TG R2 generator with the precision sensor Anritsu MA24106A, with calibration reset to a matched load before beginning measurements. Each time, a frequency value was entered for measurement accuracy considering the coefficients according to the factory-provided correction table for frequency and temperature.
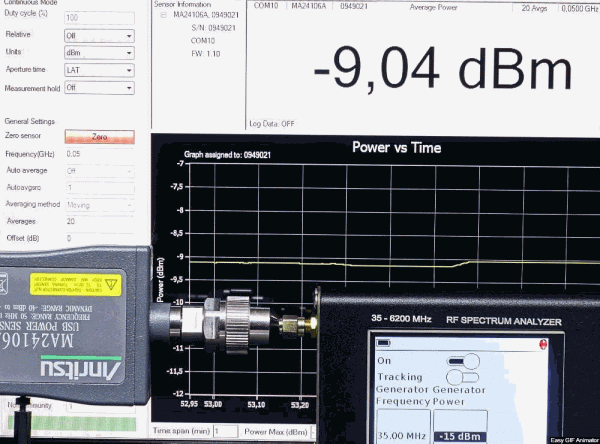
35 MHz -9.04 dBm; 200 MHz -9.12 dBm; 1000 MHz -9.06 dBm;
2500 MHz -8.96 dBm; 3999 MHz -7.48 dBm; 5800 MHz -7.02 dBm
As can be seen, the amplitude values of the signal output by the built-in generator in the SSA-TG R2 are measured quite satisfactorily (for amateur precision class). The amplitude indicated at the bottom of the device's display appears to be simply 'drawn,' as it actually outputs a higher level than it should within the adjustable range of -15 to -25 dBm.
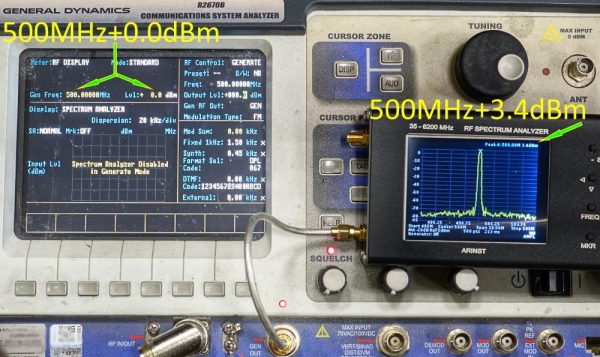
Having some doubt, wondering if the new sensor Anritsu MA24106A was somehow skewed, I specifically conducted a comparison with another laboratory system analyzer from General Dynamics, model R2670B.
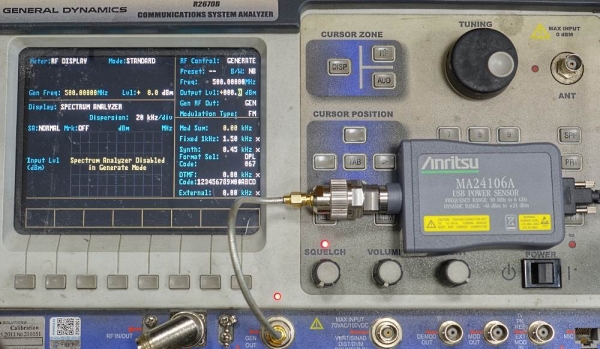
But no, the discrepancy in amplitude turned out to be quite small, within 0.3 dBm.
The power meter on GenCom 747A also showed a slight overreading of the generator's output level:
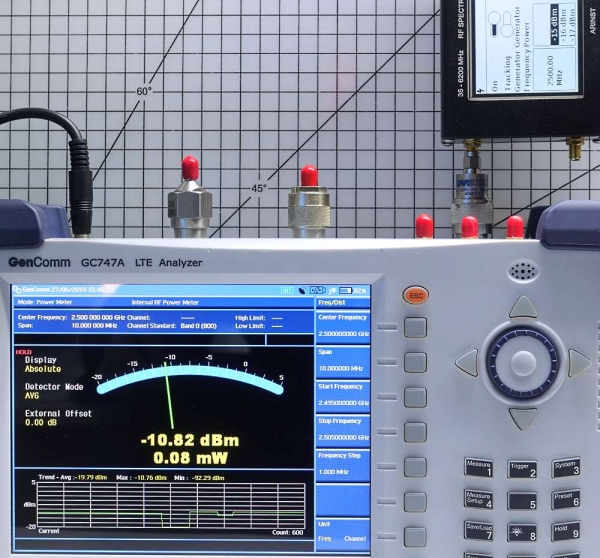
However, at the level of 0 dBm, the Arinst SSA-TG R2 analyzer strangely exceeded the amplitude readings, coming from different signal sources at 0 dBm.
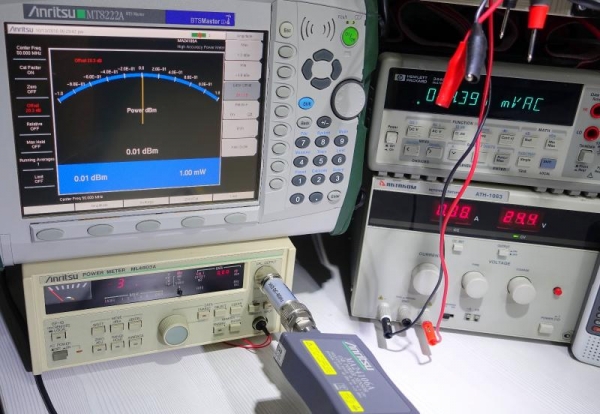
At the same time, the sensor Anritsu MA24106A shows 0.01 dBm from the Anritsu ML4803A calibrator.
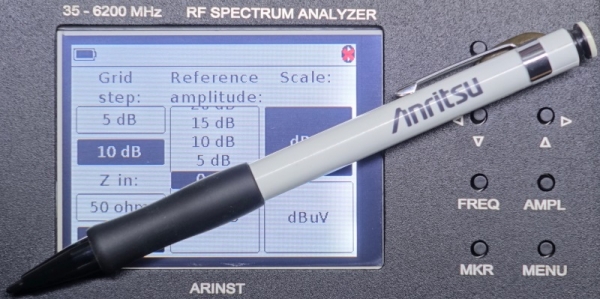
Adjusting the attenuation level using the touchscreen with a finger seemed somewhat inconvenient, as the list scrolls past or often returns to the extreme value. It turned out to be easier and more accurate to use an old-fashioned stylus for this:
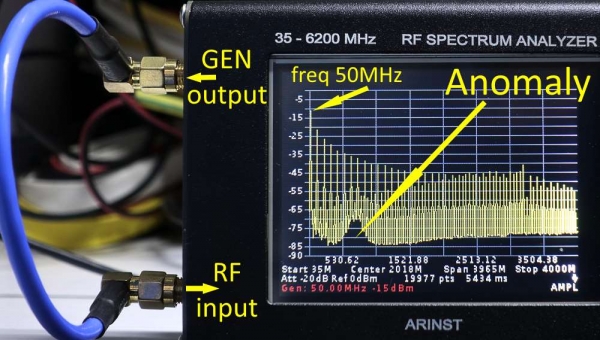
When viewing harmonics of the low-frequency signal at 50 MHz, almost across the entire operating range of the analyzer (up to 4 GHz), a certain 'anomaly' was encountered at frequencies around 760 MHz:
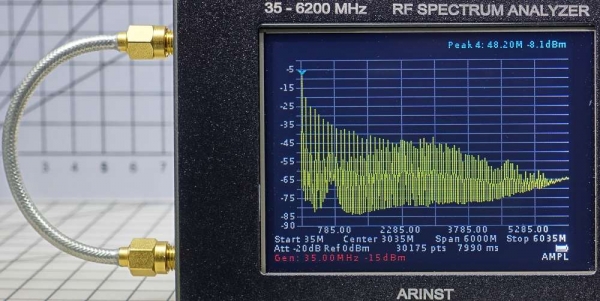
With a wider upper frequency range (up to 6035 MHz), to achieve a Span of exactly 6000 MHz, the anomaly is also noticeable:
At the same time, this same signal from the built-in generator in the SSA-TG R2, when fed to another device, does not exhibit such an anomaly:
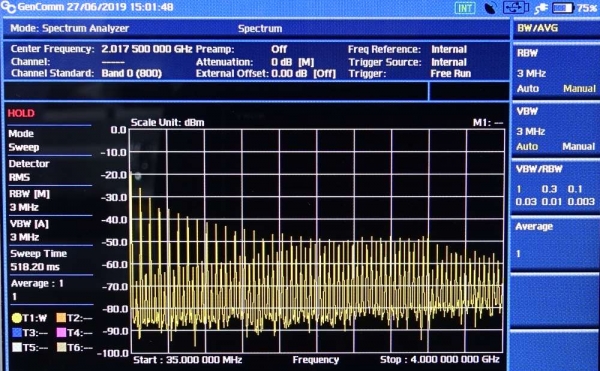
Since this anomaly was not observed on another analyzer, it means the problem is not with the generator, but with the spectrum analyzer.
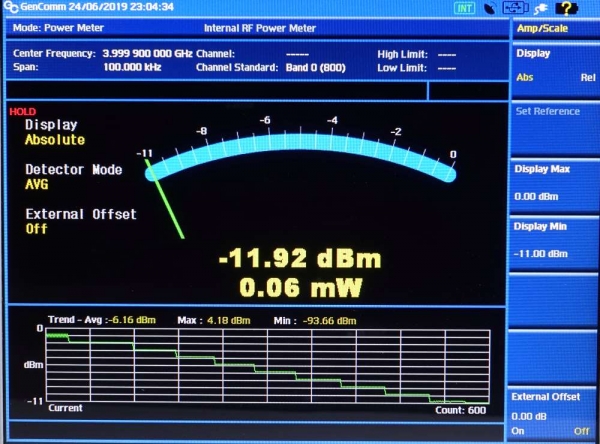
The built-in attenuator of the generator clearly reduces amplitude in steps of 1 dB across all 10 levels. The stepped track on the timeline at the bottom of the screen indicates the attenuator's functionality:
Keeping the generator's output port connected to the analyzer's input port, I turned off the device. The next day, upon turning it on again, I discovered a signal with normal harmonics at an interesting frequency of 777.00 MHz:
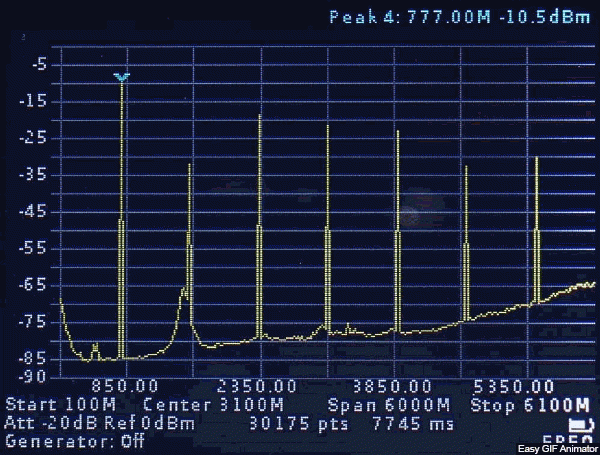
The generator was left powered off. Checking the menu, it indeed was turned off. Ideally, there shouldn't have been any output from the generator if it had been turned off the day before. I had to turn it on to any frequency in the generator's menu and then immediately turn it off again. After this action, the strange frequency disappeared and did not reappear until the next time the device was powered on. Surely, the manufacturer will fix this self-activation issue in a future firmware update for the output of a powered-off generator. If the cable between the ports is absent, it's completely unnoticeable that something is wrong, except for a slightly higher noise floor. After forcibly turning the generator on and off, the noise floor decreases slightly but to a negligible amount. This is a minor operational drawback that takes an extra 3 seconds to resolve after turning on the device.
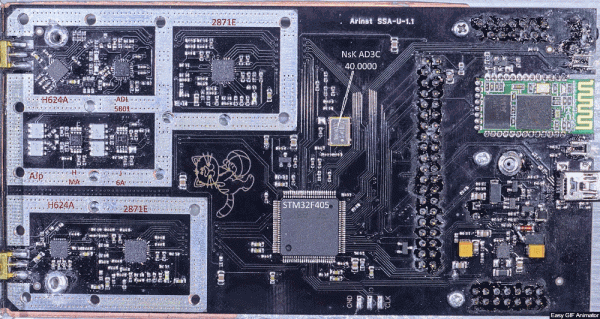
The internal layout of the Arinst SSA-TG R2 is shown in three photos compiled into a GIF:
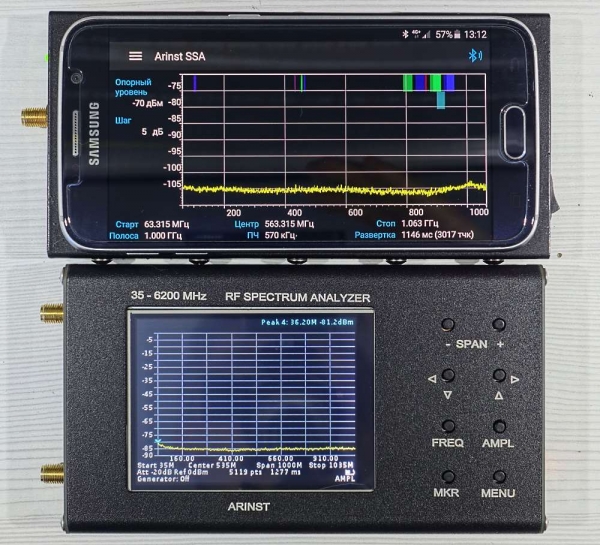
Size comparison with the old Arinst SSA Pro spectrum analyzer, with a smartphone placed on top as a display:
Pros:
Similar to the previous reviewed reflectometer Arinst VR 23-6200, the analyzer Arinst SSA-TG R2 is in exactly the same form factor and dimensions—miniature yet a serious tool for radio amateurs. It also does not require external displays, whether on a computer or smartphone, like previous SSA models.
A very wide, continuous frequency range from 35 to 6200 MHz.
I did not investigate the exact runtime, but the capacity of the built-in lithium battery is sufficient for prolonged operation.
A quite insignificant measurement error for such a miniature-class device. In any case, for amateur use, it is more than adequate.
Supported by the manufacturer, both through firmware updates and physical repairs, if necessary. Now widely available for purchase, meaning it's not made to order as sometimes happens with other manufacturers.
Disadvantages have also been noted:
Unaccounted for and undocumented, spontaneous output from the signal generator at a frequency of 777.00 MHz. This misunderstanding will likely be resolved with the next firmware update. However, if you are aware of this peculiarity, it can easily be fixed in three seconds by simply turning the built-in generator off and on.
You need a little time to get used to the touchscreen, as not all virtual buttons activate immediately when you slide them. But if you don't slide the sliders and tap directly in the final position, everything works clearly right away. This is more of a 'feature' of the graphical controls rather than a disadvantage, especially in the generator menu and the attenuator control slider.
When connecting via Bluetooth, the analyzer seems to connect successfully to the smartphone, but the frequency response graph does not display, unlike the aging SSA Pro. All instructions were fully followed during the connection, as described in section 8 of the factory instructions.
It occurred to me that since the password is accepted and a confirmation of connection is displayed on the smartphone screen, this function might only be for upgrading the firmware via the smartphone.
But no.
Section 8.2.6 states clearly:
8.2.6. The device will connect to the tablet/smartphone, displaying a signal spectrum graph and an informational message on the screen stating ConnectedtoARINST_SSA, as shown in figure 28. (c)
Yes, a confirmation appears, but there is no track.
I reconnected multiple times, and each time the track did not appear. But with the old SSA Pro, it connected instantly.
Another downside regarding the so-called 'universality' is that due to the limitation on the lower edge of the operating frequencies, they are not suitable for shortwave radio enthusiasts. However, for RC FPV, they fully satisfy the demands of hobbyists and professionals alike, even abundantly.
Conclusions:
Overall, both instruments left a very positive impression, as they essentially provide a complete measuring complex, at least even for advanced amateur radio enthusiasts. The pricing policy is not discussed here, but nevertheless, it is noticeably lower than other closest analogs on the market in such a wide and continuous frequency range, which is certainly pleasing.
The aim of the review was simply to compare these devices with more advanced measuring equipment and provide readers with photo-documented readings from the displays, to form their own opinion and make an independent decision about the possibility of purchase. There were no advertising goals pursued whatsoever. Only an external assessment and publication of the observed results.
Source: habr.com
