


In the world of SRE/DevOps engineers, it’s not surprising when a client (or monitoring system) reports that "everything is lost": the site is down, payments are not going through, life is bleak... As much as we want to help in such situations, it can be very difficult to do so without a simple and clear tool. Often, the problem is hidden in the application code itself — we just need to localize it.
In sorrow and in joy…
It so happened that we have long loved New Relic. It has been and continues to be an excellent tool for monitoring application performance, as well as allowing instrumentation of microservice architecture (with its agent) and much more. Everything would be great if it weren’t for the changes in the service's pricing policy: its cost Additionally, since last year, obtaining a trial account requires communication with a personal manager, which complicates the presentation of the product to a potential client.A common situation: New Relic is not needed on a "permanent basis"; it’s only remembered when problems start. But regular payments are still required (140 USD per server per month), and in an automatically scaling cloud infrastructure, these amounts can add up significantly. Although there is a "Pay-As-You-Go" option, starting New Relic requires restarting the application, which can lead to losing the problematic situation that initiated the process. Not long ago, New Relic introduced a new pricing plan —
Essentials Key Transactions Cross Application Tracing, Distributed Tracing, As a result, we began to think about finding a cheaper alternative, and our choice fell on two services: Datadog and Atatus. Why exactly them?).
On competitors
Let me clarify that there are other solutions available in the market. We even considered Open Source options, but not every client has spare resources to host self-hosted solutions... — moreover, they require additional maintenance. The pair we selected turned out to be the closest to
our needs. our needs:
- Built-in and advanced support for PHP applications (our clients have a very diverse stack, but this is a clear leader in the context of seeking alternatives to New Relic);
- Affordable pricing (less than 100 USD per month per host);
- Automatic instrumentation;
- Integration with Kubernetes;
- Similarity to the New Relic interface — a notable advantage (since our engineers are accustomed to it).
Therefore, during the initial selection phase, we eliminated several other popular solutions, specifically:
- Tideways, AppDynamics, and Dynatrace — due to their cost;
- Stackify — blocked in Russia and provides too little data.
The following article is structured in such a way that the discussed solutions will be briefly presented first, after which I will share our typical interaction with New Relic as well as experiences/impressions from performing similar operations in other services.
Presentation of selected competitors
About , probably, has been heard by everyone? This service began its development over 10 years ago, in 2008. We have been actively using it since 2012 and have not faced integration issues with a truly large number of applications in PHP, Ruby, and Python, and we also have experience integrating with C# and Go. The service authors have solutions for application monitoring, infrastructure monitoring, microservices infrastructure tracing, user-friendly applications for user devices, and much more.
However, the New Relic agent operates on proprietary protocols and does not support OpenTracing. For extended instrumentation, modifications specifically for New Relic are required. Finally, Kubernetes support is still in an experimental status.
Launched its development in 2010, is significantly more interesting than New Relic, especially regarding usage in Kubernetes environments. In particular, it supports integration with NGINX Ingress, log collection, statsd, and OpenTracing protocols, allowing tracking of user requests from connection to completion, as well as finding logs related to those requests (both on the web server side and on the consumer side).
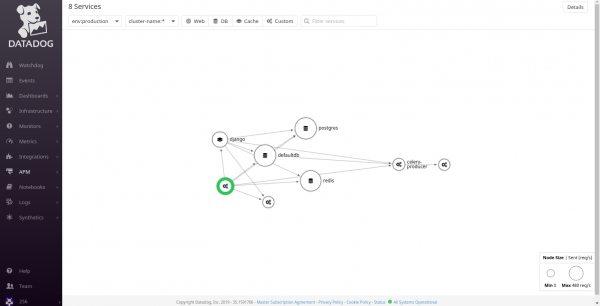
While using Datadog, we encountered issues where it sometimes incorrectly built the microservice map and had certain technical shortcomings. For example, it misidentified the service type (perceived Django as a caching service) and triggered 500 errors in a PHP application that used the popular Predis library.

is the youngest tool; the service was launched in 2014. Its marketing budget clearly pales in comparison to the mentioned competitors, and mentions are significantly less frequent. Nevertheless, the tool itself is very similar to New Relic, not only in capabilities (APM, Browser monitoring, etc.) but also in appearance.
A significant drawback is the support for only Node.js and PHP. On the other hand, it is implemented noticeably better than Datadog. Unlike the latter, Atatus does not require additional application modifications and tagging in the code.
How We Work with New Relic
Now let's figure out how we generally use New Relic. Suppose we have a problem that needs to be solved:
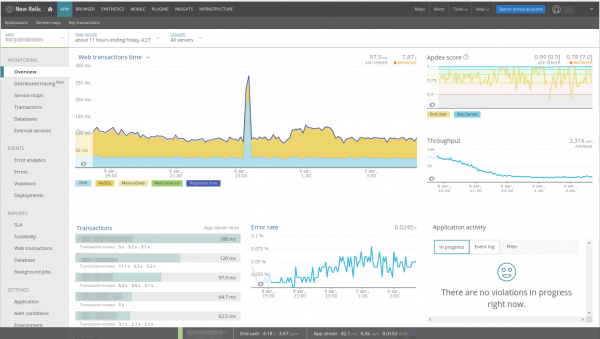
It's easy to spot a spike — let's analyze it. In New Relic for the web application, web transactions are immediately selected, the performance graph shows all components, and there are panels for error rate, request rate… The main thing is that from these panels, you can move between different parts of the application (for example, clicking on MySQL will take you to the database section).
Since in this example we see a spike in activity PHP, let's click on this graph and automatically go to Transactions:
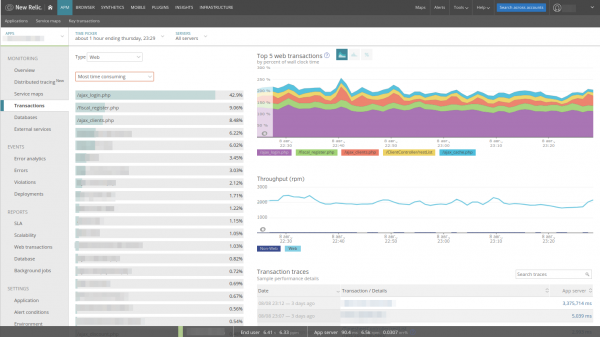
The list of transactions, which essentially serves as the controllers from the MVC model, is already sorted by Most time consuming, which is very convenient: we immediately see what the application is doing. Here, there are also examples of long requests automatically collected by New Relic. By switching the sort order, it's easy to find:
- the most burdened application controller;
- the most frequently requested controller;
- the slowest controller.
Additionally, you can expand each transaction and see what the application was doing at the moment of executing the code:
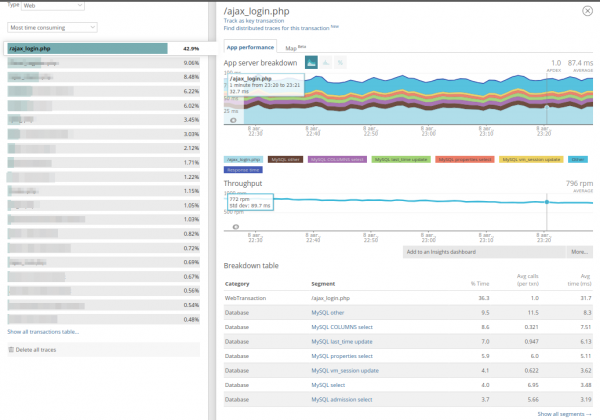
Finally, the application stores samples of trace logs for long requests (which take more than 2 seconds). Here is the panel for a long transaction:
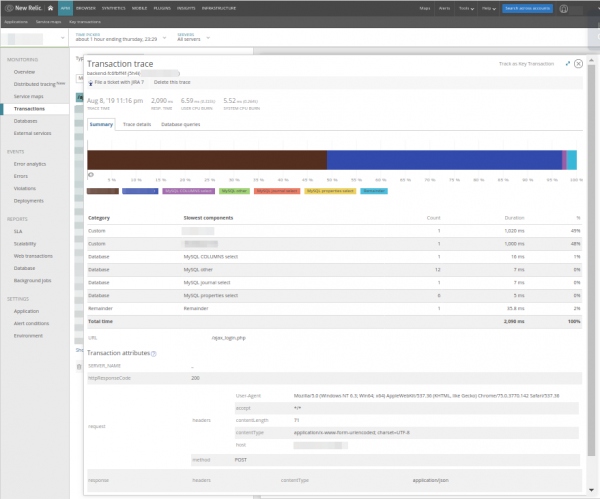
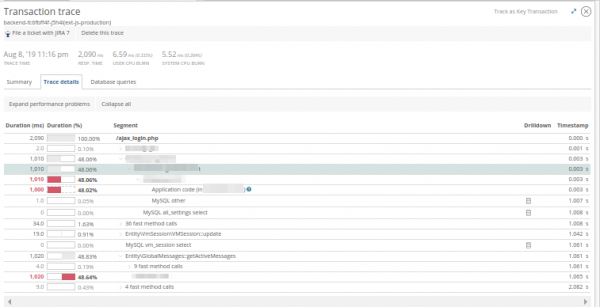
It is clear that two methods take a lot of time, and it also displays the time when the request was executed, its URI, and domain. This often helps to find the request in the logs. Going to Trace details, you can see where these methods are called from:
And in Database queries — evaluate the database queries that were executed while the application was running:
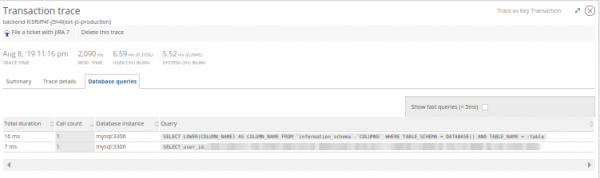
Equipped with this knowledge, we can assess the cause of the application's slowdown and develop a resolution strategy together with the developer. In reality, New Relic doesn’t always provide a clear picture; however, it helps to select the investigation direction:
- long
PDO::Constructled us to the strange functioning of pgpoll; - instability over time
Memcache::Gethinted at an incorrect virtual machine configuration; - the suspiciously increased template processing time led to a nested loop checking for the presence of 500 avatars in the object storage;
- and so on…
Sometimes, instead of executing code on the main screen, something related to external data storage appears — and it doesn’t matter whether it’s Redis or PostgreSQL — they all hide in the tab Databases.
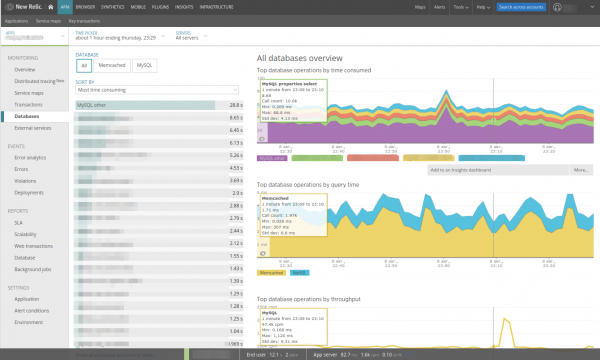
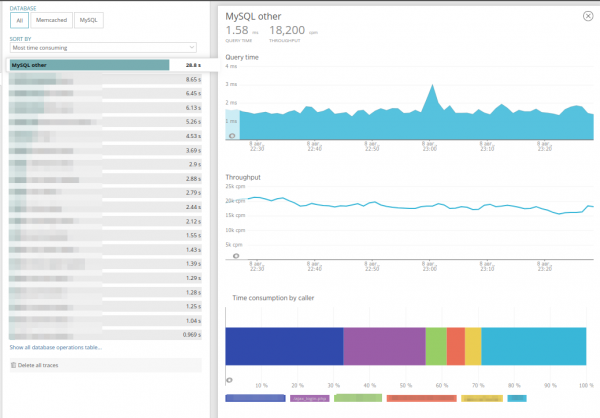
You can select a specific database for investigation and sort the queries, similar to how it is done in Transactions. By switching to the query tab, you can see how often this query appears in each of the application’s controllers as well as assess how frequently it is called. This is very convenient:
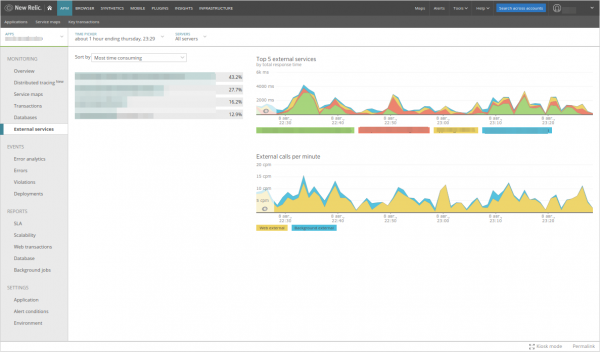
The same data is contained in the tab External Services, which conceals requests to external HTTP services, such as accessing object storage, sending events to Sentry, or similar. The content of this tab is completely analogous to Databases:
Competitors: Features and Impressions
Now for the interesting part — let’s compare New Relic’s capabilities with what competitors offer. Unfortunately, we couldn’t test all three tools on one version of a production application. Nevertheless, we tried to compare as identical situations/configurations as possible.
1. Datadog
Datadog greets us with a dashboard featuring a service wall:
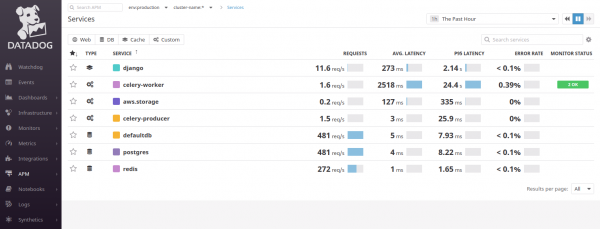
It attempts to break applications down into components/microservices, so in the provided example of the Django application, we’ll see 2 connections to PostgreSQL (defaultdb and postgres), as well as Celery and Redis. Working with Datadog requires minimal understanding of MVC principles: you need to know where user requests actually come to. Usually, this is aided by a service map:
By the way, there’s something similar in New Relic:
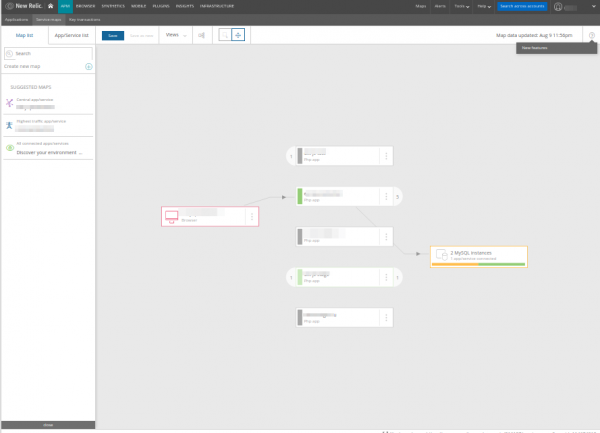
... in my opinion, their map is simpler and clearer: it displays not the components of a single application (which would make it overly detailed, as in the case of Datadog), but only specific services or microservices.
Returning to Datadog: from the service map, it's clear that user requests are coming into Django. Let's move to the Django service and finally see what we expected:
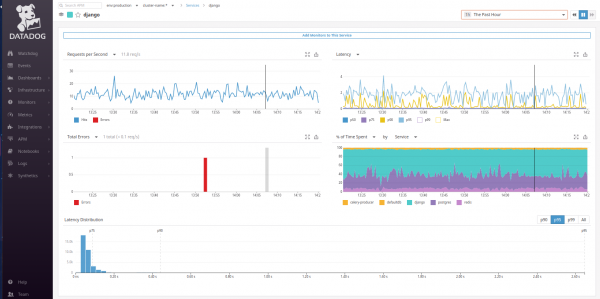
Unfortunately, by default, there's no graph here Web transaction time, similar to what we see on the main dashboard of New Relic. However, it can be configured in place of the graph % of Time spent. It's enough to switch it to Avg time per request by Type... and now a familiar graph is looking back at us!
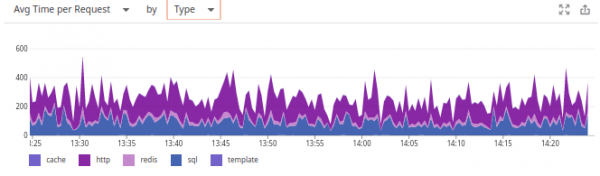
Why Datadog preferred a different graph is a mystery to us. We were also disappointed that the system does not remember the user's choice (unlike both competitors), thus—only creating custom dashboards can save the day.
However, we were pleased with the ability in Datadog to move from these graphs to metrics of related servers, read logs, and assess the load on the web server handlers (Gunicorn). It's almost like New Relic... and even a bit more (logs)!
Below the graphs are transactions, fully analogous to New Relic:
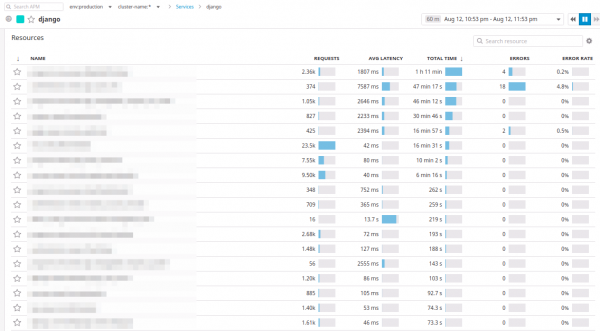
In Datadog, transactions are called resources. Controllers can be sorted by the number of requests, average response time, and maximum time spent over a selected period.
A resource can be expanded to reveal everything we've already observed in New Relic:
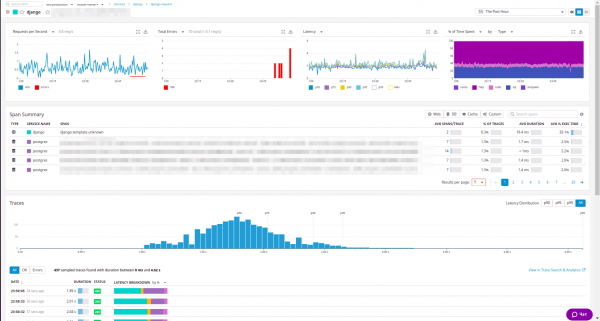
Both resource statistics and a summary list of internal calls are available, along with request examples that can be sorted by response code... By the way, our engineers really liked this sorting.
Any resource example in Datadog can be opened and examined:
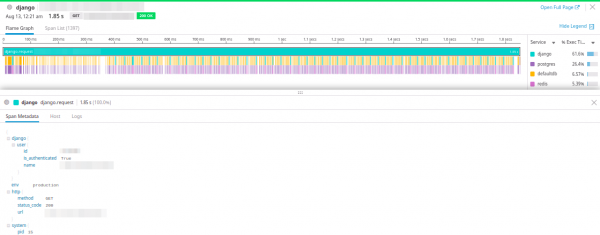
It presents request parameters, a summary chart of time spent on each component, and a waterfall chart showing the sequence of calls. There's also the option to switch to a tree view of the waterfall chart:
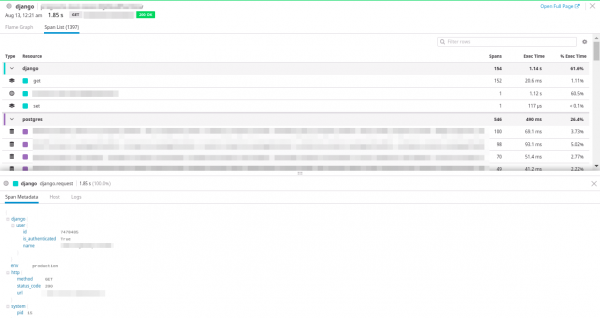
And most interestingly—a view of the host load on which the request was executed, as well as the request logs.
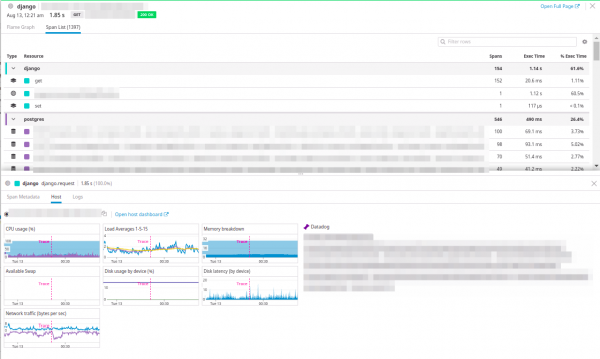
Great integration!
One might wonder where the tabs Databases and External Services, like in New Relic. They are absent here: since Datadog dissects the application into components, PostgreSQL will be considered a separate service, and instead of External Services, you should look for aws.storage (the same will apply to any other external service that the application may interact with).
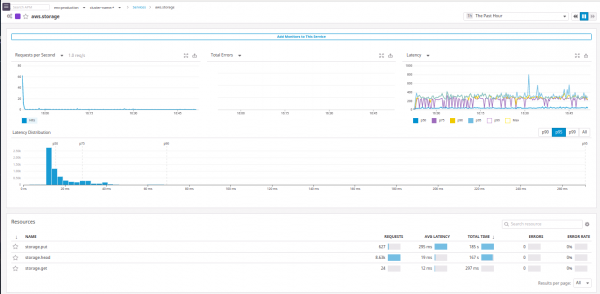
Here’s an example with postgres:
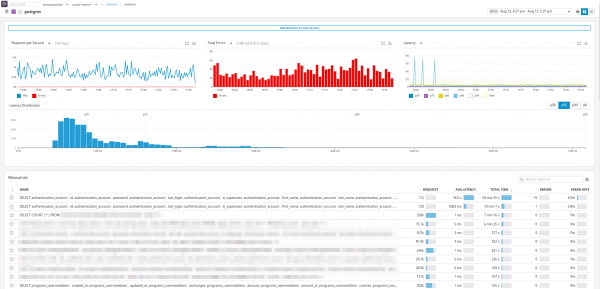
Essentially, it has everything we wanted:
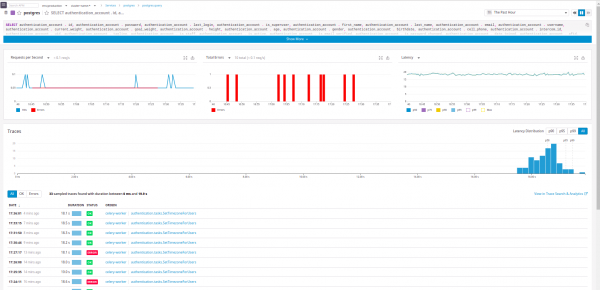
It shows which 'service' the request came from.
It’s worth reminding that Datadog integrates well with NGINX Ingress and allows for end-to-end tracing from the moment a request enters the cluster, as well as the collection of statsd metrics, logs, and host metrics.
A huge advantage of Datadog is that its pricing is made up of infrastructure monitoring, APM, Log Management, and Synthetics test, which means you can flexibly choose a plan.
2. Atatus
The Atatus team claims that their service is 'just like New Relic, but better'. Let's see if that’s really the case.
The header panel indeed looks similar, but it wasn't possible to identify the Redis and memcached used in the application.
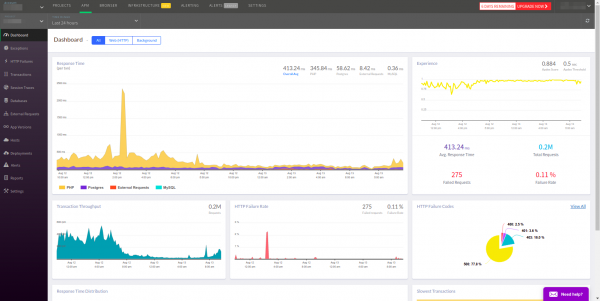
APM by default selects all transactions, although usually only Web transactions are needed. As in Datadog, there’s no way to switch to the desired service from the main panel. Moreover, transactions are listed after errors, which doesn’t seem very logical for APM.
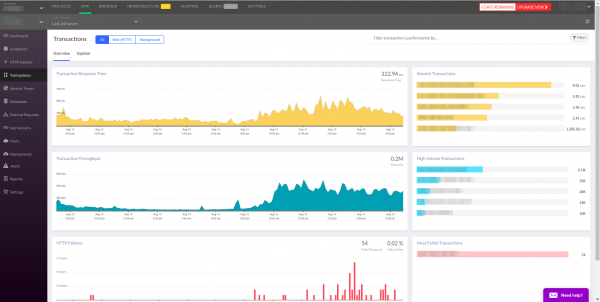
In Atatus transactions are very similar to New Relic. A drawback is that the dynamics for each controller isn't immediately visible. You have to search for it in the controllers table, sorting by Most Time Consumed:
The familiar list of controllers is available in the Explore:
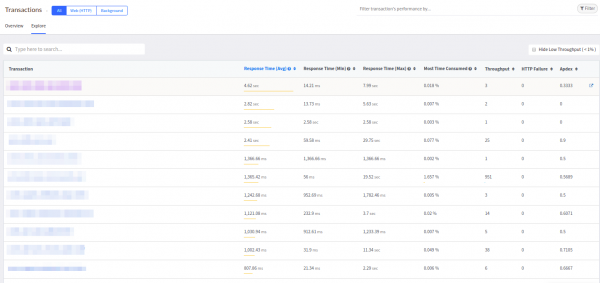
This table somewhat resembles Datadog and is preferable to the similar one in New Relic.
Each transaction can be expanded to see what the application was doing:
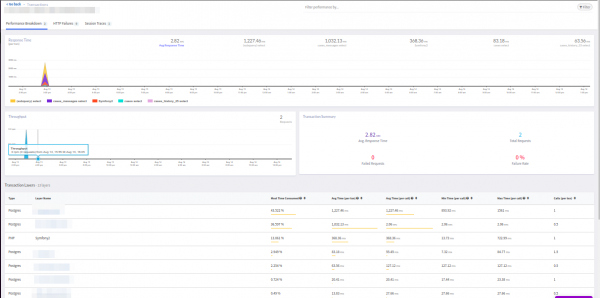
The panel also resembles Datadog: it displays the number of requests and an overview of calls. The top panel provides a tab for errors. HTTP Failures and examples of slow requests. Session Traces:

If you navigate to a transaction, you can see a trace example, get a list of database requests, and view the request headers. Everything is similar to New Relic:
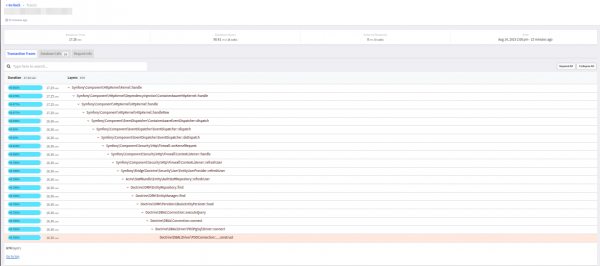
In general, Atatus impressed with detailed traces — without the typical New Relic call glueing seen in the reminder block.
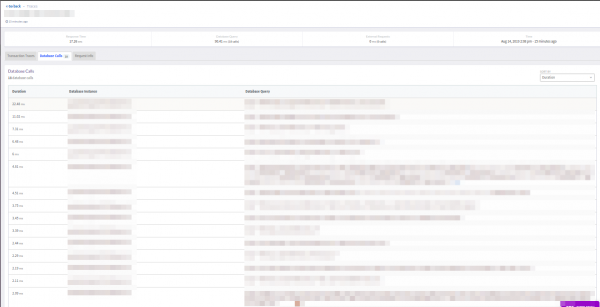
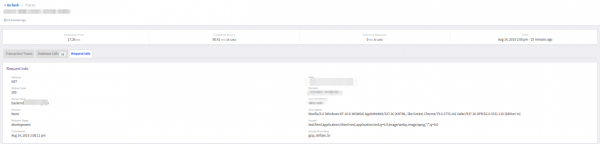
However, it lacks a filter that (like in New Relic) would exclude super-fast requests (<5 ms). On the other hand, the display of the transaction’s final response (successful or error) was appreciated.
The panel Databases will help study external database requests made by the application. I remind you that Atatus only found PostgreSQL and MySQL, although Redis and memcached are also utilized in the project.
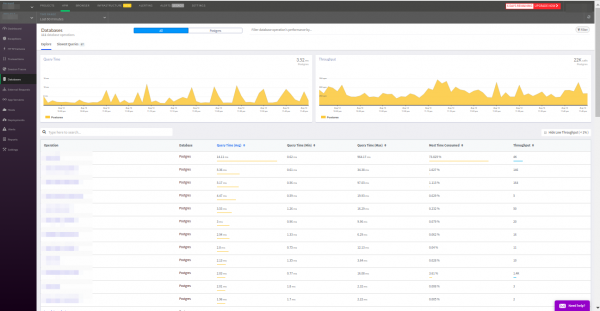
Requests are sorted by familiar criteria: frequency of triggering, average response time, and so on. It's worth mentioning the tab for the slowest requests — this is very convenient. Moreover, the data in this tab for PostgreSQL matched the data from the extension. — an excellent result!
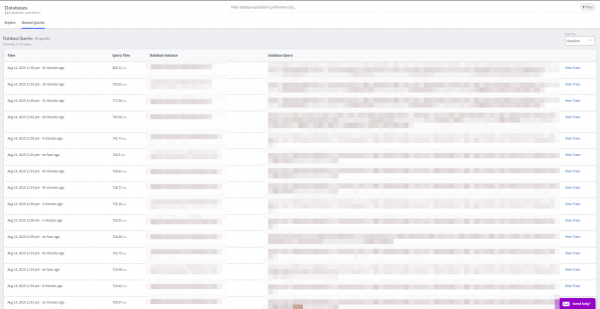
Tab External Requests is completely identical to Databases.
Conclusions
Both of the presented tools performed decently as APM. Either can offer the necessary minimum. To summarize our impressions briefly:
Datadog
Pros:
- a convenient pricing grid (APM costs 31 USD per host);
- performed excellently with Python;
- integration with OpenTracing
- Integration with Kubernetes;
- integration with NGINX Ingress.
Cons:
- the only APM that caused application unavailability due to a module error (predis);
- weak auto-instrumentation for PHP;
- somewhat strange definitions of services and their purposes.
Atatus
Pros:
- deep instrumentation for PHP;
- similar user interface to New Relic.
Cons:
- does not work on older operating systems (Ubuntu 12.05, CentOS 5);
- weak auto-instrumentation;
- supports only two programming languages (Node.js and PHP);
- slow interface performance.
Considering Atatus's price of 69 USD per month per server, we would rather use Datadog, which integrates excellently with our needs (web applications in K8s) and offers many useful features.
P.S.
Also read in our blog:
- «»;
- «»;
- «».
Source: habr.com
