

The release of PVS-Studio 7.04 coincided with the release of the Warnings Next Generation 6.0.0 plugin for Jenkins. In this release, the Warnings NG Plugin added support for the static analyzer PVS-Studio. This plugin visualizes data about compiler warnings or other analysis tools in Jenkins. This article will detail how to install and configure this plugin for use with PVS-Studio and describe most of its capabilities.
Installing the Warnings Next Generation Plugin in Jenkins
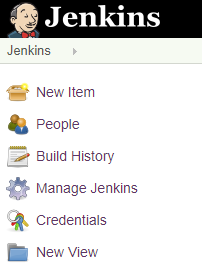
By default, Jenkins is located at . On the Jenkins homepage, we select the 'Manage Jenkins' option in the top left:
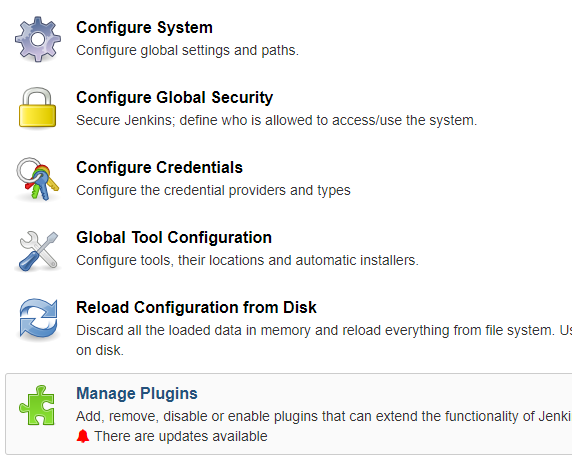
Next, we select 'Manage Plugins' and open the 'Available' tab:
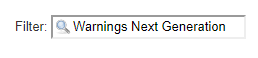
In the upper right corner of the filter field, we enter 'Warnings Next Generation':
We find the plugin in the list, check the box on the left and click 'Install without restart':

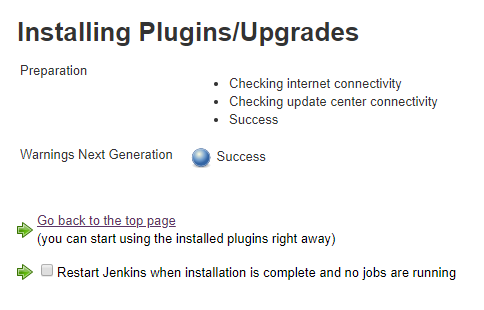
The plugin installation page will open. Here we will see the installation results:
Creating a new job in Jenkins
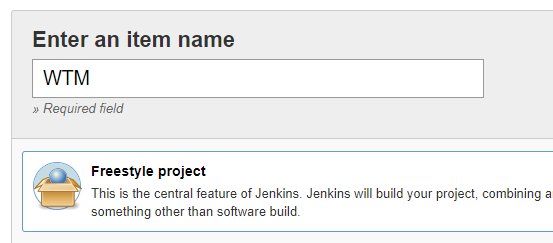
Now, let's create a job with a free configuration. On the Jenkins homepage, we select 'New Item'. We enter the project name (for example, WTM) and choose 'Freestyle project'.
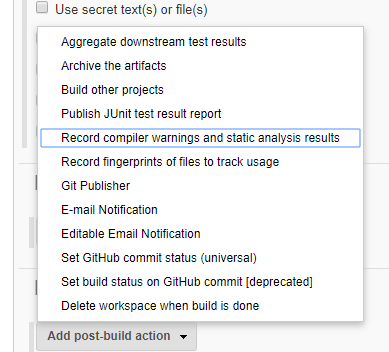
We click 'Ok', which will open the job configuration page. At the bottom of this page, in the 'Post-build Actions' section, we open the 'Add post-build action' list. From the list, we select 'Record compiler warnings and static analysis results':
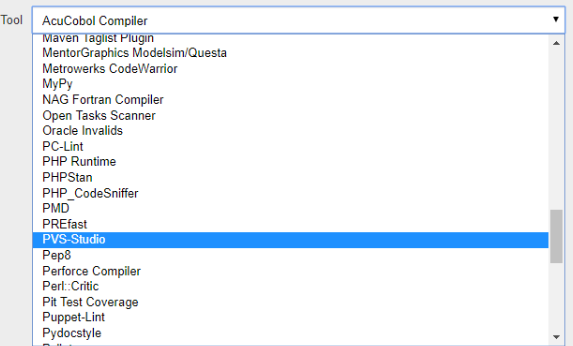
In the dropdown list of the 'Tool' field, we select 'PVS-Studio', after which we click the save button. On the job page, we click 'Build Now' to create a folder in the Jenkins workspace for our job:
Getting the project build results
Today, I came across the dotnetcore/WTM project trending on GitHub. I downloaded it from GitHub, placed it in the WTM build directory in Jenkins, and analyzed it in Visual Studio using the PVS-Studio analyzer. A detailed description of using PVS-Studio in Visual Studio is presented in the corresponding article: .
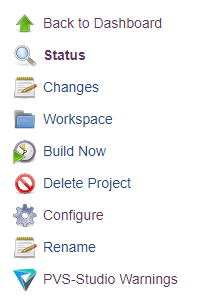
I ran the project build in Jenkins a couple of times. As a result, a chart appeared in the top right corner on the WTM job page in Jenkins, and a menu item appeared on the left: PVS-Studio Warnings:
Clicking on the chart or this menu item opens a page with the visualization of the PVS-Studio analyzer report by the Warnings Next Generation plugin:
Page with results
At the top of the page, there are two pie charts. To the right of the charts, there is a graph window. At the bottom, there is a table.
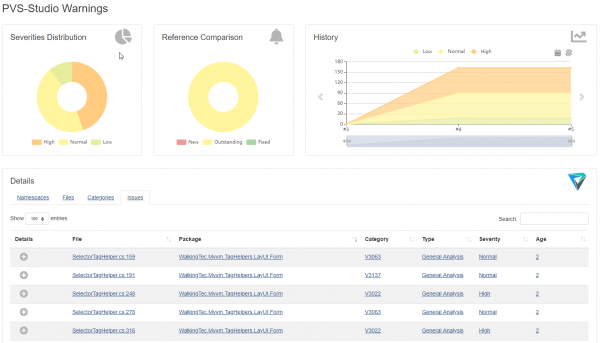
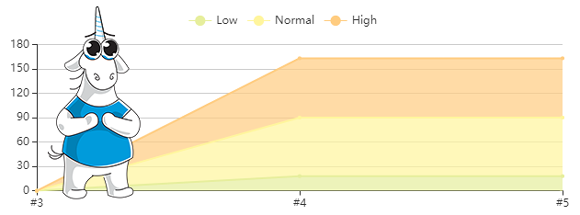
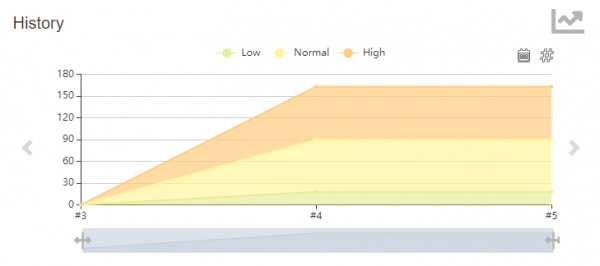
The left pie chart shows the ratio of warnings of varying levels of severity, while the right one displays the ratio of new, unresolved, and resolved warnings. There are three charts in total. You can switch between the displayed charts using the arrows on the left and right. The first two charts provide the same information as the pie charts, while the third shows the change in the number of warnings.
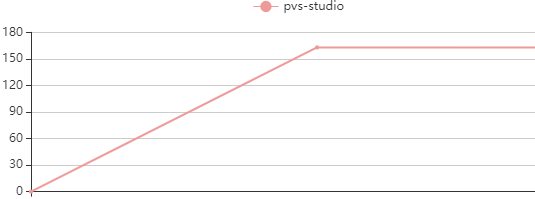
You can choose builds or days as the points on the charts.
It is also possible to narrow and expand the time range of the chart to view data over a specific period:
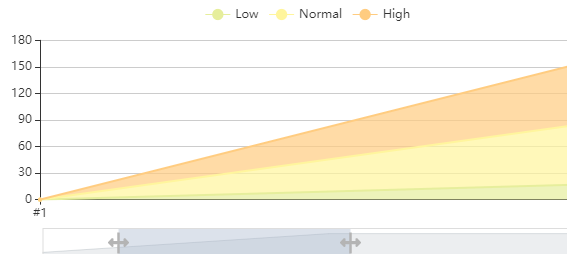
You can hide graphs for certain metrics by clicking on the metric label in the chart's legend:
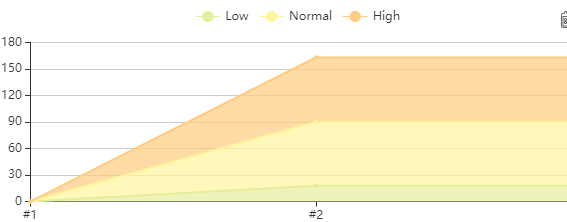
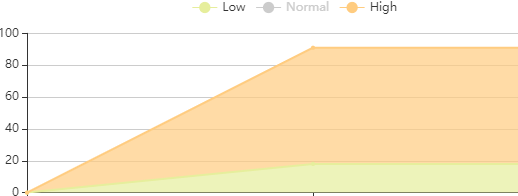
Chart after hiding the ‘Normal’ metric:
At the bottom is a table displaying the analyzer report data. Clicking on a segment of the pie chart filters the table:
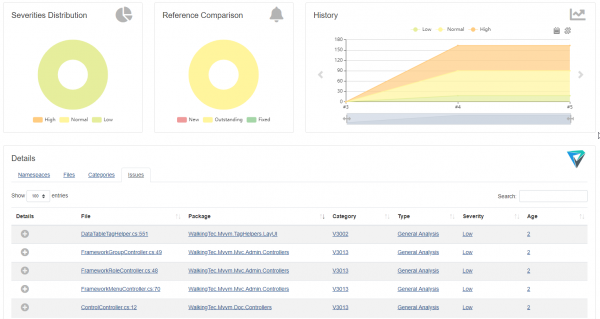
The table has several tabs for filtering data. In this example, filtering by namespace, file, category (warning name) is available. You can select how many warnings to display per page (10, 25, 50, 100):
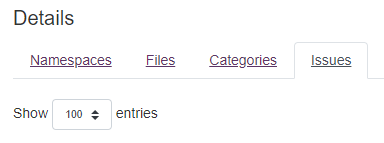
There is an option to filter data by the term entered in the ‘Search’ field. Example of filtering by the word ‘Base’:

On the ‘Issues’ tab, clicking the plus sign at the start of the table row will display a brief description of the warning:
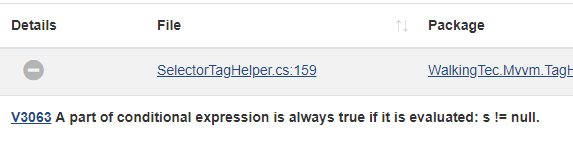
The brief description includes a link to a website with detailed information about this warning.
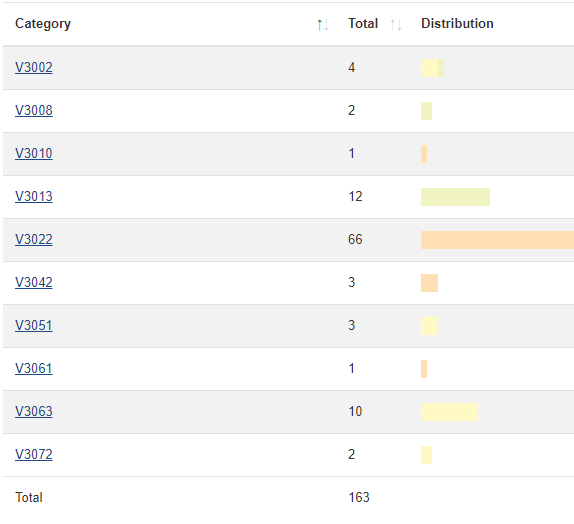
Clicking on values in the ‘Package’, ‘Category’, ‘Type’, and ‘Severity’ columns filters the table data based on the selected value. Filter by category:
The ‘Age’ column shows how many builds have experienced this warning. Clicking on the value in the ‘Age’ column opens the build page where this warning first appeared.
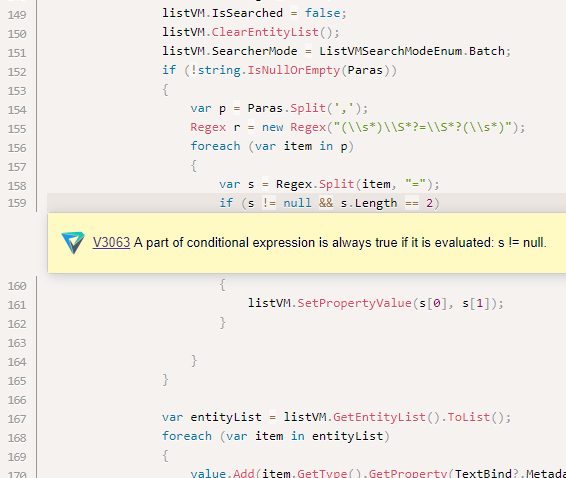
Clicking on the value in the ‘File’ column opens the source code of the file at the line with the code that triggered the warning. If the file is not present in the build directory or has been moved after the report was created, opening the source code of the file will not be possible.
Conclusion
Warnings Next Generation has proven to be a very convenient data visualization tool in Jenkins. We hope that support for PVS-Studio by this plugin will greatly assist those who already use PVS-Studio and attract the attention of other Jenkins users to static analysis. If you decide to choose PVS-Studio as your static analyzer, we will be very pleased. We invite our tool.
If you wish to share this article with an English-speaking audience, please use the link to the translation: Valery Komarov. .
Source: habr.com
