

Company released its eponymous extension pgsentinel (), which adds the pg_active_session_history view to PostgreSQL — a history of active sessions (similar to Oracle's v$active_session_history).
Essentially, these are simply snapshots from pg_stat_activity taken every second, but there are important points:
- All accumulated information is stored only in memory, and the amount of memory consumed is regulated by the number of recent records stored.
- A field named queryid is added — the same queryid from the pg_stat_statements extension (requires prior installation).
- A field named top_level_query is added — the text of the query that called the current query (in cases where pl/pgsql is used)
Complete list of fields in pg_active_session_history:
      Column      |           Type
------------------+--------------------------
 ash_time         | timestamp with time zone
 datid            | oid
 datname          | text
 pid              | integer
 usesysid         | oid
 usename          | text
 application_name | text
 client_addr      | text
 client_hostname  | text
 client_port      | integer
 backend_start    | timestamp with time zone
 xact_start       | timestamp with time zone
 query_start      | timestamp with time zone
 state_change     | timestamp with time zone
 wait_event_type  | text
 wait_event       | text
 state            | text
 backend_xid      | xid
 backend_xmin     | xid
 top_level_query  | text
 query            | text
 queryid          | bigint
 backend_type     | text
There is currently no precompiled package for installation. It is suggested to download the source code and build the library manually. You must first install the 'devel' package for your server and set the path to pg_config in the PATH variable. To build:
cd pgsentinel/src
make
make install
Add parameters to postgres.conf:
shared_preload_libraries = 'pg_stat_statements,pgsentinel'
track_activity_query_size = 2048
pg_stat_statements.track = all# количество удерживаемых в памяти последних записей
pgsentinel_ash.max_entries = 10000
Restart PostgreSQL and create the extension:
create extension pgsentinel;
The accumulated information allows you to answer questions such as:
- Which sessions spent the most time in waits?
- Which sessions were the most active?
- Which queries were the most active?
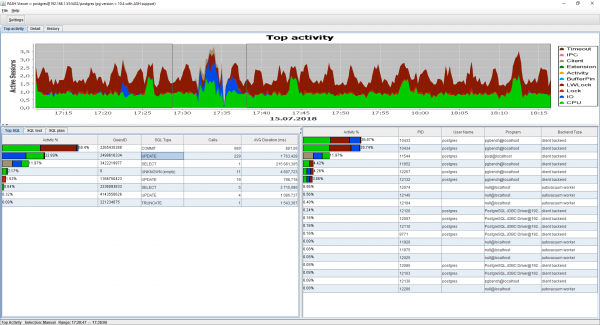
You can, of course, get answers to these questions using SQL queries, but it's more convenient to visualize this on a graph, highlighting the time intervals of interest with your mouse. You can do this using the free program (download compiled binaries in the section ).
When starting PASH-Viewer (starting from version 0.4.0), it checks for the presence of the pg_active_session_history view, and if it exists, it loads all accumulated history from it and continues to read new incoming data, updating the graph every 15 seconds.
Source: habr.com
