


TL;DR
- To achieve high observability of containers and microservices, logs and primary metrics are not enough.
- To enable faster recovery and enhance the fault tolerance of applications, the High Observability Principle (HOP) should be applied.
- At the application level, high observability requires proper logging, thorough monitoring, health checks, and performance/tracing transitions.
- As part of HOP, use health checks readinessProbe and livenessProbe Kubernetes.
What is a Health Check Template?
When designing a mission-critical and highly available application, it is crucial to consider aspects such as fault tolerance. An application is considered fault-tolerant if it recovers quickly from a failure. A typical cloud application uses a microservices architecture where each component is placed in a separate container. To ensure that the application on k8s is highly available, it is essential to follow certain patterns when designing the cluster. Among them is the Health Check Template. It defines how the application informs k8s about its health. This includes not only whether the pod is running but also how it handles and responds to requests. The more Kubernetes knows about a pod's health, the smarter decisions it makes about traffic routing and load balancing. Thus, the High Observability Principle allows applications to respond timely to requests.
High Observability Principle (HOP)
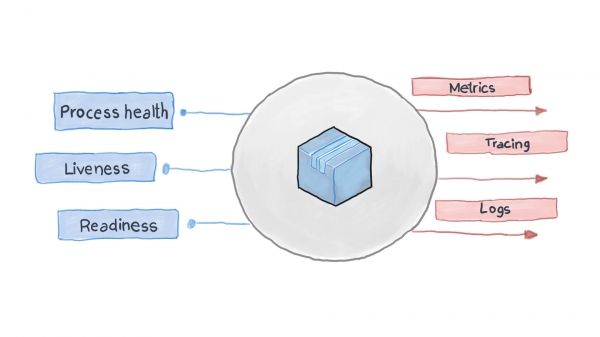
The High Observability Principle is one of the In a microservices architecture, services are indifferent to how their requests are processed (which is correct), but it is important to know how to receive responses from the accepting services. For instance, for user authentication, one container sends an HTTP request to another, waiting for a response in a specific format – and that's all. The request can be processed by PythonJS, and the response can come from Python Flask. Containers are like black boxes for each other with hidden content. However, the principle of NORN requires each service to expose several API endpoints that demonstrate its operability, as well as its readiness and fault tolerance. These metrics are what Kubernetes requests to plan the next steps for routing and load balancing.
A well-designed cloud application logs its key events using standard input-output streams STDERR and STDOUT. Next, a helper service, such as filebeat, logstash, or fluentd, delivers the logs to a centralized monitoring system (for example, Prometheus) and a logging aggregation system (an ELK stack). The diagram below illustrates how a cloud application operates according to the Health Check Template and the High Observability Principle.
How to apply the Health Check Template in Kubernetes?
Out of the box, k8s monitors the state of pods using one of the controllers (, , , and others). Upon detecting that a pod has crashed for some reason, the controller attempts to restart it or reschedule it on another node. However, the pod can report that it is running and operational while actually not functioning. For example: your application uses Apache as a web server, and you have deployed the component across several pods in the cluster. Because the library was misconfigured, all requests to the application return a 500 code (internal server error). During health checks, the state of the pods shows a successful result, but the clients disagree. We can describe this undesirable situation as follows:
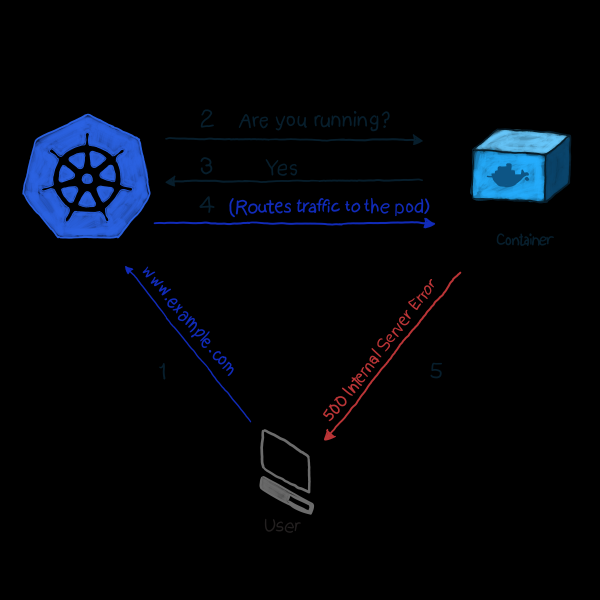
In our example, k8s performs health checksIn this type of check, the kubelet constantly verifies the status of the process in the container. As soon as it detects that the process has stopped, it restarts it. If the error can be resolved simply by restarting the application, and the program is designed to terminate on any error, then for compliance with the Liveness Probe and the Health Check Template, a simple process check will suffice. It’s just unfortunate that not all errors can be fixed by a restart. For such cases, Kubernetes offers two deeper ways to diagnose issues in a pod's operation: and .
LivenessProbe
During livenessProbe the kubelet performs 3 types of checks: it not only determines whether the pod is running, but also whether it is ready to receive and adequately respond to requests:
- Set up an HTTP request to the pod. The response should contain an HTTP status code in the range of 200 to 399. Thus, status codes 5xx and 4xx indicate that the pod is having problems, even if the process is running.
- For checking pods with non-HTTP services (for example, the Postfix mail server), a TCP connection needs to be established.
- Executing an arbitrary command for the pod (internally). The check is considered successful if the command's exit code is 0.
Here is an example of how it works. The following pod definition contains a NodeJS application that returns a 500 error for HTTP requests. To ensure that the container restarts upon receiving such an error, we use the livenessProbe parameter:
apiVersion: v1
kind: Pod
metadata:
 name: node500
spec:
 containers:
   - image: magalix/node500
     name: node500
     ports:
       - containerPort: 3000
         protocol: TCP
     livenessProbe:
       httpGet:
         path: /
         port: 3000
       initialDelaySeconds: 5
This is no different from any other pod definition, but we add the object .spec.containers.livenessProbe. The parameter httpGet accepts the path to which an HTTP GET request is sent (in our example, this is /, but in production scenarios, it may be something like /api/v1/status). The livenessProbe also accepts a parameter initialDelaySeconds, which instructs the check operations to wait a specified number of seconds. The delay is necessary because the container needs time to start, and upon restarting, it will be unavailable for some time.
To apply this setting to the cluster, use:
kubectl apply -f pod.yamlAfter a few seconds, you can check the contents of the pod with the following command:
kubectl describe pods node500At the end of the output, find .
As you can see, the livenessProbe initiated an HTTP GET request, and the container returned a 500 error (which was expected), causing kubelet to restart it.
If you're interested in how the Node.js application was programmed, here are the app.js file and Dockerfile that were used:
app.js
var http = require('http');

var server = http.createServer(function(req, res) {
    res.writeHead(500, { "Content-type": "text/plain" });
    res.end("We have run into an error\n");
});

server.listen(3000, function() {
    console.log('Server is running at 3000')
})
Dockerfile
FROM node
COPY app.js /
EXPOSE 3000
ENTRYPOINT [ "node","/app.js" ]
It is important to note the following: the livenessProbe will only restart the container upon failure. If the restart does not fix the error preventing the container from working, kubelet will not be able to take action to resolve the issue.
readinessProbe
The readinessProbe works similarly to the livenessProbe (GET requests, TCP connections, and command execution), except for fault remediation actions. A container that has encountered a failure is not restarted but isolated from incoming traffic. Imagine one of the containers is performing heavy computations or is under heavy load, causing increased response times to requests. In the case of livenessProbe, availability check is triggered (via the timeoutSeconds parameter), after which kubelet restarts the container. Upon restart, the container begins performing resource-intensive tasks and is restarted again. This can be critical for applications that require quick responses. For example, a vehicle in transit waits for a response from the server, the response is delayed - and the vehicle crashes.
Let's write a definition for readinessProbe that will set the response time for a GET request to no more than two seconds, while the application will respond to the GET request after 5 seconds. The pod.yaml file should look like this:
apiVersion: v1
kind: Pod
metadata:
 name: nodedelayed
spec:
 containers:
   - image: afakharany/node_delayed
     name: nodedelayed
     ports:
       - containerPort: 3000
         protocol: TCP
     readinessProbe:
       httpGet:
         path: /
         port: 3000
       timeoutSeconds: 2
Let's deploy the pod with kubectl:
kubectl apply -f pod.yamlWe'll wait a couple of seconds, then check how the readinessProbe executed:
kubectl describe pods nodedelayedAt the end of the output, you can see that some events are similar to .
As you can see, kubectl did not restart the pod when the check time exceeded 2 seconds. Instead, it canceled the request. Incoming connections are redirected to other working pods.
Note: Now that the extra load has been removed from the pod, kubectl is once again routing requests to it: responses to GET requests are no longer delayed.
For comparison, here is the modified app.js file:
var http = require('http');

var server = http.createServer(function(req, res) {
   const sleep = (milliseconds) => {
       return new Promise(resolve => setTimeout(resolve, milliseconds))
   }
   sleep(5000).then(() => {
       res.writeHead(200, { "Content-type": "text/plain" });
       res.end("Hello\n");
   })
});

server.listen(3000, function() {
   console.log('Server is running at 3000')
})
TL;DR
Before the advent of cloud applications, logging was the primary means of monitoring and checking the health of applications. However, there were no tools to take corrective actions for troubleshooting. Logs are still useful today; they should be collected and sent to the logging system for crash analysis and decision-making. [This could all be done without cloud applications using something like monit, for example, but with k8s, it has become much easier 🙂 – ed. note. ]
Today, corrections must be made almost in real-time, so applications can no longer be black boxes. No, they must show endpoints that allow monitoring systems to query and gather valuable data about process health, enabling immediate responses if necessary. This is called the Health Check Design Pattern, which adheres to the Principle of High Observability (PHO).
Kubernetes by default offers two types of health checks: readinessProbe and livenessProbe. Both use the same types of checks (HTTP GET requests, TCP connections, and command execution). They differ in the responses they take to failures in pods. livenessProbe restarts the container in the hope that the error won't happen again, while readinessProbe isolates the pod from incoming traffic until the issue is resolved.
Proper application design should include both types of checks and ensure they collect sufficient data, especially when an exceptional situation arises. It should also present the necessary API endpoints that transmit critical health metrics to the monitoring system (such as Prometheus).
Source: habr.com
