

Alexey Lizunov, head of the remote service competency center at the IT department of MKB

As an alternative to the ELK stack (ElasticSearch, Logstash, Kibana), we are conducting research on using ClickHouse DB as a data storage solution for logs.
In this article, we would like to share our experience using ClickHouse DB and the preliminary results of our pilot operation. It’s worth noting right away that the results have been impressive.
Next, we will describe in detail how our system is configured and what components it consists of. But for now, we’d like to tell you a bit about this DB in general and why it deserves your attention. ClickHouse DB is a high-performance analytical columnar database developed by Yandex. It is used in Yandex services and was initially the main data storage for Yandex.Metrics. The system is open-source and free. From a developer's perspective, I've always been curious about how they implement this, given the extraordinarily large data sizes. The user interface of Metrics is very flexible and operates quickly. Upon first encountering this DB, the impression is, "Finally! Designed 'for people'! From the installation process to sending queries."
This DB has a very low entry barrier. Even a developer of average skill can install it in a few minutes and start using it. Everything works seamlessly. Even those who are not well-acquainted with Linux can manage the installation pretty quickly and perform basic operations. Previously, when someone mentioned Big Data, Hadoop, Google BigTable, HDFS, the average developer would think that these involved some terabytes, petabytes, and that configuring and developing for these systems was a task for superhumans, but with the emergence of ClickHouse DB, we now have a simple, understandable tool that can solve previously unattainable tasks. You only need a fairly average machine and five minutes for installation. In other words, we have a DB similar to MySQL, but capable of storing billions of records! It’s like handing people an alien weapon.
About our log collection system
IIS web application log files in standard format are used to collect information (we are also currently working on parsing application logs, but the main goal at this pilot stage is to collect IIS logs).
We could not completely abandon the ELK stack for various reasons, and we continue to use LogStash and Filebeat components that have proven effective and work reliably and predictably.
The overall logging scheme is illustrated in the figure below:
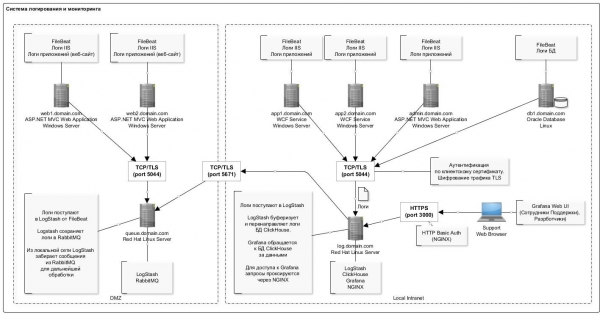
A notable feature of data insertion in the ClickHouse DB is the infrequent (once per second) insertion of records in large batches. This seems to be the most 'problematic' part that one encounters when first working with ClickHouse DB: the scheme gets slightly more complicated.
The LogStash plugin, which directly inserts data into ClickHouse, was particularly helpful here. This component is deployed on the same server as the DB itself. Although, generally speaking, this is not recommended, from a practical point of view, to avoid spawning separate servers, it is currently deployed on the same server. We have not experienced any failures or resource conflicts with the DB. Moreover, it is important to note that the plugin has a retry mechanism in case of errors. In the event of errors, the plugin writes a batch of data that failed to insert to disk (the file format is convenient: after correction, you can easily insert the corrected batch using clickhouse-client).
The complete list of software used in the scheme is presented in the table:
List of used software
Title
Description
Link to the distribution
NGINX
Reverse proxy for access limitation by ports and organization of authentication
Currently not used in the scheme
FileBeat
Transfer of file logs.
(distribution for Windows 64bit).
LogStash
Log collector.
Used for collecting logs from FileBeat as well as for collecting logs from RabbitMQ queue (for servers located in the DMZ).
Logstash-output-clickhouse
Logstash plugin for batch transferring logs to ClickHouse DB
/usr/share/logstash/bin/logstash-plugin install logstash-output-clickhouse
/usr/share/logstash/bin/logstash-plugin install logstash-filter-prune
/usr/share/logstash/bin/logstash-plugin install logstash-filter-multiline
ClickHouse
Log storage
Note. Since August 2018, 'normal' rpm builds for RHEL have appeared in the Yandex repository, so you can try using them. At the time of installation, we used packages built by Altinity.
Grafana
Log visualization. Dashboard configuration
Redhat & CentOS (64 Bit) – the latest version
ClickHouse datasource for Grafana 4.6+
Grafana plugin with ClickHouse data source
LogStash
Log router from FileBeat to RabbitMQ queue.
Note: Unfortunately, FileBeat does not have a direct output to RabbitMQ, so an intermediate link via Logstash is required.
RabbitMQ
Message queue. This is a buffer for log records in the DMZ.
Erlang Runtime (Required for RabbitMQ)
Erlang runtime environment. Required for RabbitMQ operation.
The server configuration with ClickHouse DB is represented in the following table:
Title
Value
Note
Configuration
HDD: 40GB
RAM: 8GB
Processor: Core 2 2Ghz
Attention should be paid to the ClickHouse DB operation tips ()
General system software
OS: Red Hat Enterprise Linux Server (Maipo)
JRE (Java 8)
As can be seen, this is a regular workstation.
The table structure for storing logs looks as follows:
log_web.sql
CREATE TABLE log_web (
  logdate Date,
  logdatetime DateTime CODEC(Delta, LZ4HC),

  fld_log_file_name LowCardinality( String ),
  fld_server_name LowCardinality( String ),
  fld_app_name LowCardinality( String ),
  fld_app_module LowCardinality( String ),
  fld_website_name LowCardinality( String ),

  serverIP LowCardinality( String ),
  method LowCardinality( String ),
  uriStem String,
  uriQuery String,
  port UInt32,
  username LowCardinality( String ),
  clientIP String,
  clientRealIP String,
  userAgent String,
  referer String,
  response String,
  subresponse String,
  win32response String,
  timetaken UInt64

  , uriQuery__utm_medium String
  , uriQuery__utm_source String
  , uriQuery__utm_campaign String
  , uriQuery__utm_term String
  , uriQuery__utm_content String
  , uriQuery__yclid String
  , uriQuery__region String

) Engine = MergeTree()
PARTITION BY toYYYYMM(logdate)
ORDER BY (fld_app_name, fld_app_module, logdatetime)
SETTINGS index_granularity = 8192;
We use default values for partitioning (by months) and index granularity. All fields closely correspond to IIS log records for HTTP request logging. Notably, there are separate fields for storing UTM tags (they are parsed during the insertion phase into the table from the query string field).
Additionally, the table includes several system fields to store information about systems, components, and servers. The description of these fields can be found in the table below. We store logs for multiple systems in one table.
Title
Description
Example
fld_app_name
Application/System Name
Allowed values:
- site1.domain.com External site 1
- site2.domain.com External site 2
- internal-site1.domain.local Internal site 1
site1.domain.com
fld_app_module
System Module
Allowed values:
- web — Website
- svc — Website web service
- intgr — Integration web service
- bo — Admin (BackOffice)
web
fld_website_name
Website name in IIS
Multiple systems, or even multiple instances of the same system module, can be deployed on one server.
web-main
fld_server_name
Server Name
web1.domain.com
fld_log_file_name
Path to the log file on the server
C:\inetpub\logs\LogFiles
W3SVC1\u_ex190711.log
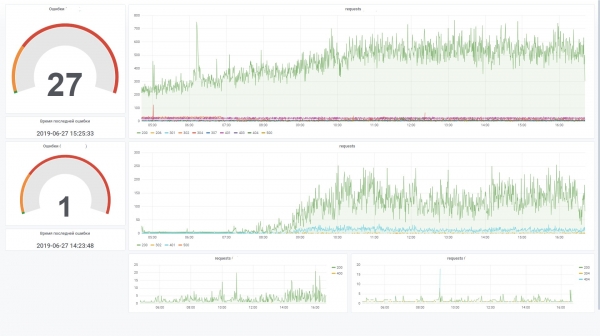
This allows for effective chart building in Grafana. For example, viewing requests from the frontend of a specific system. This is similar to a website counter in Yandex.Metrica.
Here is some statistics on database usage over the past two months.
Number of records broken down by systems and their components
SELECT
    fld_app_name,
    fld_app_module,
    count(fld_app_name) AS rows_count
FROM log_web
GROUP BY
    fld_app_name,
    fld_app_module
    WITH TOTALS
ORDER BY
    fld_app_name ASC,
    rows_count DESC

┌─fld_app_name─────┬─fld_app_module─┬─rows_count─┐
│ site1.domain.ru  │ web            │     131441 │
│ site2.domain.ru  │ web            │    1751081 │
│ site3.domain.ru  │ web            │  106887543 │
│ site3.domain.ru  │ svc            │   44908603 │
│ site3.domain.ru  │ intgr          │    9813911 │
│ site4.domain.ru  │ web            │     772095 │
│ site5.domain.ru  │ web            │   17037221 │
│ site5.domain.ru  │ intgr          │     838559 │
│ site5.domain.ru  │ bo             │       7404 │
│ site6.domain.ru  │ web            │     595877 │
│ site7.domain.ru  │ web            │   27778858 │
└──────────────────┴────────────────┴────────────┘

Totals:
┌─fld_app_name─┬─fld_app_module─┬─rows_count─┐
│              │                │  210522593 │
└──────────────┴────────────────┴────────────┘

11 rows in set. Elapsed: 4.874 sec. Processed 210.52 million rows, 421.67 MB (43.19 million rows/s., 86.51 MB/s.)
Volume of data on disk
SELECT
    formatReadableSize(sum(data_uncompressed_bytes)) AS uncompressed,
    formatReadableSize(sum(data_compressed_bytes)) AS compressed,
    sum(rows) AS total_rows
FROM system.parts
WHERE table = 'log_web'

┌─uncompressed─┬─compressed─┬─total_rows─┐
│ 54.50 GiB    │ 4.86 GiB   │  211427094 │
└──────────────┴────────────┴────────────┘

1 rows in set. Elapsed: 0.035 sec.
Data compression ratio in columns
SELECT
    name,
    formatReadableSize(data_uncompressed_bytes) AS uncompressed,
    formatReadableSize(data_compressed_bytes) AS compressed,
    data_uncompressed_bytes / data_compressed_bytes AS compress_ratio
FROM system.columns
WHERE table = 'log_web'

┌─name───────────────────┬─uncompressed─┬─compressed─┬─────compress_ratio─┐
│ logdate                │ 401.53 MiB   │ 1.80 MiB   │ 223.16665968777315 │
│ logdatetime            │ 803.06 MiB   │ 35.91 MiB  │ 22.363966401202305 │
│ fld_log_file_name      │ 220.66 MiB   │ 2.60 MiB   │  84.99905736932571 │
│ fld_server_name        │ 201.54 MiB   │ 50.63 MiB  │  3.980924816977078 │
│ fld_app_name           │ 201.17 MiB   │ 969.17 KiB │ 212.55518183686877 │
│ fld_app_module         │ 201.17 MiB   │ 968.60 KiB │ 212.67805817411906 │
│ fld_website_name       │ 201.54 MiB   │ 1.24 MiB   │  162.7204926761546 │
│ serverIP               │ 201.54 MiB   │ 50.25 MiB  │  4.010824061219731 │
│ method                 │ 201.53 MiB   │ 43.64 MiB  │  4.617721053304486 │
│ uriStem                │ 5.13 GiB     │ 832.51 MiB │  6.311522291936919 │
│ uriQuery               │ 2.58 GiB     │ 501.06 MiB │  5.269731450124478 │
│ port                   │ 803.06 MiB   │ 3.98 MiB   │ 201.91673864241824 │
│ username               │ 318.08 MiB   │ 26.93 MiB  │ 11.812513794583598 │
│ clientIP               │ 2.35 GiB     │ 82.59 MiB  │ 29.132328640073343 │
│ clientRealIP           │ 2.49 GiB     │ 465.05 MiB │  5.478382297052563 │
│ userAgent              │ 18.34 GiB    │ 764.08 MiB │  24.57905114484208 │
│ referer                │ 14.71 GiB    │ 1.37 GiB   │ 10.736792723669906 │
│ response               │ 803.06 MiB   │ 83.81 MiB  │  9.582334090987247 │
│ subresponse            │ 399.87 MiB   │ 1.83 MiB   │  218.4831068635027 │
│ win32response          │ 407.86 MiB   │ 7.41 MiB   │ 55.050315514606815 │
│ timetaken              │ 1.57 GiB     │ 402.06 MiB │ 3.9947395692010637 │
│ uriQuery__utm_medium   │ 208.17 MiB   │ 12.29 MiB  │ 16.936148912472955 │
│ uriQuery__utm_source   │ 215.18 MiB   │ 13.00 MiB  │ 16.548367623199912 │
│ uriQuery__utm_campaign │ 381.46 MiB   │ 37.94 MiB  │ 10.055156353418509 │
│ uriQuery__utm_term     │ 231.82 MiB   │ 10.78 MiB  │ 21.502540454070672 │
│ uriQuery__utm_content  │ 441.34 MiB   │ 87.60 MiB  │  5.038260760449327 │
│ uriQuery__yclid        │ 216.88 MiB   │ 16.58 MiB  │  13.07721335008116 │
│ uriQuery__region       │ 204.35 MiB   │ 9.49 MiB   │  21.52661903446796 │
└────────────────────────┴──────────────┴────────────┴────────────────────┘

28 rows in set. Elapsed: 0.005 sec.
Description of the used components
FileBeat. File log transmission
This component monitors changes in log files on disk and sends information to LogStash. It is installed on all servers where log files are written (typically IIS). It operates in tail mode (i.e., only sends newly added records to the file). However, it can be configured to send entire files separately. This is convenient when you need to upload data from previous months. Just place the log file in the folder, and it will read it completely.
When the service stops, data stops being transmitted to the storage.
The configuration example looks as follows:
filebeat.yml
filebeat.inputs:
- type: log
  enabled: true
  paths:
    - C:/inetpub/logs/LogFiles/W3SVC1/*.log
  exclude_files: ['.gz$','.zip$']
  tail_files: true
  ignore_older: 24h
  fields:
    fld_server_name: "site1.domain.ru"
    fld_app_name: "site1.domain.ru"
    fld_app_module: "web"
    fld_website_name: "web-main"

- type: log
  enabled: true
  paths:
    - C:/inetpub/logs/LogFiles/__Import/access_log-*
  exclude_files: ['.gz$','.zip$']
  tail_files: false
  fields:
    fld_server_name: "site2.domain.ru"
    fld_app_name: "site2.domain.ru"
    fld_app_module: "web"
    fld_website_name: "web-main"
    fld_logformat: "logformat__apache"


filebeat.config.modules:
  path: ${path.config}/modules.d/*.yml
  reload.enabled: false
  reload.period: 2s

output.logstash:
  hosts: ["log.domain.com:5044"]

  ssl.enabled: true
  ssl.certificate_authorities: ["C:/filebeat/certs/ca.pem", "C:/filebeat/certs/ca-issuing.pem"]
  ssl.certificate: "C:/filebeat/certs/site1.domain.ru.cer"
  ssl.key: "C:/filebeat/certs/site1.domain.ru.key"

#================================ Processors =====================================

processors:
  - add_host_metadata: ~
  - add_cloud_metadata: ~
LogStash. Log Collector
This component is designed to receive log records from FileBeat (or via RabbitMQ queue), parse them, and insert them in batches into the ClickHouse database.
To insert into ClickHouse, the Logstash-output-clickhouse plugin is used. The Logstash plugin has a retry mechanism for requests, but during a normal shutdown, it is still better to stop the service itself. When stopped, messages accumulate in the RabbitMQ queue, so if the stop is for a prolonged period, it’s better to stop Filebeat on the servers. In a setup where RabbitMQ is not used (Filebeat directly sends logs to Logstash over the local network), Filebeat operates quite acceptably and safely, so unavailability of the output has no consequences for them.
The configuration example looks as follows:
log_web__filebeat_clickhouse.conf
input {

    beats {
        port => 5044
        type => 'iis'
        ssl => true
        ssl_certificate_authorities => ["/etc/logstash/certs/ca.cer", "/etc/logstash/certs/ca-issuing.cer"]
        ssl_certificate => "/etc/logstash/certs/server.cer"
        ssl_key => "/etc/logstash/certs/server-pkcs8.key"
        ssl_verify_mode => "peer"

            add_field => {
                "fld_server_name" => "%{[fields][fld_server_name]}"
                "fld_app_name" => "%{[fields][fld_app_name]}"
                "fld_app_module" => "%{[fields][fld_app_module]}"
                "fld_website_name" => "%{[fields][fld_website_name]}"
                "fld_log_file_name" => "%{source}"
                "fld_logformat" => "%{[fields][fld_logformat]}"
            }
    }

    rabbitmq {
        host => "queue.domain.com"
        port => 5671
        user => "q-reader"
        password => "password"
        queue => "web_log"
        heartbeat => 30
        durable => true
        ssl => true
        #ssl_certificate_path => "/etc/logstash/certs/server.p12"
        #ssl_certificate_password => "password"

        add_field => {
            "fld_server_name" => "%{[fields][fld_server_name]}"
            "fld_app_name" => "%{[fields][fld_app_name]}"
            "fld_app_module" => "%{[fields][fld_app_module]}"
            "fld_website_name" => "%{[fields][fld_website_name]}"
            "fld_log_file_name" => "%{source}"
            "fld_logformat" => "%{[fields][fld_logformat]}"
        }
    }

}

filter {

      if [message] =~ "^#" {
        drop {}
      }

      if [fld_logformat] == "logformat__iis_with_xrealip" {

          grok {
            match => ["message", "%{TIMESTAMP_ISO8601:log_timestamp} %{IP:serverIP} %{WORD:method} %{NOTSPACE:uriStem} %{NOTSPACE:uriQuery} %{NUMBER:port} %{NOTSPACE:username} %{IPORHOST:clientIP} %{NOTSPACE:userAgent} %{NOTSPACE:referer} %{NUMBER:response} %{NUMBER:subresponse} %{NUMBER:win32response} %{NUMBER:timetaken} %{NOTSPACE:xrealIP} %{NOTSPACE:xforwarderfor}"]
          }
      } else {

          grok {
             match => ["message", "%{TIMESTAMP_ISO8601:log_timestamp} %{IP:serverIP} %{WORD:method} %{NOTSPACE:uriStem} %{NOTSPACE:uriQuery} %{NUMBER:port} %{NOTSPACE:username} %{IPORHOST:clientIP} %{NOTSPACE:userAgent} %{NOTSPACE:referer} %{NUMBER:response} %{NUMBER:subresponse} %{NUMBER:win32response} %{NUMBER:timetaken}"]
          }

      }

      date {
        match => [ "log_timestamp", "YYYY-MM-dd HH:mm:ss" ]
          timezone => "Etc/UTC"
        remove_field => [ "log_timestamp", "@timestamp" ]
        target => [ "log_timestamp2" ]
      }

        ruby {
            code => "tstamp = event.get('log_timestamp2').to_i
                        event.set('logdatetime', Time.at(tstamp).strftime('%Y-%m-%d %H:%M:%S'))
                        event.set('logdate', Time.at(tstamp).strftime('%Y-%m-%d'))"
        }

      if [bytesSent] {
        ruby {
          code => "event['kilobytesSent'] = event['bytesSent'].to_i / 1024.0"
        }
      }


      if [bytesReceived] {
        ruby {
          code => "event['kilobytesReceived'] = event['bytesReceived'].to_i / 1024.0"
        }
      }


        ruby {
            code => "event.set('clientRealIP', event.get('clientIP'))"
        }
        if [xrealIP] {
            ruby {
                code => "event.set('clientRealIP', event.get('xrealIP'))"
            }
        }
        if [xforwarderfor] {
            ruby {
                code => "event.set('clientRealIP', event.get('xforwarderfor'))"
            }
        }

      mutate {
        convert => ["bytesSent", "integer"]
        convert => ["bytesReceived", "integer"]
        convert => ["timetaken", "integer"]
        convert => ["port", "integer"]

        add_field => {
            "clientHostname" => "%{clientIP}"
        }
      }

        useragent {
            source => "useragent"
            prefix => "browser"
        }

        kv {
            source => "uriQuery"
            prefix => "uriQuery__"
            allow_duplicate_values => false
            field_split => "&"
            include_keys => [ "utm_medium", "utm_source", "utm_campaign", "utm_term", "utm_content", "yclid", "region" ]
        }

        mutate {
            join => { "uriQuery__utm_source" => "," }
            join => { "uriQuery__utm_medium" => "," }
            join => { "uriQuery__utm_campaign" => "," }
            join => { "uriQuery__utm_term" => "," }
            join => { "uriQuery__utm_content" => "," }
            join => { "uriQuery__yclid" => "," }
            join => { "uriQuery__region" => "," }
        }

}

output {
  #stdout {codec => rubydebug}
    clickhouse {
      headers => ["Authorization", "Basic abcdsfks..."]
      http_hosts => ["http://127.0.0.1:8123"]
      save_dir => "/etc/logstash/tmp"
      table => "log_web"
      request_tolerance => 1
      flush_size => 10000
      idle_flush_time => 1
        mutations => {
            "fld_log_file_name" => "fld_log_file_name"
            "fld_server_name" => "fld_server_name"
            "fld_app_name" => "fld_app_name"
            "fld_app_module" => "fld_app_module"
            "fld_website_name" => "fld_website_name"

            "logdatetime" => "logdatetime"
            "logdate" => "logdate"
            "serverIP" => "serverIP"
            "method" => "method"
            "uriStem" => "uriStem"
            "uriQuery" => "uriQuery"
            "port" => "port"
            "username" => "username"
            "clientIP" => "clientIP"
            "clientRealIP" => "clientRealIP"
            "userAgent" => "userAgent"
            "referer" => "referer"
            "response" => "response"
            "subresponse" => "subresponse"
            "win32response" => "win32response"
            "timetaken" => "timetaken"

            "uriQuery__utm_medium" => "uriQuery__utm_medium"
            "uriQuery__utm_source" => "uriQuery__utm_source"
            "uriQuery__utm_campaign" => "uriQuery__utm_campaign"
            "uriQuery__utm_term" => "uriQuery__utm_term"
            "uriQuery__utm_content" => "uriQuery__utm_content"
            "uriQuery__yclid" => "uriQuery__yclid"
            "uriQuery__region" => "uriQuery__region"
        }
    }

}
pipelines.yml
# This file is where you define your pipelines. You can define multiple.
# For more information on multiple pipelines, see the documentation:
#   https://www.elastic.co/guide/en/logstash/current/multiple-pipelines.html

- pipeline.id: log_web__filebeat_clickhouse
  path.config: "/etc/logstash/log_web__filebeat_clickhouse.conf"
ClickHouse. Log Storage
Logs from all systems are stored in a single table (see the beginning of the article). This table is designed to store information about requests: all parameters are similar for different formats, such as IIS logs, Apache, and Nginx logs. For application logs that record, for instance, errors, informational messages, and warnings, a separate table with the appropriate structure will be provided (currently in the design stage).
When designing the table, it is very important to determine the primary key (which will be used to sort data during storage). This affects the degree of data compression and the speed of queries. In our example, the key is
ORDER BY (fld_app_name, fld_app_module, logdatetime)
That is, by the system name, the name of the system component, and the event date. Initially, the event date was in the first position. After moving it to the last position, queries became approximately twice as fast. Changing the primary key will require recreating the table and reloading the data so that ClickHouse can sort the data on disk. This is a heavy operation, so it is advisable to carefully consider what should be included in the sort key well in advance.
It should also be noted that relatively in the latest versions, a LowCardinality data type has appeared. Its use sharply reduces the size of compressed data for those fields that have low cardinality (few options).
Currently, version 19.6 is used, and we plan to try upgrading to the latest version. It includes such wonderful features as Adaptive Granularity, Skipping indices, and the DoubleDelta codec, for example.
By default, when installed in the configuration, the log level is set to trace. Logs are rotated and archived, but they expand to a gigabyte. If not necessary, the warning level can be set, which significantly reduces the log size. The logging configuration is set in the config.xml file:
<!-- Possible levels: https://github.com/pocoproject/poco/blob/develop/Foundation/include/Poco/Logger.h#L105 -->
<level>warning<\/level>
Some useful commands
Since the original installation packages are built on Debian, alternative packages from Altinity must be used for other versions of Linux.

Instructions with links to their repository can be found at this link: https://www.altinity.com/blog/2017/12/18/logstash-with-clickhouse
sudo yum search clickhouse-server
sudo yum install clickhouse-server.noarch

1. Check status
sudo systemctl status clickhouse-server

2. Stop the server
sudo systemctl stop clickhouse-server

3. Start the server
sudo systemctl start clickhouse-server

Start for executing queries in multiline mode (execute after the sign ";")
clickhouse-client --multiline
clickhouse-client --multiline --host 127.0.0.1 --password pa55w0rd
clickhouse-client --multiline --host 127.0.0.1 --port 9440 --secure --user default --password pa55w0rd

The ClickHouse plugin for Logstash saves the entire batch to the file /tmp/log_web_failed.json in case of an error on a single line.
You can manually fix this file and try to upload it to the database manually:
clickhouse-client --host 127.0.0.1 --password password --query="INSERT INTO log_web FORMAT JSONEachRow" < /tmp/log_web_failed__fixed.json

sudo mv /etc/logstash/tmp/log_web_failed.json /etc/logstash/tmp/log_web_failed__fixed.json
sudo chown user_dev /etc/logstash/tmp/log_web_failed__fixed.json
sudo clickhouse-client --host 127.0.0.1 --password password --query="INSERT INTO log_web FORMAT JSONEachRow" < /etc/logstash/tmp/log_web_failed__fixed.json
sudo mv /etc/logstash/tmp/log_web_failed__fixed.json /etc/logstash/tmp/log_web_failed__fixed_.json

Exit the command line
quit;
## TLS Configuration
https://www.altinity.com/blog/2019/3/5/clickhouse-networking-part-2

openssl s_client -connect log.domain.com:9440 < /dev/null
LogStash. A log router from FileBeat to RabbitMQ queue
This component is used for routing logs coming from FileBeat to the RabbitMQ queue. There are two points here:
- Unfortunately, FileBeat does not have an output plugin for writing directly to RabbitMQ. According to the issues on their GitHub, this functionality is not planned for implementation. There is a plugin for Kafka, but for certain reasons we cannot use it.
- There are requirements for collecting logs in the DMZ. Accordingly, logs must first be accumulated in a queue, and then LogStash reads the entries from the queue externally.
Therefore, in the case of server placement in the DMZ, a somewhat more complicated scheme has to be used. An example configuration looks as follows:
iis_w3c_logs__filebeat_rabbitmq.conf
input {

    beats {
        port => 5044
        type => 'iis'
        ssl => true
        ssl_certificate_authorities => ["/etc/pki/tls/certs/app/ca.pem", "/etc/pki/tls/certs/app/ca-issuing.pem"]
        ssl_certificate => "/etc/pki/tls/certs/app/queue.domain.com.cer"
        ssl_key => "/etc/pki/tls/certs/app/queue.domain.com-pkcs8.key"
        ssl_verify_mode => "peer"
    }

}

output {
  #stdout {codec => rubydebug}

    rabbitmq {
        host => "127.0.0.1"
        port => 5672
        exchange => "monitor.direct"
        exchange_type => "direct"
        key => "%{[fields][fld_app_name]}"
        user => "q-writer"
        password => "password"
        ssl => false
    }
}
RabbitMQ. Message Queue
This component is used for buffering log entries in the DMZ. Writing is performed via the Filebeat → LogStash chain. Reading is done from outside the DMZ through LogStash. When using RabbitMQ, about 4,000 messages are processed per second.
Message routing is configured by system name, i.e., based on FileBeat configuration data. All messages go into one queue. If, for any reason, the queue service is stopped, there will be no loss of messages: FileBeat will receive connection errors and temporarily suspend sending. LogStash, which reads from the queue, will also receive network errors and wait for the connection to be restored. During this time, data will stop being written to the database.
The following instructions are used to create and configure queues:
sudo /usr/local/bin/rabbitmqadmin declare exchange --vhost=/ name=monitor.direct type=direct sudo /usr/local/bin/rabbitmqadmin declare queue --vhost=/ name=web_log durable=true
sudo /usr/local/bin/rabbitmqadmin --vhost="/" declare binding source="monitor.direct" destination_type="queue" destination="web_log" routing_key="site1.domain.ru"
sudo /usr/local/bin/rabbitmqadmin --vhost="/" declare binding source="monitor.direct" destination_type="queue" destination="web_log" routing_key="site2.domain.ru"
Grafana. Dashboards
This component is used for visualizing monitoring data. You need to install the ClickHouse datasource plugin for Grafana 4.6+. We had to tweak it a bit to improve the efficiency of SQL filter processing on the dashboard.
For example, we use variables, and if they are not set in the filter field, we would like it not to generate a condition in the WHERE clause like (uriStem = » AND uriStem != »). In this case, ClickHouse will read the uriStem column. In general, we tried different options and eventually modified the plugin (macro $valueIfEmpty) so that in the case of an empty value it returns 1, without mentioning the column itself.
And now you can use a query like this for the chart
$columns(response, count(*) c) from $table where $adhoc
and $valueIfEmpty($fld_app_name, 1, fld_app_name = '$fld_app_name')
and $valueIfEmpty($fld_app_module, 1, fld_app_module = '$fld_app_module') and $valueIfEmpty($fld_server_name, 1, fld_server_name = '$fld_server_name') and $valueIfEmpty($uriStem, 1, uriStem like '%$uriStem%')
and $valueIfEmpty($clientRealIP, 1, clientRealIP = '$clientRealIP')
which is transformed into the following SQL (note that empty uriStem fields are transformed into simply 1)
SELECT
t,
groupArray((response, c)) AS groupArr
FROM (
SELECT
(intDiv(toUInt32(logdatetime), 60) * 60) * 1000 AS t, response,
count(*) AS c FROM default.log_web
WHERE (logdate >= toDate(1565061982)) AND (logdatetime >= toDateTime(1565061982)) AND 1 AND (fld_app_name = 'site1.domain.ru') AND (fld_app_module = 'web') AND 1 AND 1 AND 1
GROUP BY
t, response
ORDER BY
t ASC,
response ASC
)
GROUP BY t ORDER BY t ASC
Conclusion
The emergence of ClickHouse has been a landmark event in the market. It was hard to imagine that we could suddenly be equipped with a powerful and practical tool for working with big data entirely for free. Undoubtedly, as needs grow (e.g., sharding and replication across multiple servers), the schema will become more complex. But from the initial impressions, working with this database is very pleasant. It's clear that the product is made 'for people.'
Compared to ElasticSearch, the costs of storing and processing logs are estimated to reduce by five to ten times. In other words, if we had to set up a cluster of several machines for the current data volume, with ClickHouse, one low-powered machine is sufficient. Yes, of course, ElasticSearch also has data compression mechanisms on disk and other features that significantly reduce resource consumption, but compared to ClickHouse, this will require greater expenditures.
Without any special optimizations on our part, under default settings, data loading and queries from the database work at an astonishing speed. We currently have a small amount of data (about 200 million records), but the server is weak. This tool can be used in the future for other purposes not related to log storage, such as end-to-end analytics, security, and machine learning.
In conclusion, let's discuss some pros and cons.
Cons
- Loading records in large batches. This is, on one hand, a feature, but it still requires using additional components for buffering records. This task is not always simple, but still solvable, and we'd like to simplify the schema.
- Some exotic functionality or new features often get broken in new versions. This raises concerns, reducing the desire to upgrade to the new version. For instance, the Kafka table engine is a very useful feature that allows direct reading of events from Kafka, without implementing consumers. However, judging by the number of issues on GitHub, we are currently cautious about using this engine in production. Nevertheless, if you don't make abrupt moves and use the core functionality, it works reliably.
Advantages
- Does not slow down.
- Low entry threshold.
- Open-source.
- Free.
- Scales well (sharding/replication "out of the box")
- Included in the register of Russian software recommended by the Ministry of Telecom and Mass Communications.
- Presence of official support from Yandex.
Source: habr.com
