

It's important for us to understand what happens to our students during their learning journey and how these events affect the outcome, which is why we build a Customer Journey Map. The learning process is not a continuous and cohesive entity; it's a chain of interconnected events and student actions, and these actions can vary greatly among different learners. After completing a lesson, what will they do next? Will they tackle their homework? Open the mobile app? Change courses or request a different teacher? Immediately jump into the next lesson? Or will they just leave feeling disillusioned? Can we analyze this map to identify patterns that lead to successful course completion or, conversely, to student drop-off?
Typically, specialized and quite expensive closed-source tools are used to create CJMs. However, we wanted to devise something simple that requires minimal effort and is ideally open-source. Thus, the idea to use Markov chains was born, and it worked out for us. We built a map, interpreted student behavior data as a graph, discovered completely non-obvious answers to global business questions, and even found deeply hidden bugs. We achieved all of this using open-source Python script solutions. In this article, I will discuss two cases with those very non-obvious results and share the script with anyone interested.
So, Markov chains demonstrate the probability of transitions between events. Here’s a simple example from Wikipedia:
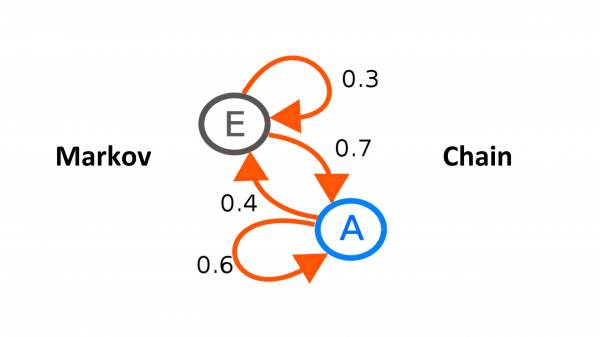
In this case, 'E' and 'A' are events, the arrows represent transitions between them (including transitions from an event to itself), and the weights of the arrows signify the probability of the transition (a 'weighted directed graph').
What was used
The chain was trained using standard Python functionality, which processed student activity logs. The graph based on the resulting matrix was constructed using the NetworkX library.
The log looks like this:
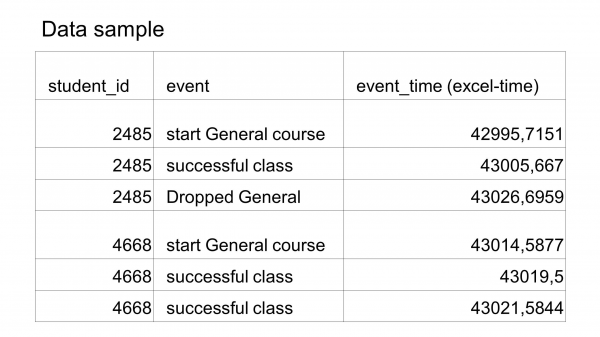
This is a CSV file containing a table with three columns: student ID, event name, and the time when it occurred. These three fields are sufficient to track client movements, build the map, and ultimately create a Markov chain.
The library returns constructed graphs in .dot or .gexf format. To visualize the former, you can use the free Graphviz package (the gvedit tool); we worked with .gexf and Gephi, which is also free.
Next, I want to provide two examples of using Markov chains, which allowed us to rethink our goals, learning processes, and the Skyeng ecosystem itself while also addressing some bugs.
First case: mobile application
To start, we explored the student journey through our most popular product — the General course. At that time, I was working in the children's department at Skyeng and we wanted to see how effectively the mobile application works with our young audience.
By taking logs and running them through a script, I obtained something like this:
The starting node is Start General, and at the bottom, there are three exit nodes: the student 'fell asleep,' changed courses, or finished the course.
- Fell asleep, 'Заснул' — means that the student is no longer attending classes, most likely they have dropped out. We optimistically call this state 'fell asleep' because in theory, they still have the possibility to continue their studies. This is the worst outcome for us.
- Dropped general, Changed course — switched from General to something else and got lost for our Markov chain.
- Finished course, Закончил курс — an ideal state, the person completed 80% of the lessons (not all lessons are mandatory).
Reaching the successful class node indicates successful completion of a lesson on our platform with a teacher. It records progress in the course and movement toward the desired outcome — 'Finished course.' It is important for us that students attend it as much as possible.
To obtain more precise quantitative conclusions for the mobile application (node app session), we constructed separate chains for each of the final nodes and then compared the weights of the edges pairwise:
- from app session back to itself;
- from app session to successful class;
- from successful class to app session.
On the left — students who completed the course, on the right — 'fell asleep.'
These three edges show the relationship between student success and their use of the mobile application. We expected to see that students who finished the course would have a stronger connection with the app than those who 'fell asleep.' However, in practice, we obtained exactly the opposite results:
- we confirmed that different groups of users interact differently with the mobile application.
- successful students use the mobile app less intensively;
- sleepy students use the mobile app more actively.
This means that 'sleepy' students are starting to spend more and more time in the mobile app and eventually stay there permanently.
At first, we were surprised, but after thinking, we realized that this is quite a natural effect. At one time, I learned French on my own using two tools: a mobile app and grammar lectures on YouTube. Initially, I split my time between them in a 50-50 ratio. But the app is more fun; it has gamification, everything is simple, fast, and clear, while the lectures require immersion, note-taking, and practice in a notebook. Gradually, I started spending more time on my smartphone until its share grew to 100%: if you spend three hours in it, you get a false sense of completed work, which makes you unwilling to go and listen to something.
But how is that possible? After all, we specifically created the mobile app, , gamified it, made it attractive so that people would spend time in it, yet it turns out that it only distracts them? The real reason is that the mobile app team did such a good job that it became a cool self-sufficient product and started to fall out of our ecosystem.
As a result of the research, we came to understand that the mobile app needs to be modified to divert less from the main learning course. This applies to both children and adults. This work is currently underway.
Second case: onboarding bugs
Onboarding is an optional additional procedure during the registration of a new student that alleviates potential technical issues in the future. The basic scenario assumes that a person has registered on the landing page, gained access to their personal account, is contacted, and an introductory lesson is conducted. We note a significant percentage of technical difficulties during the introductory lesson: an incompatible browser version, malfunctioning microphone or sound, the teacher being unable to immediately suggest a solution, and all this is especially challenging when it involves children. Therefore, we developed an additional application in the personal account where users can complete four simple steps: check the browser, camera, microphone, and confirm that parents will be present during the introductory lesson (after all, they are the ones paying for their children's education).
These few pages of onboarding showed the following funnel:
1: a starting block with three slightly different (depending on the client) forms for entering the login-password.
2: a checkbox agreeing to the additional onboarding procedure.
2.1-2.3: checking for parental presence, Chrome version, and sound functionality.
3: the final block.
It appears very natural: in the first two steps, most visitors drop off, realizing that they have to fill something out, check things, and that there's no time. If a client reaches the third step — they are almost certain to reach the end. There are no visible reasons in the funnel to suspect anything.
However, we decided to analyze our onboarding not on a classic one-dimensional funnel, but through a Markov chain. We included a bit more events, ran the script, and got this:
One can only definitively understand one thing in this chaos: something went wrong. The onboarding process is linear, which is built into the design, and there should not be such a web of connections. Here, it is immediately clear that the user is being tossed between steps, where there should not be any transitions at all.

There might be two reasons for such a strange picture:
- issues crept into the log database;
- issues are present in the product itself — onboarding.
The first reason likely exists, but checking it is quite labor-intensive, and fixing the logs won't improve the UX. However, if a second reason exists, it needed urgent attention. So, we delved into the nodes to identify edges that shouldn't exist and searched for their causes. We noticed that some users were getting stuck in loops, others were falling from mid-process back to the beginning, and some simply couldn't get past the first two steps. We passed the data to QA, and yes, it turned out there were plenty of bugs in the onboarding process: it was a bit of a makeshift product and hadn't been tested thoroughly enough because no issues were expected. The entire recording process has since changed.
This story showed us an unexpected application of Markov chains in QA.
Try it yourself!
I uploaded my to open access — feel free to use it. The documentation is on GitHub, and you can ask questions here; I'll try to answer them all.
And here are some useful links: , . And here about Markov chains. The graphs in the article were made using .
Source: habr.com
