

Hello everyone! In my I wrote about the organization of a modular monitoring system for a microservices architecture. Nothing stands still; our project is constantly growing, and so is the number of stored metrics. Read below about how we organized the transition from Graphite+Whisper to Graphite+ClickHouse under high load conditions, our expectations from it, and the results of the migration.
Before I explain how we organized the transition from storing metrics in Graphite+Whisper to Graphite+ClickHouse, I would like to provide some information about the reasons for making such a decision and the drawbacks of Whisper that we lived with for an extended period.
Problems with Graphite+Whisper
1. High disk subsystem load
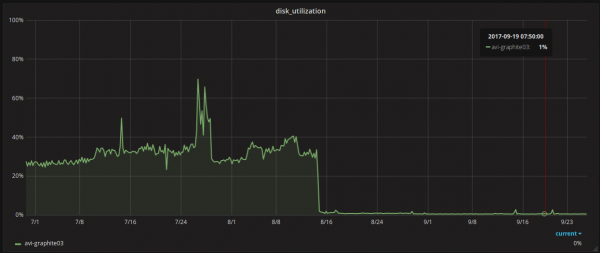
At the time of transition, we were receiving about 1.5 million metrics per minute. With this flow, disk utilization on the servers was around 30%. Overall, this was quite acceptable — everything worked stably, data was written quickly, and read quickly... Until one of the development teams rolled out a new feature and started sending us 10 million metrics per minute. That's when the disk subsystem started to struggle, and we saw 100% utilization. The problem was quickly solved, but the impression lingered.
2. Lack of replication and consistency
Like everyone who uses/used Graphite+Whisper, we sent the same stream of metrics to several Graphite servers to create fault tolerance. There weren't any significant issues until one of the servers went down for some reason. Sometimes we managed to bring the downed server back up quickly enough, and carbon-c-relay managed to push metrics from its cache to it, and sometimes not. That's when there was a gap in the metrics that we patched with rsync. The procedure was quite lengthy. The only saving grace was that this happened very rarely. We also periodically took a random set of metrics and compared them with corresponding ones on neighboring nodes in the cluster. In about 5% of cases, several values differed, which was not very pleasant.
3. Large volume of storage space occupied
Since we write not only infrastructure but also business metrics in Graphite (and now metrics from Kubernetes as well), we often find ourselves in a situation where the metric contains only a few values, while the .wsp file is created with consideration for the entire retention period, occupying the allocated space, which was approximately 2MB. The problem is compounded by the fact that over time, there are many such files, and when generating reports from them, a lot of time and resources are spent reading empty points.
It should be noted immediately that the issues described above can be tackled by various methods with varying degrees of effectiveness, but the more data you start receiving, the more acute they become.
Considering all of the aforementioned (taking into account the previous ), as well as the constant increase in the number of metrics received, and the desire to reduce all metrics to a storage interval of 30 seconds (if necessary — up to 10 seconds), we decided to try Graphite+ClickHouse as a promising alternative to Whisper.
Graphite+ClickHouse. Expectations
Having attended several meetups with the Yandex team, reading , combing through the documentation and finding reasonable components to bind ClickHouse to Graphite, we decided to take action!
We wanted the following:
- to reduce disk subsystem utilization from 30% to 5%;
- to reduce the occupied space from 1TB to 100GB;
- to handle 100 million metrics per minute on the server;
- data replication and fault tolerance out of the box;
- to not spend a year on this project and to make the transition in a reasonable timeframe;
- to switch over without downtime.
Quite ambitious, isn’t it?
Graphite+ClickHouse. Components
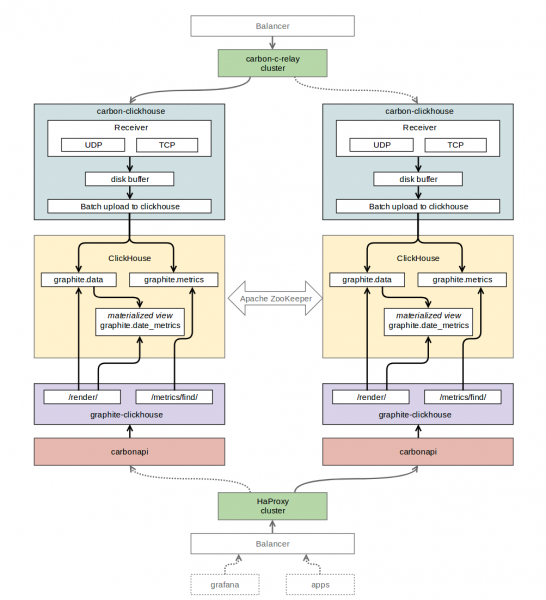
To receive data via the Graphite protocol and subsequently write it to ClickHouse, we chose (golang).
As the database for storing time series, we selected the latest stable release of ClickHouse version 1.1.54253 at that time. When working with it, there were issues: a heap of errors flooded the logs, and it wasn’t entirely clear what to do about them. In discussions with (author of carbon-clickhouse, graphite-clickhouse, and much more), we opted for an older The errors disappeared — everything started working flawlessly.
For reading data from ClickHouse, we chose (golang). As the API interface for Graphite — (golang). To organize replication between ClickHouse tables, we used . For routing metrics, we kept our beloved (C) .
Graphite+ClickHouse. Table structure
“graphite” — the database we created for monitoring tables.
“graphite.metrics” — a table with the ReplicatedReplacingMergeTree engine (replicated ). This table stores metric names and their paths.
CREATE TABLE graphite.metrics ( Date Date, Level UInt32, Path String, Deleted UInt8, Version UInt32 ) ENGINE = ReplicatedReplacingMergeTree('\/clickhouse\/tables\/replicator\/graphite.metrics', 'r1', Date, (Level, Path), 8192, Version);“graphite.data” — a table with the ReplicatedGraphiteMergeTree engine (replicated ). This table stores metric values.
CREATE TABLE graphite.data ( Path String, Value Float64, Time UInt32, Date Date, Timestamp UInt32 ) ENGINE = ReplicatedGraphiteMergeTree('\/clickhouse\/tables\/replicator\/graphite.data', 'r1', Date, (Path, Time), 8192, 'graphite_rollup')“graphite.date_metrics” — a conditionally populated table with the ReplicatedReplacingMergeTree engine. This table records the names of all metrics encountered throughout the day. The reasons for its creation are described in the section at the end of this article.
CREATE MATERIALIZED VIEW graphite.date_metrics ( Path String, Level UInt32, Date Date) ENGINE = ReplicatedReplacingMergeTree('\/clickhouse\/tables\/replicator\/graphite.date_metrics', 'r1', Date, (Level, Path, Date), 8192) AS SELECT toUInt32(length(splitByChar('.', Path))) AS Level, Date, Path FROM graphite.data“graphite.data_stat” — a conditionally populated table with the ReplicatedAggregatingMergeTree engine (replicated ). This table records the count of incoming metrics, broken down to a maximum depth of 4.
CREATE MATERIALIZED VIEW graphite.data_stat ( Date Date, Prefix String, Timestamp UInt32, Count AggregateFunction(count)) ENGINE = ReplicatedAggregatingMergeTree('\/clickhouse\/tables\/replicator\/graphite.data_stat', 'r1', Date, (Timestamp, Prefix), 8192) AS SELECT toStartOfMonth(now()) AS Date, replaceRegexpOne(Path, '^([^.]+.[^.]+.[^.]+).*$', '1') AS Prefix, toUInt32(toStartOfMinute(toDateTime(Timestamp))) AS Timestamp, countState() AS Count FROM graphite.data GROUP BY Timestamp, PrefixGraphite+ClickHouse. Component interaction scheme
Graphite+ClickHouse. Data migration
As we remember from expectations for this project, the transition to ClickHouse should occur without downtime, accordingly, we needed to somehow switch our entire monitoring system to the new storage as transparently as possible for our users.
We did this as follows.
In carbon-c-relay, we added a rule to send an additional stream of metrics to carbon-clickhouse from one of the servers involved in replicating ClickHouse tables.
We wrote a small script in Python that used the whisper-dump library to read all .wsp files from our storage and sent this data to the aforementioned carbon-clickhouse in 24 threads. The number of metric values received by carbon-clickhouse reached 125 million/min, and ClickHouse didn’t break a sweat.
We created a separate DataSource in Grafana for debugging the functions used in the existing dashboards. We identified a list of functions that we utilized but were not implemented in carbonapi. We added these functions and sent pull requests to the authors of carbonapi (special thanks to them).
- To switch the reading load in the load balancer settings, we changed the endpoints from graphite-api (API interface for Graphite + Whisper) to carbonapi.
Graphite + ClickHouse. Results
reduced disk subsystem utilization from 30% to 1%;

- reduced space usage from 1 TB to 300 GB;
- we can now accept up to 125 million metrics per minute to the server (peaks during migration);
- we moved all metrics to a thirty-second storage interval;
- achieved data replication and fault tolerance;
- switched without downtime;
- we spent about 7 weeks on everything.
Graphite + ClickHouse. Issues
In our case, we encountered some pitfalls. Here’s what we faced after the transition.
- ClickHouse doesn’t always reload configs on the fly; sometimes it needs to be restarted. For example, in the case of the zookeeper cluster description in the ClickHouse config—it didn’t apply until the clickhouse-server was restarted.
- Large ClickHouse queries were not processing, so our connection string to ClickHouse in graphite-clickhouse looks like this:
url = "http://localhost:8123/?max_query_size=268435456&max_ast_elements=1000000" - New stable releases of ClickHouse frequently come out, and they may contain surprises: be careful.
- Dynamically created containers in Kubernetes send a large number of metrics with short and random lifespans. There aren't many points for such metrics, and there are no space issues. However, when constructing queries, ClickHouse retrieves a huge quantity of these metrics from the 'metrics' table. In 90% of cases, data for them is missing within the time window (24 hours). The time spent searching for this data in the 'data' table adds up and eventually hits a timeout. To solve this problem, we started maintaining a separate view with information on the metrics encountered over the day. Thus, when generating reports (charts) for dynamically created containers, we query only those metrics that appeared within the specified window, rather than those over the entire time period, which has significantly accelerated the generation of reports for them. The above solution involved assembling , which includes the implementation of working with the date_metrics table.
Graphite+ClickHouse. Tags
Since version 1.1.0, Graphite has officially . And we are actively thinking about how to support this initiative in the graphite+clickhouse stack.
Graphite+ClickHouse. Anomaly Detector
Based on the above infrastructure, we implemented a prototype of an anomaly detector, and it works! But more on that in the next article.
Subscribe, hit the thumbs up, and be happy!
Source: habr.com
