

Today, in our project, alongside monolithic code, dozens of microservices are operational. Each of them requires monitoring. Doing this in such volumes with DevOps engineers is problematic. We have developed a monitoring system that works as a service for developers. They can independently write metrics to the monitoring system, use them, build dashboards based on them, and attach alerts that will trigger upon reaching threshold values. For DevOps engineers, it's just infrastructure and documentation.
This post is a transcript of my presentation from our at RIT++. Many have asked us to provide text versions of the talks from there. If you attended the conference or watched the video, you won't find anything new. To everyone else — welcome below the fold. I'll explain how we arrived at this system, how it works, and how we plan to update it.

The Past: Schemes and Plans
How did we come to the existing monitoring system? To answer this question, we need to go back to 2015. Here's how it looked back then:
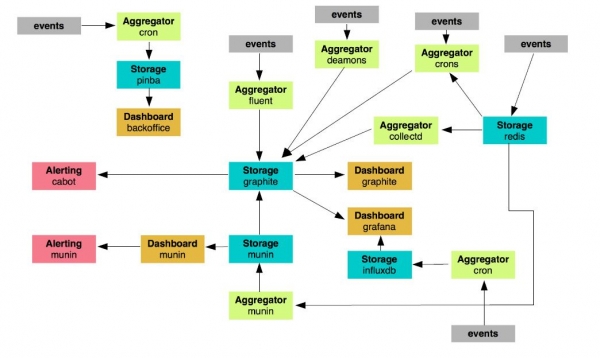
We had about 24 nodes responsible for monitoring. There was a whole bunch of various crons, scripts, daemons, that monitored something somewhere in some way, sent messages, and performed functions. We thought that the further we went, the less viable such a system would be. It made no sense to develop it: it was too cumbersome.
We decided to select the elements of monitoring that we would keep and develop, and those we would abandon. There ended up being 19. We kept only Graphite, aggregators, and Grafana as the dashboard. But what would the new system look like? Like this:
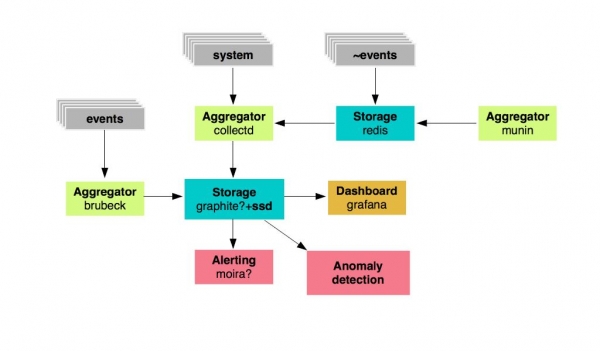
We have a metrics storage: these are Graphite, which will be based on fast SSD drives, and specific aggregators for metrics. Next — Grafana for displaying dashboards and Moira for alerting. We also wanted to develop a system for anomaly detection.
Standard: Monitoring 2.0
These were the plans in 2015. But we needed to prepare not only the infrastructure and the service itself but also documentation for it. We developed a corporate standard for ourselves, which we called Monitoring 2.0. What were the requirements for the system?
- constant availability;
- metric storage interval = 10 seconds;
- structured storage of metrics and dashboards;
- SLA > 99.99%
- collection of event metrics via UDP (!).
We needed UDP because we have a large volume of traffic and events that generate metrics. If we tried to write them all to Graphite at once, the storage would crash. We also chose first-level prefixes for all metrics.
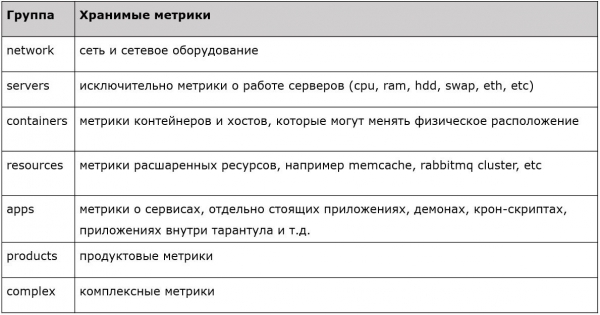
Each prefix carries a specific property. There are metrics for servers, networks, containers, resources, applications, and so on. A clear, strict, typed filtering system is implemented where we accept first-level metrics and simply drop the rest. This is how we planned this system back in 2015. What about the present?
Present: the interaction scheme of monitoring components
First and foremost, we monitor applications: our PHP code, applications, and microservices — in short, everything that our developers create. All applications send metrics to the Brubeck aggregator via UDP (statsd, rewritten in C). It turned out to be the fastest based on synthetic test results. It sends the already aggregated metrics to Graphite via TCP.
It includes a type of metrics known as timers. This is a very convenient tool. For instance, for each user connection to the service, you send a metric with the response time to Brubeck. A million responses came in, but the aggregator produced only 10 metrics. You have the total number of users, maximum, minimum, and average response times, the median, and four percentiles. Then, the data is transmitted to Graphite, and we see everything live.
We also have aggregation for metrics on hardware, software, system metrics, and our old monitoring system Munin (which was in use until 2015). We collect all of this using the C daemon CollectD (which includes a whole batch of various plugins, allowing it to poll all resources of the host system it’s installed on; you just need to specify in the configuration where to write the data) and send the data to Graphite through it. It also supports Python and shell script plugins, so you can create your custom solutions: CollectD will gather this data from a local or remote host (let's say there's Curl) and send it to Graphite.
Next, we send all the metrics we've collected to Carbon-c-relay. This is the Carbon Relay solution from Graphite, developed in C. It acts as a router that gathers all metrics from our aggregators and routes them to nodes. During the routing process, it also validates the metrics. Firstly, they must match the prefix schema I showed earlier, and secondly, they must be valid for Graphite; otherwise, they are dropped.
Then, Carbon-c-relay sends the metrics to the Graphite cluster. We use Carbon-cache, rewritten in Go, as the main metric storage. Go-carbon, due to its multithreading capabilities, outperforms Carbon-cache significantly in terms of performance. It ingests data and writes it to disks using the whisper package (the standard one, written in Python). To read data from our storage systems, we leverage the Graphite API, which operates much faster than the standard Graphite WEB. What happens to the data next?
They go to Grafana. We use our Graphite clusters as the main data source, plus we have Grafana as a web interface for displaying metrics and creating dashboards. Developers set up their own dashboards for each of their services. They then build graphs on these dashboards displaying metrics sent from their applications. Besides Grafana, we also have SLAM. This is a Python daemon that calculates SLA based on data from Graphite. As I mentioned, we have several dozen microservices, each with its own requirements. With SLAM, we refer to the documentation and compare it with what’s in Graphite to assess how well the requirements align with the availability of our services.
Moving on: alerting. It is organized using a robust system — Moira. It operates independently because it has its own Graphite running underneath. Developed by the guys from SKB Kontur, it is written in Python and Go and is completely open-source. Moira receives the same data stream that goes to the Graphites. If, for any reason, your storage fails, your alerting will still function.
We deployed Moira in Kubernetes, using a cluster of Redis servers as its primary database. As a result, it became a fault-tolerant system. It compares a stream of metrics against a list of triggers: if there are no mentions, it drops the metric. This allows it to process gigabytes of metrics per minute.
We also integrated corporate LDAP with it, allowing each user of the corporate system to create notifications for existing (or newly created) triggers. Since Moira includes Graphite, it supports all its features. Therefore, you first take a line and copy it into Grafana to see how the data displays on the graphs. Then, you take the same line and copy it into Moira, attach limits, and obtain alerts. You don't need any specific knowledge to do all this. Moira can alert via SMS, email, Jira, Slack... It also supports executing custom scripts. When a trigger occurs and it is subscribed to a custom script or binary, it executes it and sends JSON to that binary via stdin. Consequently, your program must parse it. What you do with this JSON is up to you. You can send it to Telegram, open tasks in Jira, do whatever you want.
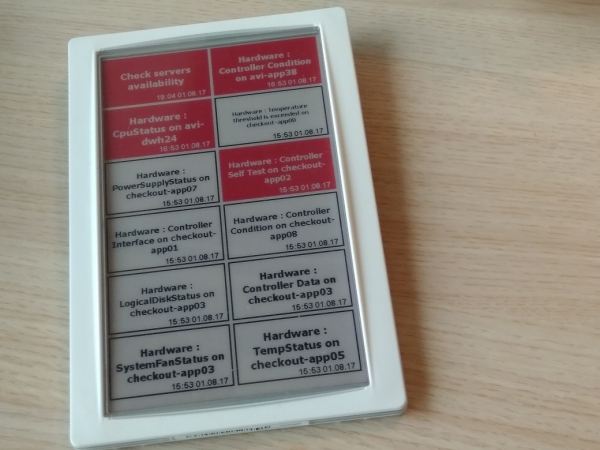
We also use our own development for alerting — Imagotag. We adapted a panel typically used for electronic price tags in stores to fit our needs. We displayed the triggers from Moira on it, indicating their status and when they occurred. Some of our developers opted out of Slack and email notifications in favor of this panel.
And since we are a progressive company, we also monitored Kubernetes in this system. We integrated it using Heapster, which we installed in the cluster. It collects data and sends it to Graphite. Ultimately, the diagram looks like this:
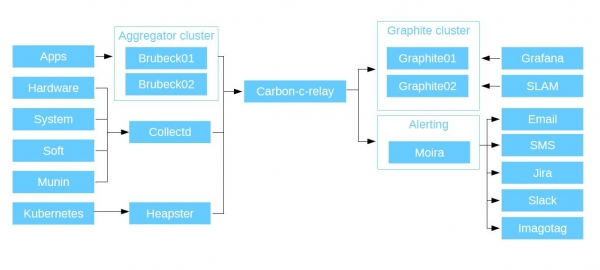
Monitoring Components
Here is a list of links to the components we used for this task. All of them are open-source.
Graphite:
- go-carbon:
- whisper:
- graphite-api:
Carbon-c-relay:
Brubeck:
Collectd:
Moira:
Grafana:
Heapster:
Statistics
Here are some statistics on how our system operates.
Aggregator (brubeck)
Number of metrics: ~ 300,000 / sec
Metrics sending interval to Graphite: 30 sec
Server resource usage: ~ 6% CPU (referring to full servers); ~ 1Gb RAM; ~ 3 Mbps LAN
Graphite (go-carbon)
Number of metrics: ~ 1,600,000 / min
Metrics update interval: 30 sec
Metrics storage scheme: 30sec 35d, 5min 90d, 10min 365d (provides understanding of what happens with the service over a prolonged period)
Server resource usage: ~ 10% CPU; ~ 20Gb RAM; ~ 30 Mbps LAN
doesn’t stop at one thing, like Yandex.Metrica, but evolves and is used in an increasing number of different projects and industries. It can be expanded by adding new features to address new tasks. For instance, it is often believed that storing logs in a DB is outdated, which is why
At Avito, we highly value the flexibility in our monitoring service. Why did it turn out this way? Firstly, its components are interchangeable: both the modules themselves and their versions. Secondly — maintainability. Since the entire project is built on open source, you can edit the code, make changes, and implement features that are not available out of the box. It uses fairly common stacks, mainly Go and Python, so this is quite straightforward.
Here’s an example of a real issue that arose. A metric in Graphite is a file. It has a name. The file name = the metric name. And there is a path to it. File names in Linux are limited to 255 characters. We have (acting as "internal customers") folks from the database department. They tell us, "We want to monitor our SQL queries. However, they are not 255 characters but 8 MB each. We want them displayed in Grafana, to see parameters for this query, and even better, we want to see the top such queries. It would be great if it could be displayed in real-time. And it would be even cooler to push them into alerting."
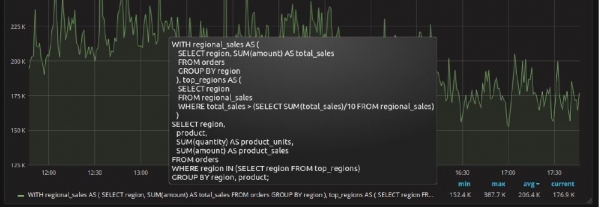
An example SQL query is taken as an example from
We set up a Redis server along with our Collectd plugins that connect to Postgres to fetch all data, sending metrics to Graphite. However, we replace the metric name with hashes. This same hash is also sent to Redis as a key, and the entire SQL query is used as the value. Now we need to ensure that Grafana can access Redis and retrieve this information. We open the Graphite API, as it is the primary interface for all monitoring components to interact with Graphite, and we implement a new function called aliasByHash(). We get the metric name from Grafana and use it in the Redis query as the key, retrieving the value associated with that key, which is our 'SQL query'. This allows us to display the SQL query in Grafana, which theoretically should not have been possible, along with the related statistics (calls, rows, total_time, …).
Summary
Availability. Our monitoring service is available 24/7 from any application and any code. If you have access to the storage, you can write data to the service. The language doesn’t matter, the solutions don’t matter. You only need to know how to open a socket, send a metric through it, and close the socket.
Reliability. All components are fault-tolerant and handle our loads well.
Low entry threshold. To use this system, you don’t need to learn programming languages or make queries in Grafana. Just open your application, plug in the socket that will send metrics to Graphite, close it, open Grafana, create dashboards there, and monitor your metrics’ behavior, receiving notifications through Moira.
Independence. All of this can be done independently, without the help of DevOps engineers. This is an overshoot, as you can monitor your project right now without needing to ask anyone — neither to start working nor for modifications.
What are we striving for?
All of the points listed below are not just abstract thoughts; they represent what we have made at least initial strides towards.
- Anomaly detector. We want to create a service that will go into our Graphite storage and check each metric against various algorithms. We already have the algorithms we want to review, and we have the data; we know how to work with it.
- Metadata. We have many services, which change over time, just like the people who work with them. Keeping documentation manually is not an option. Therefore, our microservices are now embedding metadata. It specifies who developed it, the languages it interacts with, SLA requirements, and where to send notifications. During the service deployment, all the entity data is created automatically. As a result, you get two links — one for triggers and the other for dashboards in Grafana.
- Monitoring in every home. We believe that every developer should use such a system. In this case, you always know where your traffic is, what is happening with it, where it drops, and where its weaknesses lie. If, for example, something happens and overwhelms your service, you will find out not during a call from a manager but from an alert, and you can immediately open the latest logs and see what happened.
- High performance. Our project is constantly growing, and today it processes about 2,000,000 metric values per minute. A year ago, this figure was 500,000. And the growth continues, which means that after some time Graphite (whisper) will start to significantly strain the storage subsystem. As I mentioned earlier, this monitoring system is quite versatile due to the interchangeability of components. Some maintain and constantly expand their infrastructure specifically for Graphite, but we decided to take a different route: to use as a storage for our metrics. This transition is nearly complete, and soon I will share more details about how it was done: what challenges were faced and how they were overcome, how the migration process went, and describe the selected components and their configurations.
Thank you for your attention! Please ask your questions on the topic, and I will try to answer them here or in future posts. Perhaps someone has experience building a similar monitoring system or migrating to Clickhouse in a similar situation — feel free to share in the comments.
Source: habr.com
