

Hello everyone! A few months ago, we launched our new open-source project in production — a Grafana plugin for monitoring Kubernetes, which we named . The source code of the plugin is available in . In this article, we want to share our story about how we created the plugin, what tools we used, and the pitfalls we encountered during the development process. Let’s dive in!
Part 0 — Introduction: How Did We Get Here?
The idea of creating our own plugin for Grafana came to us quite by chance. Our company has been monitoring web projects of various complexities for over 10 years. During this time, we accumulated a wealth of expertise, interesting cases, and experience using various monitoring systems. At some point, we wondered: “Is there a magic tool for monitoring Kubernetes that allows you to setup and forget it?” The industry standard for monitoring k8s is, of course, the Prometheus + Grafana duo. There are numerous tools available as ready-made solutions for this stack: prometheus-operator, a set of dashboards kubernetes-mixin, grafana-kubernetes-app.
The most interesting option for us seemed to be the grafana-kubernetes-app plugin, but it hasn't been supported for over a year and, moreover, it cannot work with the new versions of node-exporter and kube-state-metrics. At some point, we decided: “Should we create our own solution?”
The ideas we decided to implement in our plugin were:
- visualization of the 'application map': a convenient representation of applications in the cluster, grouped by namespaces, deployments…;
- visualization of connections of the kind 'deployment — service (+ports)'.
- visualization of the distribution of cluster applications across the cluster nodes.
- collecting metrics and information from multiple sources: Prometheus and the k8s API server.
- monitoring both the infrastructure part (CPU time, memory, disk subsystem, network usage) and application logic — health status of pods, number of available replicas, information about liveness/readiness probes.
Part 1: What is a 'Grafana Plugin'?
From a technical perspective, a Grafana plugin is an Angular controller that is stored in the data directory of Grafana (/var/grafana/plugins/<your_plugin_name>/dist/module.js) and can be loaded as a SystemJS module. Additionally, a file named plugin.json must be present in this directory, containing all the metadata about your plugin: name, version, plugin type, links to repository/site/license, dependencies, and so on.
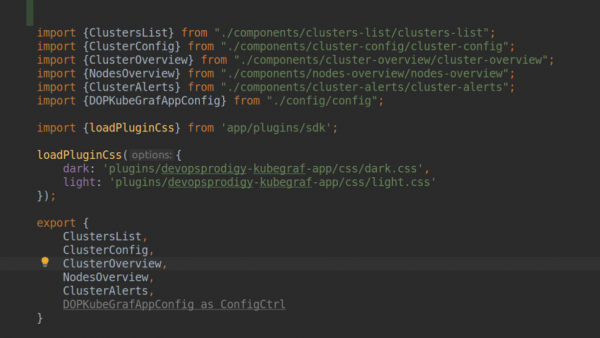
module.ts
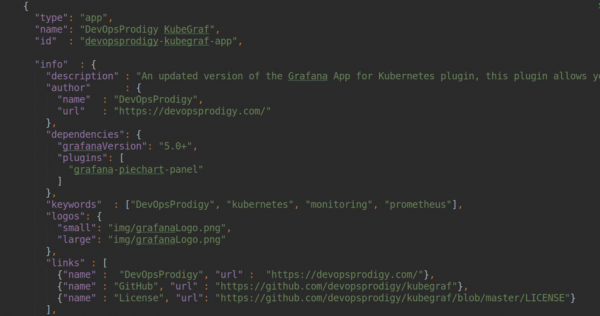
plugin.json
As shown in the screenshot, we specified plugin.type = app. This is because plugins for Grafana can be of three types:
panel: the most common type of plugins — represents a panel for visualizing some metrics, used to create various dashboards.
datasource: a plugin-connector to some data source (for example, Prometheus-datasource, ClickHouse-datasource, ElasticSearch-datasource).
app: a plugin that allows you to build your own frontend application within Grafana, create your own HTML pages, and manually access datasource to visualize various data. Plugins of other types (datasource, panel) and various dashboards can also be used as dependencies.
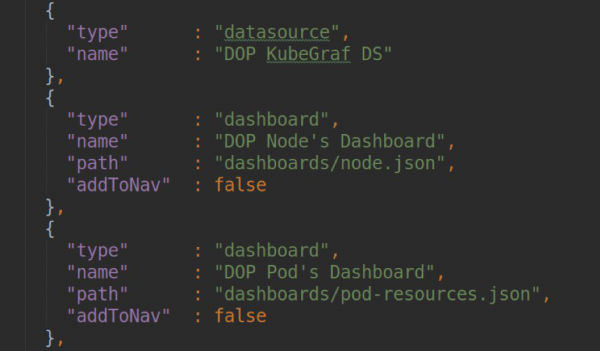
Example of plugin dependencies with type = app.
You can use either JavaScript or TypeScript as the programming language (we chose TypeScript). Templates for hello-world plugins of any type can be : this repository contains a large number of starter packs (there's even an experimental example of a plugin in React) with pre-installed and configured builders.
Part 2: preparing the local environment
To work on the plugin, we will, of course, need a Kubernetes cluster with all the pre-installed tools: prometheus, node-exporter, kube-state-metrics, grafana. The environment should set up quickly, easily, and effortlessly, and to ensure hot-reload, the data directory of Grafana must be mounted directly from the developer's machine.
In our opinion, the most convenient way to work locally with Kubernetes is . The next step is to install the Prometheus + Grafana bundle using prometheus-operator. The process of installing prometheus-operator on minikube is described in detail. To enable persistence, you must set the parameter persistence: true in the file charts/grafana/values.yaml, add your own PV and PVC, and specify them in the persistence.existingClaim parameter.
Our final minikube startup script looks like this:
minikube start --kubernetes-version=v1.13.4 --memory=4096 --bootstrapper=kubeadm --extra-config=scheduler.address=0.0.0.0 --extra-config=controller-manager.address=0.0.0.0
minikube mount
/home/sergeisporyshev/Projects/Grafana:/var/grafana --gid=472 --uid=472 --9p-version=9p2000.L
Part 3: Development
Object Model
To prepare for the plugin implementation, we decided to describe all the basic Kubernetes entities we will work with in the form of TypeScript classes: pod, deployment, daemonset, statefulset, job, cronjob, service, node, namespace. Each of these classes inherits from a common base class, BaseModel, which describes the constructor, destructor, methods for updating, and toggling visibility. Each class defines nested relationships with other entities, such as the list of pods for a deployment entity.
import {Pod} from "./pod";
import {Service} from "./service";
import {BaseModel} from './traits/baseModel';

export class Deployment extends BaseModel{
   pods: Array;
   services: Array;

   constructor(data: any){
       super(data);
       this.pods = [];
       this.services = [];
   }
}
Using getters and setters, we can output or set the necessary metrics of entities in a convenient and readable format. For example, the formatted output of allocatable CPU of a node:
get cpuAllocatableFormatted(){
   let cpu = this.data.status.allocatable.cpu;
   if(cpu.indexOf('m') > -1){
       cpu = parseInt(cpu)/1000;
   }
   return cpu;
}
Pages
The list of all pages of our plugin is initially described in our pluing.json in the dependencies section:
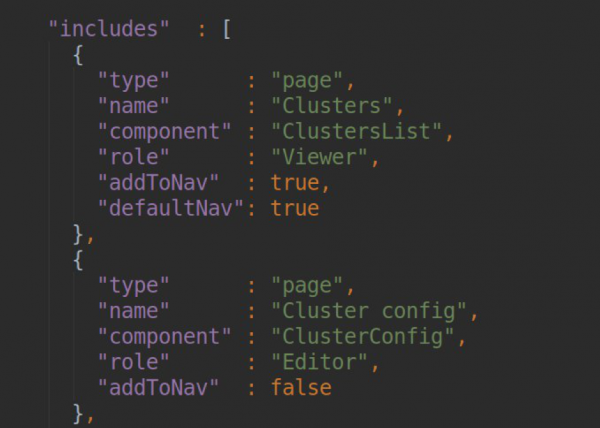
In the block for each page, we must specify the PAGE TITLE (which will then be converted to a slug, by which this page will be accessible); the name of the component responsible for this page's operation (the list of components is exported in module.ts); and the user role for which access to this page and navigation settings for the sidebar is available.
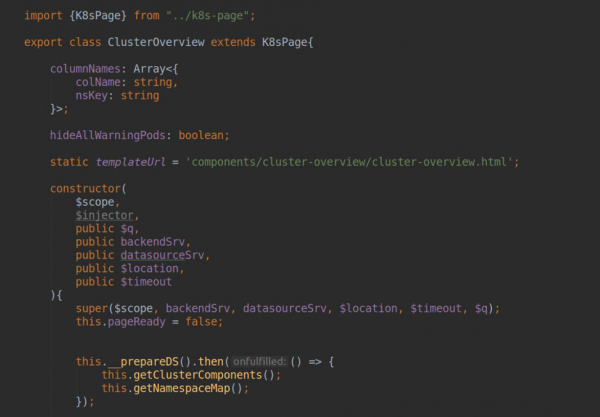
In the component responsible for the page, we must set templateUrl, passing the path to the HTML file with the markup. Inside the controller, through dependency injection, we can access two important Angular services:
- backendSrv — the service that interacts with the Grafana API server;
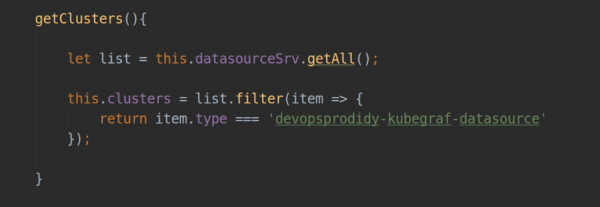
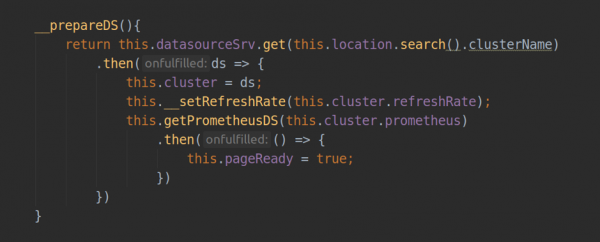
- datasourceSrv — the service that provides local interaction with all datasources installed in your Grafana (for example, the .getAll() method returns a list of all installed datasources; .get() returns the object-instance of a specific datasource.
Part 4: Datasource
From Grafana's perspective, a datasource is just like any other plugin: it has its own entry point module.js and a metadata file plugin.json. When developing a plugin with type = app, we can interact with existing datasources (for example, prometheus-datasource) as well as our own, which we can store directly in the plugin directory (dist/datasource/*) or install as a dependency. In our case, the datasource is included with the plugin code. It is also mandatory to have a config.html template and a ConfigCtrl controller, which will be used for configuring the datasource instance page, along with the Datasource controller that implements the logic for your datasource.
In the KubeGraf plugin, from a user interface perspective, a datasource is an instance of a Kubernetes cluster that offers the following capabilities (the source code is available ):
- retrieving data from the k8s api-server (obtaining a list of namespaces, deployments…)
- proxying requests to prometheus-datasource (which is selected in the plugin settings for each specific cluster) and formatting responses for use in both static pages and dashboards.
- updating data on static plugin pages (with a set refresh rate).
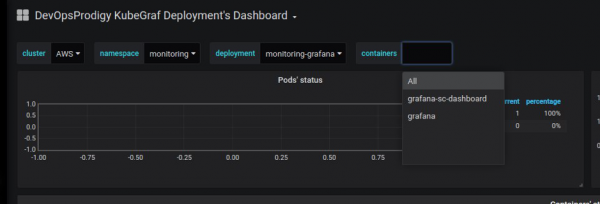
- handling requests to generate the template list in grafana-dashboards (method .metriFindQuery())
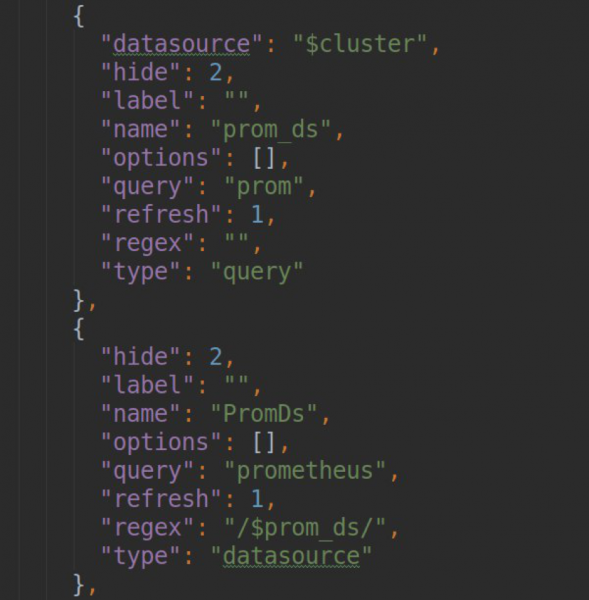
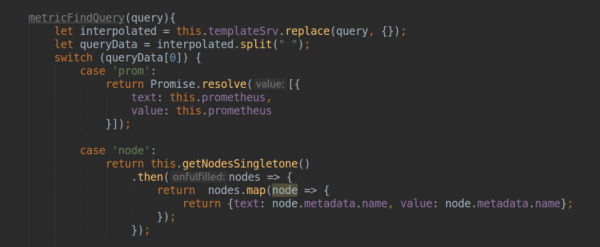
- testing the connection to the target k8s cluster.
testDatasource() {
   let url = '/api/v1/namespaces';
   let _url = this.url;
   if(this.accessViaToken)
       _url += '/__proxy';
   _url += url;
   return this.backendSrv.datasourceRequest({
       url: _url,
       method: "GET",
       headers: {"Content-Type": 'application/json'}
   })
       .then(response => {
           if (response.status === 200) {
               return {status: "success", message: "Data source is OK", title: "Success"};
           } else {
               return {status: "error", message: "Data source is not OK", title: "Error"};
           }
       }, error => {
           return {status: "error", message: "Data source is not OK", title: "Error"};
       })
}
An interesting aspect, in our opinion, is the implementation of the authentication and authorization mechanism for the datasource. Generally, out of the box, we can use the built-in Grafana component — datasourceHttpSettings — to configure access to the final data source. With this component, we can set up access to the HTTP data source by specifying the URL and basic authentication/authorization settings: username-password, or client-cert/client-key. To enable the configuration of access using a bearer token (the de facto standard for k8s), we had to do some tweaking.
To solve this task, you can use the built-in Grafana mechanism "Plugin Routes" (more details on ). In the settings of our datasource, we can declare a set of routing rules that will be processed by the Grafana proxy server. For example, for each individual endpoint, there is a possibility to specify headers or URLs with templating options, with data that can be taken from the jsonData and secureJsonData fields (to store passwords or tokens in an encrypted form). In our example, requests like /__proxy/api/v1/namespaces will be proxied to a URL like
/api/v1/namespaces with the Authorization: Bearer header being set.
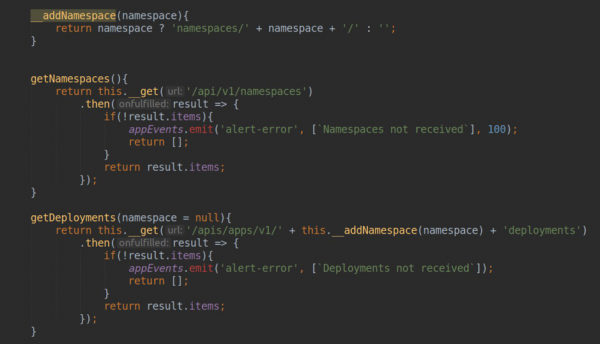
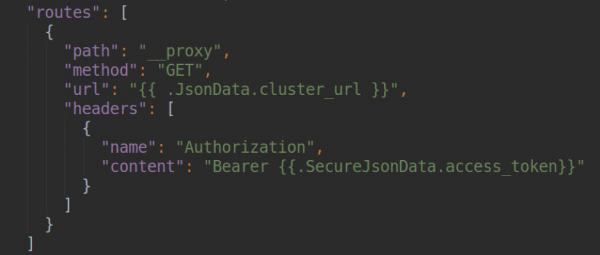
Naturally, to work with the k8s API server, we need a user with readonly access, the manifests for which you can also find in .
Part 5: Release

After you write your own plugin for Grafana, you will naturally want to publish it publicly. In Grafana, there is a plugin library available at
To ensure your plugin is available in the official store, you need to make a PR to , adding in the repo.json file content like:
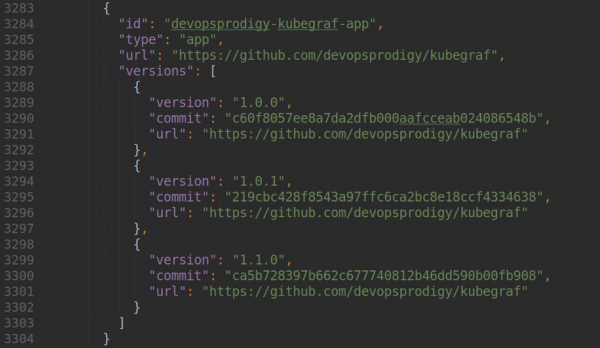
where version is the version of your plugin, url is the link to the repository, and commit is the commit hash for the particular version of the plugin.
And in the end, you will see a wonderful image like:
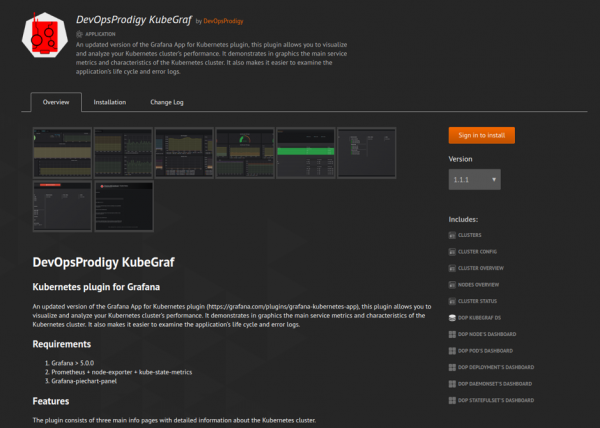
The data for it will be automatically scraped from your Readme.md, Changelog.md, and the plugin.json file that describes the plugin.
Part 6: Conclusions
We have not stopped developing our plugin since its release. We are currently working on accurate monitoring of resource usage in cluster nodes, implementing new features to enhance UX, and addressing a large amount of feedback received after the plugin's installations from both our clients and issues on GitHub (if you leave your issue or pull request, I would be very happy 🙂 ).
We hope this article will help you understand such a wonderful tool as Grafana and possibly write your own plugin.
Thank you!)
Source: habr.com
