

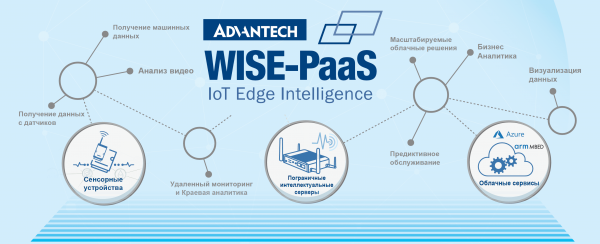
WISE-PaaS — (Platform as a Service) Advantech's cloud platform for the industrial Internet of Things, integrating various tools for data collection, processing, visualization, automation, and management of devices and artificial intelligence and machine learning systems. The platform comprises several ready-made software solutions for building complex systems in industries such as healthcare, manufacturing, logistics, and more.
The WISE/PaaS platform can operate on the infrastructure of cloud providers like Amazon Web Services (AWS), Google Cloud Platform (GCP), and Microsoft Azure, as well as locally on OpenStack.
This article discusses some of the software products in the WISE/PaaS suite that enable faster application development without the distraction of building infrastructure. It supports the deployment of applications in popular languages: Java, .NET, Ruby on Rails, Node.js, Grails, Scala on Lift, Python, PHP, as well as major database engines like MySQL, MongoDB, PostgreSQL, Redis, RabbitMQ. For data visualization, the Grafana framework is available. A separate set of software tools for embedded systems simplifies the initial device setup, firmware updates, and data collection from IoT devices.
Application Marketplace
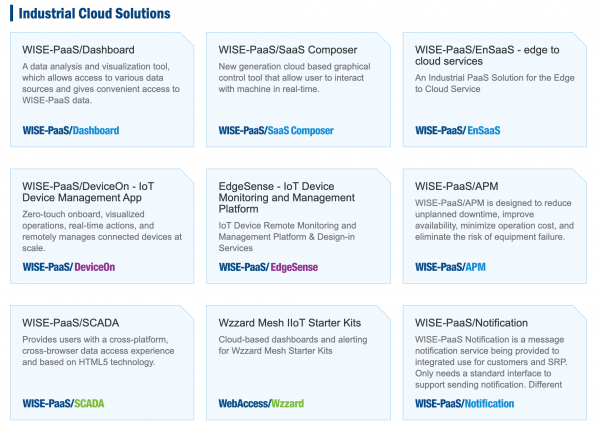
The platform features a builder with various tools that can be purchased as needed in . Among the offered solutions are both Advantech's proprietary products and those of partners. A trial free period is available for some Advantech products.
Software solutions in the marketplace are divided into several main categories based on their purpose:
- — orchestrator, monitoring, backup
- — firmware updates, data collection from devices, monitoring, automated configuration
- — intrusion detection and prevention systems (IPS/IDS), antivirus
- — artificial intelligence, machine learning, and machine vision systems.
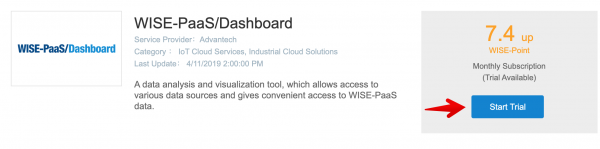
To start a free trial, you need to register on the WISE/PaaS portal and create a trial subscription. To do this, select the product of interest in the marketplace and click Start Trial.
The address of the portal for system access will depend on the data center you select during registration. Currently, Azure (Hong Kong, Beijing) and Alibaba Cloud (Hangzhou) data centers are available.
The entry point addresses are as follows:
(Azure HK)
(Azure HK2)
.cn (Azure BJ)
(Alibaba)
You need to log into the control panel using the credentials received via email after you created the trial period.
WISE-PaaS/Dashboard
WISE-PaaS/Dashboard is a set of tools for data visualization based on the . It is commonly used to create graphs, charts, and visual representations of processes occurring over extended periods. In addition to industrial use, it can be used for monitoring climate processes, in smart home systems, and healthcare.
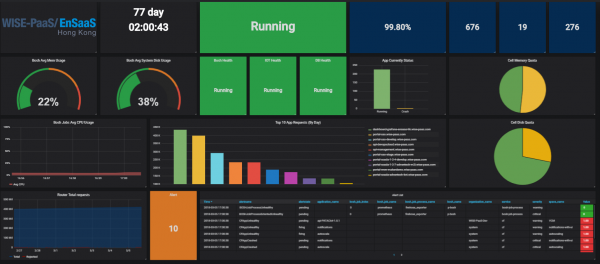
The WISE-PaaS/Dashboard data visualization platform
Widgets
The Grafana framework offers numerous data display options: tables, graphs, charts, heatmaps, and more. You can create a full-fledged dashboard for displaying various data almost without programming skills, and widgets can be added using a mouse.
The widget addition interface for Grafana on the dashboard
In addition to built-in widgets, you can install third-party plugins for integration with other systems. For instance, the plugin for the Zabbix monitoring system allows you to import data from it and display monitoring system notifications.
Thus, WISE-PaaS/Dashboard allows you to combine data from various sources to display them in a single panel.
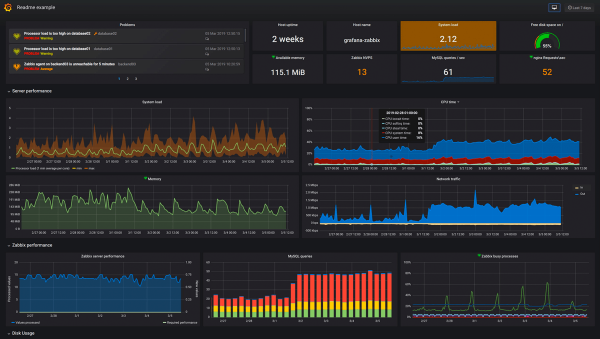
Data from the Zabbix monitoring system in the Grafana interface
Data Sources
The dashboard can receive data for display from various sources. Currently, the supported databases are: CloudWatch, Elasticsearch, Graphite, InfluxDB, MySQL, OpenTSDB, PostgreSQL, Prometheus, RMM-SimpleJson, SCADA-SimpleJson, SimpleJson. In addition to these databases, you can configure any request format to collect data from different sources. A test dataset is also available for learning the system.
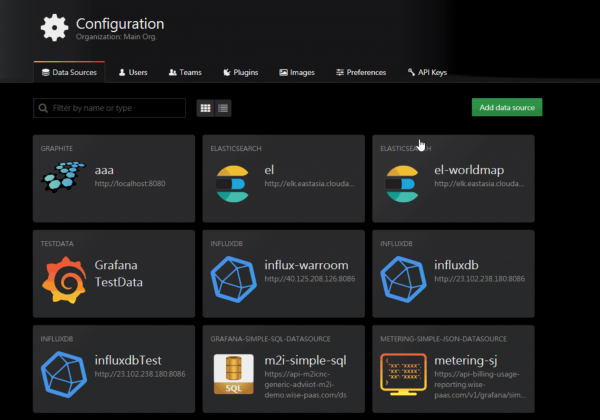
Grafana supports various data sources
Anomaly notifications
To react to specific events, the Dashboard allows for the configuration of various notifications. These can include both automated API calls and notifications for operators. This is particularly useful when creating a control panel to alert the on-duty operator of anomalous changes. An increase or decrease of a certain level, the average value over a defined period, absence of data, etc., can be set as triggers.
Creating a new trigger and adding a notification panel
There is a separate widget for notifications called 'Alerts', which can display them on the same panel as the graphs.
WISE-PaaS/SaaS Composer
SaaS Composer is a framework for building two- and three-dimensional diagrams of technological processes. Unlike traditional outdated diagrams, it allows for the creation of more informative and visual models of the processes involved. Visualize entire production lines and buildings in 3D, displaying real-time events on three-dimensional models.
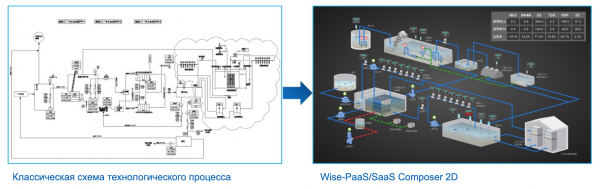
Main features:
- Web interface on HTML 5 Canvas. Good performance without the need for additional software to view the diagrams.
- Creation of 2D and 3D models. Import 3D models in .OBJ + .MTL format
- Support for JPEG, PNG, SVG, OBJ, MTL images. SVG vector graphics support when building 3D models. Graphics from existing diagrams can be imported.
- Adding animations and displaying data over three-dimensional objects
- Support for scripting languages
- Integration with other WISE-PaaS products, particularly WISE-PaaS/Dashboard
The 3D model builder has a library of basic components: pipes, valves, wires, motors, machines, grids, and more. It allows for the creation of realistic models of real objects and the addition of data widgets.
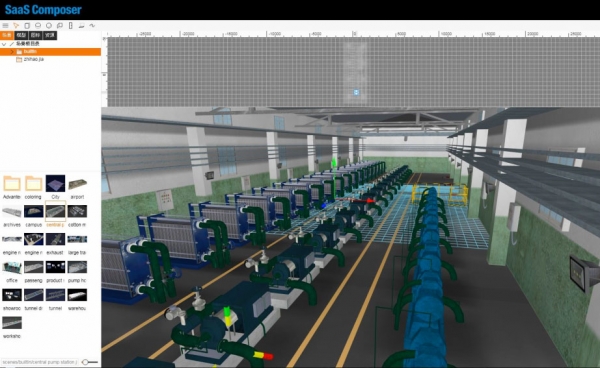
Demo diagram of the Advantech building, showing the real-time status of energy systems, electricity consumption levels in different locations, air quality: CO2 levels, levels of fine particulate matter in the air, etc.
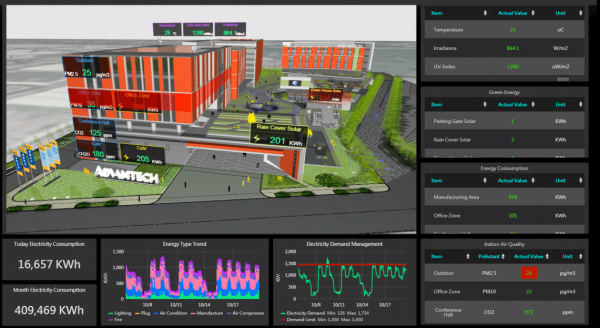
Demo diagram created with SaaS Composer showing the status of various parameters in the building.
WISE-PaaS/APM
Asset Performance Management is designed to enhance control over the efficiency of production lines for more accurate forecasting, risk assessment, and production volume control.
WISE-PaaS/APM has built-in algorithms for analyzing production processes, allowing tracking of which machines are underperforming, forecasting production volumes, potential issues, and the need for maintenance.
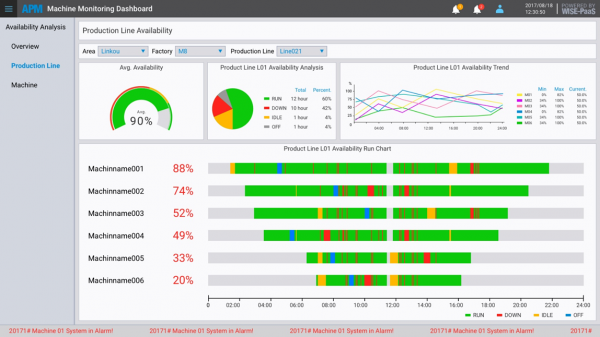
WISE-PaaS/APM enables monitoring the efficiency of production lines.
WISE-PaaS/EnSaaS — Working with devices (Edge to Cloud)
To conveniently integrate end devices into the cloud infrastructure, WISE-PaaS offers a set of tools for working with embedded systems and IoT.
WISE-PaaS/DeviceOn — a platform for managing and configuring a vast number of end devices such as sensors, terminals, embedded systems, and more.
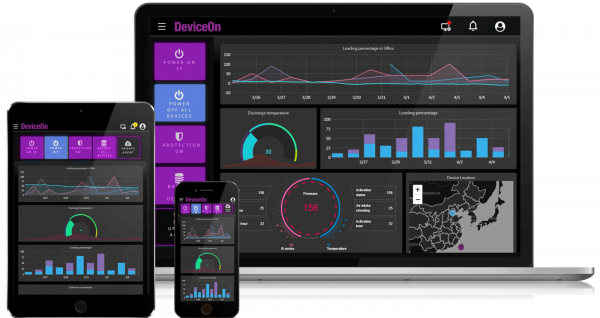
Main features:
- Zero-touch provisioning — automatic configuration of end equipment and adding it to the system.
- Access control — to ensure device security and prevent unauthorized access.
- Over-the-Air Updates (OTA) — automatic updating of software and firmware on end devices.
- Monitoring — monitoring the status of equipment and notifying about issues via Push notifications, SMS, or Email.
- Backups and archiving — creating backups of device configurations and their data.
- Device mapping — a tool for creating a layout of devices on building plans and maps.
WISE-PaaS/WISE-Agent
WISE-Agent is software installed on end devices to interact with WISE-PaaS/DeviceOn. All major operating systems are supported. Compiled packages are available for Windows, Ubuntu, Android (RISC), OpenWRT (RISC).
Communication with the cloud platform occurs via the MQTT(s) protocol.
[Case] Using the WISE-PaaS platform in the development of smart ships.
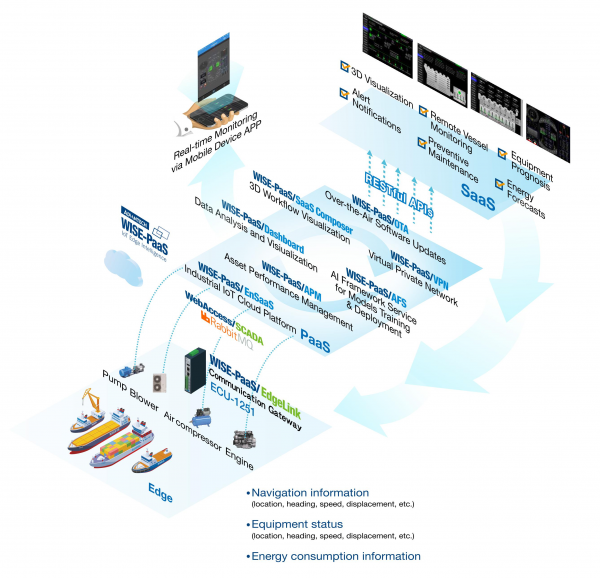
SaierNico specializes in developing intelligent systems for shipping companies and manufactures equipment for vessels. By utilizing the WISE-PaaS platform, SaierNico developed a real-time remote monitoring system for ships and incident response.

Sensors collect data from various components of the vessel: engine RPM, pressure, status of air conditioning systems, pumps, and more. Data is transmitted using the RabbitMQ broker, which enhances message delivery reliability, since the connection with the vessel is unstable. Data is stacked in the WebAccess/SCADA system.
System Architecture
To monitor the efficiency of the vessel components, .
Data visualization for the dispatch center is implemented based on and .
Firmware updates for the endpoint devices in the vessel systems are performed using .
Source: habr.com
