

In investigating cases related to phishing, botnets, fraudulent transactions, and criminal hacker groups, Group-IB experts have been using graph analysis for many years to uncover various kinds of connections. Each case has its own datasets, specialized algorithms for detecting relationships, and interfaces tailored for specific tasks. All these tools were developed internally by Group-IB and were only available to our employees.
Network infrastructure graph (network graph) became the first internal tool that we integrated into all company public products. Before creating our network graph, we analyzed many similar developments on the market and found no product that met our own needs. In this article, we will talk about how we created the network graph, how we use it, and the challenges we faced.
Dmitry Volkov, CTO of Group-IB and head of cyber intelligence
What can the Group-IB network graph do?
Investigations
Since Group-IB's founding in 2003, identifying, de-anonymizing, and holding cybercriminals accountable has been our top priority. No investigation into a cyberattack has been completed without analyzing the attackers' network infrastructure. In the early days of our journey, this involved quite a painstaking "manual work" to find connections that could aid in identifying the criminals: information about domain names, IP addresses, digital fingerprints of servers, and more.
Most attackers try to operate as anonymously as possible online. However, like all people, they make mistakes. The main task of this analysis is to find the "white" or "gray" historical projects of the attackers that intersect with the malicious infrastructure used in the current incident we are investigating. If "white projects" are discovered, it typically becomes trivial to find the attacker. In the case of "gray projects," it takes more time and effort to search, as their owners try to anonymize or hide registration details, but the chances remain quite high. Generally, at the beginning of their criminal activities, attackers pay less attention to their own security and make more mistakes, so the deeper we can dive into the history, the higher the chances of a successful investigation. This is why a network graph with a good history is a crucial element of such an investigation. In simpler terms, the deeper the historical data a company possesses, the better its graph. For instance, a 5-year history may help solve 1-2 out of 10 crimes, while a 15-year history provides chances of solving all ten.
Phishing and Fraud Detection
Each time we receive a suspicious link to phishing, fraudulent, or pirate resources, we automatically build a graph of related network resources and check all identified hosts for similar content. This allows us to find both old phishing sites that were active but unknown, as well as completely new ones that are set up for future attacks but have not yet been used. A simple example that occurs quite often: we found a phishing site on a server where there are only 5 sites. By checking each of them, we find phishing content on the other sites as well, meaning we can block 5 instead of just 1.
Backend Search
This process is essential to determine where the malicious server is actually located.
99% of card shops, hacker forums, numerous phishing resources, and other malicious servers hide behind their own proxy servers as well as the proxies of legitimate services like Cloudflare. Knowledge about the real backend is crucial for investigations: it reveals the hosting provider from which a server can be seized, allowing connections to other malicious projects to be established.
For example, you have a phishing site for collecting banking card data that resolves to IP address 11.11.11.11, and the card shop that resolves to IP address 22.22.22.22. During the analysis, it may turn out that both the phishing site and the card shop share a common backend IP address, such as 33.33.33.33. This knowledge allows for a connection to be made between the phishing attacks and the card shop that possibly sells the banking card data.
Event Correlation
When you have two different triggers (say, on an IDS) with different malware and different servers for managing the attack, you would consider them as two independent events. However, if there is a strong connection between the malicious infrastructures, it becomes clear that these are not different attacks but stages of a single, more complex multi-step attack. If one of the events has already been attributed to a certain group of attackers, then the second can also be attributed to the same group. Of course, the attribution process is significantly more complex, so consider what has been written as a simple example.
Indicator Enrichment
We won’t spend too much time on this since it is the most common use case for graphs in cybersecurity: you input one indicator and get an array of related indicators as output.
Pattern Detection
Pattern detection is essential for effective hunting. Graphs allow not just the finding of related elements but also the identification of common traits shared by a certain group of hackers. Knowledge of such unique characteristics enables the recognition of the attackers' infrastructure even at the preparation stage and without evidence confirming an attack, such as phishing emails or malware.
Why We Created Our Network Graph?
I'll reiterate that we explored solutions from various providers before concluding that we needed to develop our own tool that performs functions not available in any existing product. Its development took several years during which we completely overhauled it multiple times. However, despite the long development period, we still haven't found a single equivalent that meets our requirements. With our own product, we were ultimately able to address almost all the issues we encountered in existing network graphs. Below, we will examine these issues in detail:
The Problem
Solution
Lack of a provider with different data collections: domains, passive DNS, passive SSL, DNS records, open ports, services running on ports, files interacting with domain names and IP addresses. Explanation: Typically, providers offer separate types of data, and to gather a complete picture, one must purchase subscriptions from all of them. Yet, even then, it is not always possible to obtain all the data: some passive SSL providers supply data only about certificates issued by trusted CAs, whereas their coverage of self-signed certificates is extremely poor. Others provide data on self-signed certificates but only collect them from standard ports.
We collected all the aforementioned collections ourselves. For instance, to gather data on SSL certificates, we developed our own service that collects them both from trusted CAs and by scanning the entire IPv4 space. Certificates were collected not only from IP addresses but also from all domains and subdomains in our database: if you have a domain example.com and its subdomain and they all resolve to IP 1.1.1.1, then when attempting to obtain an SSL certificate from port 443 by IP, domain, and its subdomain, you may receive three different results. In order to gather data on open ports and running services, we had to create our own distributed scanning system, as other services' scanning server IP addresses are often found on 'blacklists.' Our scanning servers also end up on 'blacklists,' but the success rate in discovering the services we need is higher compared to those that simply scan as many ports as possible and sell access to this data.
Lack of access to the entire database of historical records. Explanation. Every reputable provider has a solid accumulated history, but for natural reasons, we, as clients, were unable to access all historical data. This means that you can obtain the entire history for a specific record, such as a domain or IP address, but you cannot see the history of everything — and without that, you cannot get the full picture.
To gather as many historical records on domains as possible, we purchased various databases, parsed numerous open resources that contained this history (fortunately, there were many), and negotiated with domain name registrars. All updates in our own collections, of course, are stored with a complete history of changes.
All existing solutions allow for building graphs manually. Explanation. Suppose you have purchased numerous subscriptions from all possible data providers (commonly referred to as 'enrichers'). When you need to build a graph, you give a manual command to extend from the desired element of connection, then choose the necessary ones from the new elements and command to extend connections from them, and so on. In this case, the responsibility for how well the graph is constructed lies entirely with the person.
We have implemented automatic graph construction. In other words, if you need to build a graph, the connections from the first element are created automatically, and then from all subsequent ones as well. The specialist only specifies the depth from which to build the graph. The process of automatic graph construction is straightforward, but other vendors do not implement it because it produces a vast number of irrelevant results, and we had to take this drawback into account (see below).
A multitude of irrelevant results is a problem for all graphs of network elements. Explanation. For instance, a "bad domain" (involved in an attack) is linked to a server that, over the past 10 years, has been associated with 500 other domains. When manually adding or automatically constructing the graph, all these 500 domains should appear on the graph as well, even though they are not related to the attack. Or, for example, you check an IP indicator from a security vendor's report. Typically, such reports are released with significant delays and often cover a year or more. Most likely, by the time you read the report, the server with that IP address has already been leased to other people with different connections, and constructing the graph will again lead to irrelevant results.
We trained the system to identify irrelevant elements based on the same logic our experts used manually. For example, you check the bad domain example.com, which currently resolves to IP 11.11.11.11, and a month ago resolved to IP 22.22.22.22. In addition to the domain example.com, IP 11.11.11.11 is also associated with example.ru, while IP 22.22.22.22 is linked to 25,000 other domains. The system, like a human, understands that 11.11.11.11 is likely a dedicated server, and since the domain example.ru is similar in spelling to example.com, they are likely related and should be included on the graph; whereas IP 22.22.22.22 belongs to shared hosting, so all its domains should not be included on the graph unless there are other connections indicating that one of these 25,000 domains should be included (for example, example.net). Before the system realizes that connections need to be severed and certain elements should not be included on the graph, it takes into account numerous properties of the elements and clusters to which these elements are grouped, along with the strength of current connections. For instance, if there is a small cluster (50 elements) on the graph that includes a bad domain, and another large cluster (5,000 elements) is connected by a very weak connection (line), then this connection will be severed, and elements from the large cluster will be removed. However, if there are many connections between the small and large clusters and their strength gradually increases, then in this case, the connection will not be severed, and necessary elements from both clusters will remain on the graph.
The ownership interval of the server and domain is not taken into account. Explanation: The registration period for "bad domains" eventually expires, and they are repurchased for either malicious or legitimate purposes. Even bulletproof hosting providers lease servers to various hackers, so it's critical to know and consider the interval during which a particular domain/server was managed by a single owner. We often encounter situations where a server with IP 11.11.11.11 is currently being used as a C&C for a banking bot, while just two months ago it was under the control of ransomware operators. If we establish a connection without considering ownership intervals, it may appear that there is a link between the owners of the banking bot network and the extortionists, even though there isn't one. In our work, such a mistake is critical.
We have trained the system to identify ownership intervals. For domains, this is relatively easy, as the whois often shows the registration start and expiration dates, and when there is a complete history of whois changes, determining intervals is straightforward. When a domain's registration has not expired but its management has been transferred to other owners, that can also be tracked. SSL certificates do not have this issue, as they are issued once, not renewed, and not transferred. However, self-signed certificates should not be trusted based on the dates shown in the certificate's validity period, because one can generate an SSL certificate today and specify its start date as 2010. The hardest part is determining ownership intervals for servers, as only hosting providers have the lease dates. To determine the ownership period of a server, we started using the results of port scanning and fingerprinting of services running on ports. From this information, we can quite accurately state when the ownership of a server changed.
Few connections. Explanation: It is now easy, even for free, to obtain a list of domains where a certain email address is specified in the whois, or to find all domains associated with a specific IP address. However, when it comes to hackers who do everything possible to evade tracking, additional "tricks" are needed to find new properties and establish new connections.
We spent a lot of time researching how to extract data that is not accessible through conventional means. We can't describe how it works for obvious reasons, but under certain circumstances, hackers make mistakes when registering domains or renting and configuring servers that allow access to email addresses, hacker aliases, and backend addresses. The more connections you extract, the more accurately you can build graphs.
How our graph works
To start using the network graph, you need to enter a domain, IP address, email, or SSL certificate fingerprint into the search bar. There are three parameters that the analyst can manage: time, step depth, and cleanup.

Time
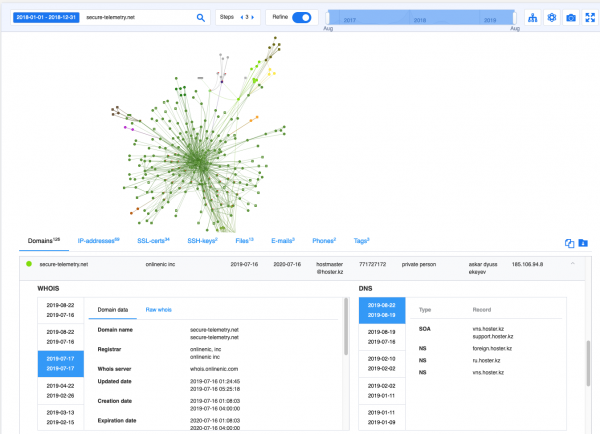
Time refers to the date or interval when the sought item was used for malicious purposes. If this parameter is not specified, the system will automatically determine the last interval of ownership of the resource. For example, on July 11, Eset published on how Buhtrap uses a zero-day exploit for cyber espionage. At the end of the report, there are six indicators. One of them, secure-telemetry[.]net, was re-registered on July 16. Therefore, if you build a graph after July 16, you will get irrelevant results. But if you specify that this domain was used before that date, 126 new domains and 69 IP addresses not listed in the Eset report will appear on the graph:
- ukrfreshnews[.]com
- unian-search[.]com
- vesti-world[.]info
- runewsmeta[.]com
- foxnewsmeta[.]biz
- sobesednik-meta[.]info
- rian-ua[.]net
- and others.
In addition to network indicators, we also immediately find connections with malicious files that were linked to this infrastructure and tags that suggest the use of Meterpreter, AZORult.
The most remarkable thing is that you receive this result within one second, and you no longer need to spend days analyzing the data. Certainly, this approach sometimes dramatically reduces the time spent on investigations, which can often be critical.
The number of steps or recursion depth used to build the graph
By default, the depth is set to 3. This means that all directly connected elements will be found from the sought item, and then new connections to other elements will be built from each new element, and from those new elements, new connections will be established from the previous step.
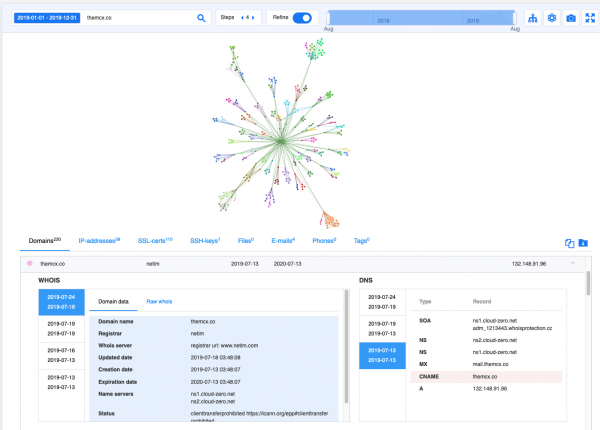
Let's take an example unrelated to APT and 0-day exploits. Recently, an interesting case related to cryptocurrency fraud was described on Habr. The report mentions the domain — themcx[.]co, used by fraudsters for hosting a site allegedly for the exchange Miner Coin Exchange, and phone-lookup[.]xyz, for attracting traffic.
The description makes it clear that the scheme requires a fairly large infrastructure to channel traffic to fraudulent resources. We decided to look at this infrastructure by building a graph in 4 steps. As a result, we obtained a graph with 230 domains and 39 IP addresses. Next, we divided the domains into 2 categories: those resembling cryptocurrency services and those intended for driving traffic through phone lookup services:
Related to cryptocurrency
Related to phone lookup services
coinkeeper[.]cc
caller-record[.]site.
mcxwallet[.]co
phone-records[.]space
btcnoise[.]com
fone-uncover[.]xyz
cryptominer[.]watch
number-uncover[.]info
Clear
By default, the 'Clear Graph' option is enabled, and all irrelevant elements will be removed from the graph. By the way, it was also used in all previous examples. I anticipate the natural question: how can we ensure that something important isn't deleted? To answer: for analysts who prefer to build graphs manually, automated clearing can be disabled, and the number of steps can be set to 1. This way, the analyst can complete the graph from the needed elements and remove irrelevant ones according to the task.
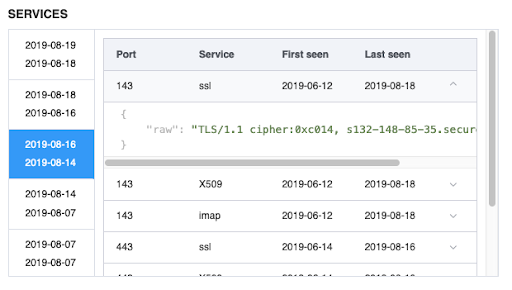
Once on the graph, the analyst has access to the history of WHOIS changes, DNS, as well as open ports and the services running on them.
Financial phishing
We researched the actions of an APT group that conducted phishing attacks against clients of various banks in different regions for several years. A characteristic feature of this group was the registration of domains very similar to the names of real banks, and most phishing sites had the same design, with differences only in the names of the banks and their logos.
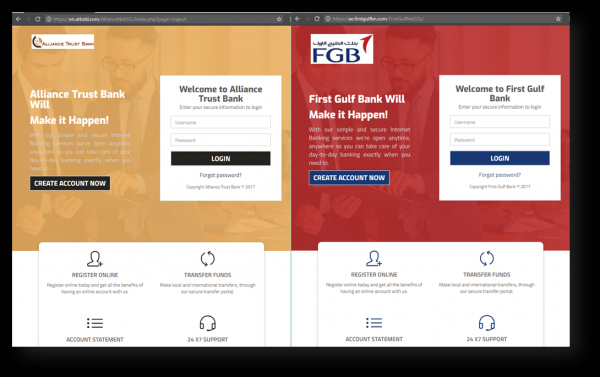
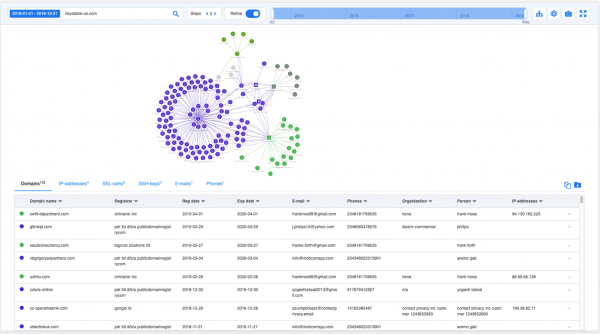
In this case, automated graph analysis was very helpful. Taking one of their domains — lloydsbnk-uk[.]com, we built a graph with a depth of 3 steps in a few seconds, revealing over 250 malicious domains that this group has used since 2015 and continues to use. Some of these domains have already been acquired by banks, but historical records show that they were previously registered by the attackers.
For clarity, the illustration shows a graph with a depth of 2 steps.
Notably, as early as 2019, the attackers slightly changed their tactics and began registering not only bank domains for hosting web phishing but also domains of various consulting companies to send phishing emails. For example, the domains swift-department.com, saudconsultancy.com, vbgrigoryanpartners.com.
Cobalt gang
In December 2018, the Cobalt hacker group, specializing in targeted attacks on banks, conducted a mailing on behalf of the National Bank of Kazakhstan.
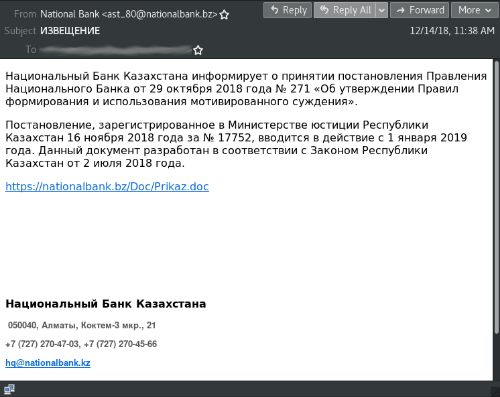
The emails contained links to hXXps://nationalbank.bz/Doc/Prikaz.doc. The downloaded document contained a macro that launches PowerShell, which attempts to download and execute a file from hXXp://wateroilclub.com/file/dwm.exe as %Temp%einmrmdmy.exe. The file %Temp%einmrmdmy.exe aka dwm.exe is a CobInt stager configured to interact with the server hXXp://admvmsopp.com/rilruietguadvtoefmuy.
Imagine you cannot receive these phishing emails and conduct a full analysis of the malicious files. The graph for the malicious domain nationalbank[.]bz immediately shows connections to other malicious domains, attributes this to the group, and displays which files were used in the attack.
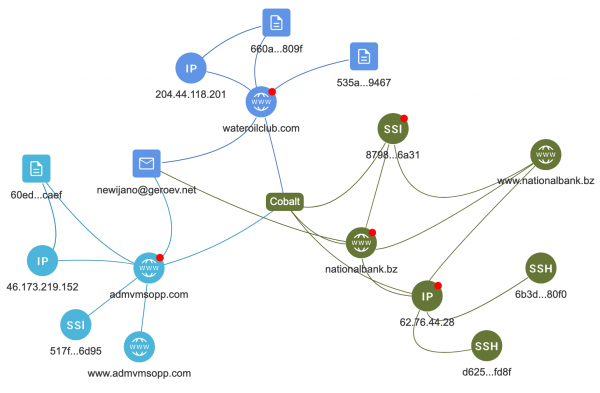
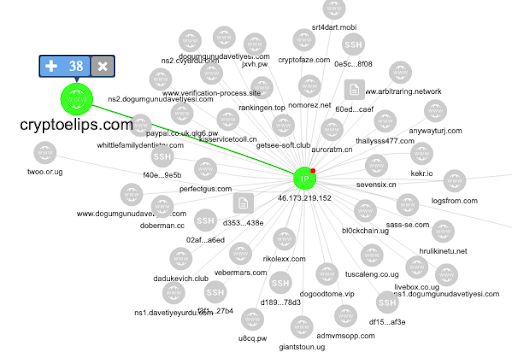
Let's take the IP address 46.173.219[.]152 from this graph and build a graph for it in one pass with cleaning turned off. It is linked to 40 domains, such as bl0ckchain[.]ug.
paypal.co.uk.qlg6[.]pw
cryptoelips[.]com
Judging by the domain names, they appear to be used in fraudulent schemes, but the cleaning algorithm understood that they are not related to this attack and did not bring them into the graph, which greatly simplifies the analysis and attribution process.
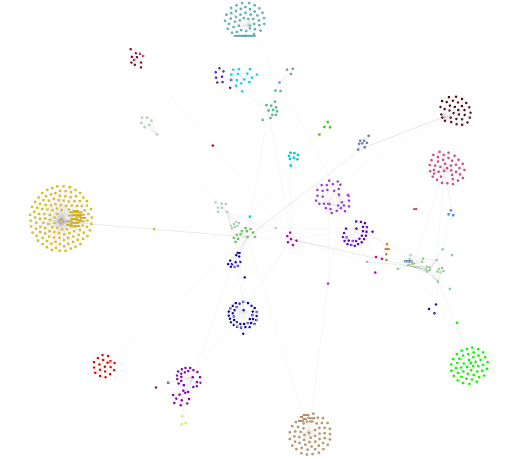
If we rebuild the graph for nationalbank[.]bz without turning off the graph cleaning algorithm, it captures more than 500 elements, most of which have no relation to either the Cobalt group or their attacks. An example of such a graph is shown below:
Conclusion
After several years of fine-tuning, real investigation tests, threat research, and hunting for attackers, we have not only created a unique tool but also changed the perception of it among experts within the company. Initially, the technical experts wanted complete control over the graph-building process. It was extremely difficult to convince them that automatic graph construction could outperform a person with many years of experience. Time and multiple 'manual' verifications of the graph's results turned the tide. Now, our experts not only trust the system but also use its results in their daily work. This technology operates within each of our systems and allows for better identification of threats of any type. The interface for manual graph analysis is integrated into all Group-IB products and significantly expands capabilities for cybercrime hunting. This is confirmed by feedback from analysts among our clients. We, in turn, continue to enrich the graph with data and develop new algorithms that utilize artificial intelligence for the most accurate network graph.
Source: habr.com
