


My main job primarily involves deploying software systems, which means I often spend a lot of time trying to answer questions like these:
- The software works for the developer, but not for me. Why?
- Yesterday the software worked for me, but today it doesn't. Why?
This is a kind of debugging that is slightly different from regular software debugging. Regular debugging is about code logic, whereas deployment debugging focuses on the interaction between the code and the environment. Even if the root of the problem is a logical error, the fact that it works on one machine and not on another means that the issue is somehow related to the environment.
Therefore, instead of the usual debugging tools like gdb I have a different set of tools for deployment debugging. And my favorite tool for tackling the question "Why isn’t this software working for me?" is called strace.
So what is strace?
— it’s a tool for tracing system calls. It was originally created for Linux, but similar debugging tasks can be performed with tools designed for other systems ( or ).
Its main use is very simple. You just need to run strace with any command and it will output a dump of all system calls (though you might need to install it first) strace):
$ strace echo Hello
...Snip lots of stuff...
write(1, "Hellon", 6)                  = 6
close(1)                                = 0
close(2)                                = 0
exit_group(0)                           = ?
+++ exited with 0 +++
What are these system calls? They are somewhat like an API for the operating system kernel. Long ago, software had direct access to the "hardware" it ran on. For example, if something needed to be displayed on the screen, it interacted with ports or displayed memory registers for video devices. When multitasking computer systems became popular, chaos ensued, as various applications fought for "hardware". Errors in one application could crash others, if not the entire system. This led to the introduction of privilege levels (or "ring protection") in CPUs. The kernel became the most privileged, gaining full access to the "hardware", while less privileged applications had to request access from the kernel to interact with the "hardware" — through system calls.
At the binary level, a system call differs slightly from a simple function call; however, most programs use a wrapper in the standard library. That is, the POSIX C standard library includes a function call write(), which contains all architecture-dependent code for the system call. exit.
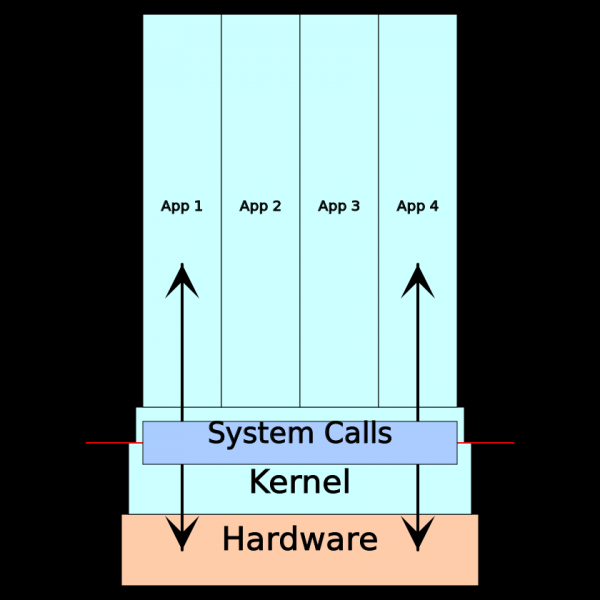
In brief, any interaction of an application with its environment (computer systems) is carried out through system calls. Therefore, when software works on one machine but not on another, it's helpful to look at the results of system call tracing. More specifically, here’s a list of typical points that can be analyzed using system call tracing:
- Console input/output
- Network input/output
- File system access and file input/output
- Thread/process lifetime management
- Low-level memory management
- Access to special device drivers
When to use strace?
In theory, strace it can be used with any user-space programs since any user-space program must make system calls. It works more effectively with compiled, low-level programs but can also be used with higher-level languages like Python, provided you can sift through the additional noise from the execution environment and interpreter.
In all its glory strace it reveals itself during debugging software that works fine on one machine but suddenly stops functioning on another, throwing vague messages about files, permissions, or failed attempts to execute certain commands, and so on. Unfortunately, it doesn't mesh well with high-level issues like certificate verification errors. Usually, this requires a combination of strace, sometimes and higher-level tools (like the command-line tool openssl for certificate debugging).
For example, we consider working on an isolated server, but system call tracing can often be performed on more complex deployment platforms. You just need to choose the right tools.
An example of simple debugging
Let's say you want to run an amazing server application named foo, and you get the following:
$ foo
Error opening configuration file: No such file or directory
Clearly, he was unable to find the configuration file you wrote. This happens because sometimes, package managers, while compiling an application, override the expected file locations. Following the installation guide for one distribution, you find files in a completely different place than expected in another. The issue could be resolved in a couple of seconds if the error message indicated where to look for the configuration file, but it doesn't. So where should you look?
If there is access to the source code, you can read it and figure everything out. A good backup plan, but not the quickest solution. You could use a step-by-step debugger like gdb and see what the program does, but it is much more effective to use a tool specifically designed to show the interaction with the environment: strace.
Output strace might seem excessive, but the good news is that most of it can be safely ignored. It's often helpful to use the -o flag to save the tracing results to a separate file:
$ strace -o /tmp/trace foo
Error opening configuration file: No such file or directory
$ cat /tmp/trace
execve("foo", ["foo"], 0x7ffce98dc010 /* 16 vars */) = 0
brk(NULL)                               = 0x56363b3fb000
access("/etc/ld.so.preload", R_OK)      = -1 ENOENT (No such file or directory)
openat(AT_FDCWD, "/etc/ld.so.cache", O_RDONLY|O_CLOEXEC) = 3
fstat(3, {st_mode=S_IFREG|0644, st_size=25186, ...}) = 0
mmap(NULL, 25186, PROT_READ, MAP_PRIVATE, 3, 0) = 0x7f2f12cf1000
close(3)                                = 0
openat(AT_FDCWD, "/lib/x86_64-linux-gnu/libc.so.6", O_RDONLY|O_CLOEXEC) = 3
read(3, "177ELF2113 3 > 1 260A2 "..., 832) = 832
fstat(3, {st_mode=S_IFREG|0755, st_size=1824496, ...}) = 0
mmap(NULL, 8192, PROT_READ|PROT_WRITE, MAP_PRIVATE|MAP_ANONYMOUS, -1, 0) = 0x7f2f12cef000
mmap(NULL, 1837056, PROT_READ, MAP_PRIVATE|MAP_DENYWRITE, 3, 0) = 0x7f2f12b2e000
mprotect(0x7f2f12b50000, 1658880, PROT_NONE) = 0
mmap(0x7f2f12b50000, 1343488, PROT_READ|PROT_EXEC, MAP_PRIVATE|MAP_FIXED|MAP_DENYWRITE, 3, 0x22000) = 0x7f2f12b50000
mmap(0x7f2f12c98000, 311296, PROT_READ, MAP_PRIVATE|MAP_FIXED|MAP_DENYWRITE, 3, 0x16a000) = 0x7f2f12c98000
mmap(0x7f2f12ce5000, 24576, PROT_READ|PROT_WRITE, MAP_PRIVATE|MAP_FIXED|MAP_DENYWRITE, 3, 0x1b6000) = 0x7f2f12ce5000
mmap(0x7f2f12ceb000, 14336, PROT_READ|PROT_WRITE, MAP_PRIVATE|MAP_FIXED|MAP_ANONYMOUS, -1, 0) = 0x7f2f12ceb000
close(3)                                = 0
arch_prctl(ARCH_SET_FS, 0x7f2f12cf0500) = 0
mprotect(0x7f2f12ce5000, 16384, PROT_READ) = 0
mprotect(0x56363b08b000, 4096, PROT_READ) = 0
mprotect(0x7f2f12d1f000, 4096, PROT_READ) = 0
munmap(0x7f2f12cf1000, 25186)           = 0
openat(AT_FDCWD, "/etc/foo/config.json", O_RDONLY) = -1 ENOENT (No such file or directory)
dup(2)                                  = 3
fcntl(3, F_GETFL)                       = 0x2 (flags O_RDWR)
brk(NULL)                               = 0x56363b3fb000
brk(0x56363b41c000)                     = 0x56363b41c000
fstat(3, {st_mode=S_IFCHR|0620, st_rdev=makedev(0x88, 0x8), ...}) = 0
write(3, "Error opening configuration file"..., 60) = 60
close(3)                                = 0
exit_group(1)                           = ?
+++ exited with 1 +++
About the first page of the output strace — this is usually low-level preparation for execution. (Many calls mmap, mprotect, brk for things like low-level memory discovery and loading dynamic libraries.) In fact, during debugging, outputs strace are usually better read from the end. The bottom will have a call exit, outputting the error message. Looking above, we can see the first failing system call — the call openat, which returns an error ENOENT ('file or directory not found'), trying to open /etc/foo/config.json. Here is where the configuration file should be.
This was just an example, but I would say that 90% of the time that I use strace, I don't have to perform anything significantly more complex than this. Below is a complete step-by-step guide to debugging:
- Getting frustrated by an unclear system error message from the program
- Restarting the program with strace
- Finding the error message in the trace results
- Going up until you hit the first failing system call
It is quite likely that the system call in step 4 will show what went wrong.
Tips
Before showing you a more complex debugging example, let me share some tips for effective usage. strace:
man is your friend
On many *nix systems, you can get a complete list of system calls to the kernel by running man syscalls. You'll see things like brk(2), which means you can get more information by running man 2 brk.
A few pitfalls: man 2 fork shows me the page for the shell fork() downward API support (simultaneously with this in GNU libc, which, it turns out, is implemented via the call clone(). The semantics of the call fork remain the same if you write a program that uses fork(), and run a trace — I won't find the calls fork, instead, there will be clone(). Such pitfalls can confuse you when comparing the source with the output. strace.
Use -o to save the output to a file
strace can generate extensive output, so it’s often useful to store trace results in separate files (as in the example above). This also helps avoid mixing program output with console output. strace in the console.
Use -s to see more argument data
You may have noticed that the second half of the error message is not shown in the trace output above. This is because strace by default only shows the first 32 bytes of the argument string. If you want to see more, add something like -s 128 to the call strace.
-u makes tracking files, sockets, etc. easier.
"Everything is a file" means that *nix systems handle all input and output using file descriptors, whether it's applicable to a file, a network, or inter-process channels. This is convenient for programming, but makes it hard to track what is actually happening when you see common write and exit in system call trace results.
By adding the operator -u, you will have strace annotate each file descriptor in the output with a note of what it points to.
Attach to an already running process with -p**
As can be seen from the example below, sometimes you need to trace a program that is already running. If you know it is running as process 1337 (say, from the outputs ps), you can trace it like this:
$ strace -p 1337
...system call trace output...
You might need root privileges.
Use -f to follow child processes.
strace By default, it traces only one process. If this process spawns child processes, you will see the system call for spawning the child process, but the system calls of the child process will not be displayed.
If you think the error lies within the child process, use the operator -f, this will enable its tracing. The downside is that the output will be even more confusing for you. When strace tracing one process or one branch, it shows a single stream of call events. When tracing multiple processes at once, you might see the start of a call interrupted by the message <unfinished …>, followed by a bunch of calls for other execution branches, and only then — the completion of the first with <… foocall resumed>. Or separate all tracing results into different files by also using the operator -ff (details in by strace).
Filter the trace using -e
As you can see, the trace result is a real jumble of all possible system calls. With the flag -e you can filter the trace (see by strace). The main advantage is that running a trace with filtering is faster than doing a full trace and then grep`ing. To be honest, I almost always don't care.
Not all errors are bad
A simple and common example is a program searching for a file in several locations, like a shell looking for which bin directory contains an executable:
$ strace sh -c uname
...
stat("/home/user/bin/uname", 0x7ffceb817820) = -1 ENOENT (No such file or directory)
stat("/usr/local/bin/uname", 0x7ffceb817820) = -1 ENOENT (No such file or directory)
stat("/usr/bin/uname", {st_mode=S_IFREG|0755, st_size=39584, ...}) = 0
...
Heuristics like "the last failed request before the error message" are useful in finding relevant errors. Nevertheless, it makes sense to start from the very end.
Understanding system calls is greatly aided by C programming language guides.
Standard library calls in C are not system calls but merely a thin superficial layer. So, if you understand a bit about how to work in C, it will be easier for you to interpret the results of the system call trace. For example, if you have trouble debugging calls to network systems, refer to the classic .
A more complicated debugging example
I have already mentioned that a simple debugging example is representative of what I often deal with in my work on strace. However, sometimes a real investigation is required, so here’s a real-world example of more complex debugging.
— a task handling scheduler, another implementation of the *nix daemon. cronIt is installed on the server, but when someone tries to edit the schedule, this is what happens:
# crontab -e -u logs
bcrontab: Fatal: Could not create temporary file
Alright, so bcron it attempted to write a certain file, but it failed and won't say why. Let's uncover strace:
# strace -o /tmp/trace crontab -e -u logs
bcrontab: Fatal: Could not create temporary file
# cat /tmp/trace
...
openat(AT_FDCWD, "bcrontab.14779.1573691864.847933", O_RDONLY) = 3
mmap(NULL, 8192, PROT_READ|PROT_WRITE, MAP_PRIVATE|MAP_ANONYMOUS, -1, 0) = 0x7f82049b4000
read(3, "#Ansible: logsaggn20 14 * * * lo"..., 8192) = 150
read(3, "", 8192)                       = 0
munmap(0x7f82049b4000, 8192)            = 0
close(3)                                = 0
socket(AF_UNIX, SOCK_STREAM, 0)         = 3
connect(3, {sa_family=AF_UNIX, sun_path="/var/run/bcron-spool"}, 110) = 0
mmap(NULL, 8192, PROT_READ|PROT_WRITE, MAP_PRIVATE|MAP_ANONYMOUS, -1, 0) = 0x7f82049b4000
write(3, "156:Slogs #Ansible: logsaggn20 1"..., 161) = 161
read(3, "32:ZCould not create temporary f"..., 8192) = 36
munmap(0x7f82049b4000, 8192)            = 0
close(3)                                = 0
write(2, "bcrontab: Fatal: Could not creat"..., 49) = 49
unlink("bcrontab.14779.1573691864.847933") = 0
exit_group(111)                         = ?
+++ exited with 111 +++
Towards the end, there's an error message exit, but this time something is different. First, there is no relevant system call error that usually precedes it. Secondly, it's apparent that someone already read the error message somewhere. It seems the real problem is located elsewhere, and bcrontab is merely reproducing the message.
If we look at man 2 read, we can see that the first argument (3) is the file descriptor that *nix uses for all input-output processing. How do we find out what file descriptor 3 represents? In this particular case, we can run strace with the operator -u (see above), and it will automatically tell us, however, to compute such things, it's useful to know how to read and analyze trace results.
The source of the file descriptor could be one of many system calls (it all depends on what the descriptor is for — a console, a network socket, an actual file, or something else), but regardless, we are looking for calls that return 3 (i.e., searching for '= 3' in the trace results). In this result, there are 2: openat at the very top and socket in the middle. openat opens a file, but close(3) afterwards shows that it closes again. (Caution: file descriptors can be reused when they are opened and closed). The call socket() fits, since it is the last before read(), which suggests that bcrontab is working with something over a socket. The next line shows that the file descriptor is associated with unix domain socket at the path /var/run/bcron-spool.
So, we need to find the process bound to unix socket on the other side. For this purpose, there are a couple of nifty tricks, both of which come in handy for debugging server deployments. The first is to use netstat or a newer ss (socket status). Both commands show the active network connections of the system and use the operator -l to describe listening sockets, as well as the operator -p to display programs that are connected to the socket as clients. (There are many more useful options, but these two are enough for this task.)
# ss -pl | grep /var/run/bcron-spool
u_str LISTEN 0   128   /var/run/bcron-spool 1466637   * 0   users:(("unixserver",pid=20629,fd=3))
This indicates that listening is a command inixserver, working with process ID 20629. (And, coincidentally, it uses file descriptor 3 as a socket.)
The second truly useful tool for obtaining the same information is called lsof. It lists all open files (or file descriptors) in the system. Alternatively, you can get information about a specific file:
# lsof /var/run/bcron-spool
COMMAND   PID   USER  FD  TYPE  DEVICE              SIZE/OFF  NODE    NAME
unixserve 20629 cron  3u  unix  0x000000005ac4bd83  0t0       1466637 /var/run/bcron-spool type=STREAM
Process 20629 is a long-lived server, so you can attach to it strace using something like strace -o /tmp/trace -p 20629. If you edit the cron job in another terminal, you'll get the output of the tracing results with the generated error. And here is the result:
accept(3, NULL, NULL)                   = 4
clone(child_stack=NULL, flags=CLONE_CHILD_CLEARTID|CLONE_CHILD_SETTID|SIGCHLD, child_tidptr=0x7faa47c44810) = 21181
close(4)                                = 0
accept(3, NULL, NULL)                   = ? ERESTARTSYS (To be restarted if SA_RESTART is set)
--- SIGCHLD {si_signo=SIGCHLD, si_code=CLD_EXITED, si_pid=21181, si_uid=998, si_status=0, si_utime=0, si_stime=0} ---
wait4(0, [{WIFEXITED(s) && WEXITSTATUS(s) == 0}], WNOHANG|WSTOPPED, NULL) = 21181
wait4(0, 0x7ffe6bc36764, WNOHANG|WSTOPPED, NULL) = -1 ECHILD (No child processes)
rt_sigaction(SIGCHLD, {sa_handler=0x55d244bdb690, sa_mask=[CHLD], sa_flags=SA_RESTORER|SA_RESTART, sa_restorer=0x7faa47ab9840}, {sa_handler=0x55d244bdb690, sa_mask=[CHLD], sa_flags=SA_RESTORER|SA_RESTART, sa_restorer=0x7faa47ab9840}, 8) = 0
rt_sigreturn({mask=[]})                 = 43
accept(3, NULL, NULL)                   = 4
clone(child_stack=NULL, flags=CLONE_CHILD_CLEARTID|CLONE_CHILD_SETTID|SIGCHLD, child_tidptr=0x7faa47c44810) = 21200
close(4)                                = 0
accept(3, NULL, NULL)                   = ? ERESTARTSYS (To be restarted if SA_RESTART is set)
--- SIGCHLD {si_signo=SIGCHLD, si_code=CLD_EXITED, si_pid=21200, si_uid=998, si_status=111, si_utime=0, si_stime=0} ---
wait4(0, [{WIFEXITED(s) && WEXITSTATUS(s) == 111}], WNOHANG|WSTOPPED, NULL) = 21200
wait4(0, 0x7ffe6bc36764, WNOHANG|WSTOPPED, NULL) = -1 ECHILD (No child processes)
rt_sigaction(SIGCHLD, {sa_handler=0x55d244bdb690, sa_mask=[CHLD], sa_flags=SA_RESTORER|SA_RESTART, sa_restorer=0x7faa47ab9840}, {sa_handler=0x55d244bdb690, sa_mask=[CHLD], sa_flags=SA_RESTORER|SA_RESTART, sa_restorer=0x7faa47ab9840}, 8) = 0
rt_sigreturn({mask=[]})                 = 43
accept(3, NULL, NULL
(The last accept() will not be completed during tracing.) And again, as unfortunate as it is, this result does not contain the error we are looking for. We do not see any messages that bcrontag sent to the socket or received from it. Instead, it’s all about process control (clone, wait4, SIGCHLD and so on.) This process spawns a child process, which, as you might guess, does the actual work. And if you need to catch its trace, add to the call strace -f. Here's what we'll find if we search for an error message in the new result with strace -f -o /tmp/trace -p 20629:
21470 openat(AT_FDCWD, "tmp/spool.21470.1573692319.854640", O_RDWR|O_CREAT|O_EXCL, 0600) = -1 EACCES (Permission denied)
21470 write(1, "32:ZCould not create temporary f"..., 36) = 36
21470 write(2, "bcron-spool[21470]: Fatal: logs:"..., 84) = 84
21470 unlink("tmp/spool.21470.1573692319.854640") = -1 ENOENT (No such file or directory)
21470 exit_group(111)                   = ?
21470 +++ exited with 111 +++
Now, this is something. Process 21470 is getting a ‘permission denied’ error when trying to create a file at the path tmp/spool.21470.1573692319.854640 (relative to the current working directory). If we only knew the current working directory, we'd have the full path and could figure out why the process can't create its temporary file there. Unfortunately, the process has already exited, so we can’t simply use lsof -p 21470 to find the current directory, but we can work backward – look for the system calls of PID 21470 that change the directory. (If there are none, PID 21470 must have inherited them from the parent, and this can already be determined through lsof -p which won't help.) This system call is chdir (which can be easily discovered using modern search engines). And here are the results from the reverse searches based on the trace results, all the way to the server PID 20629:
20629 clone(child_stack=NULL, flags=CLONE_CHILD_CLEARTID|CLONE_CHILD_SETTID|SIGCHLD, child_tidptr=0x7faa47c44810) = 21470
...
21470 execve("/usr/sbin/bcron-spool", ["bcron-spool"], 0x55d2460807e0 /* 27 vars */) = 0
...
21470 chdir("/var/spool/cron")          = 0
...
21470 openat(AT_FDCWD, "tmp/spool.21470.1573692319.854640", O_RDWR|O_CREAT|O_EXCL, 0600) = -1 EACCES (Permission denied)
21470 write(1, "32:ZCould not create temporary f"..., 36) = 36
21470 write(2, "bcron-spool[21470]: Fatal: logs:"..., 84) = 84
21470 unlink("tmp/spool.21470.1573692319.854640") = -1 ENOENT (No such file or directory)
21470 exit_group(111)                   = ?
21470 +++ exited with 111 +++
(If you’re lost, you might want to read my previous post . So, server PID 20629 did not get permission to create a file at the path /var/spool/cron/tmp/spool.21470.1573692319.854640. Most likely, the cause is classic filesystem permission settings. Let's check:
# ls -ld /var/spool/cron/tmp/
drwxr-xr-x 2 root root 4096 Nov  6 05:33 /var/spool/cron/tmp/
# ps u -p 20629
USER       PID %CPU %MEM    VSZ   RSS TTY      STAT START   TIME COMMAND
cron     20629  0.0  0.0   2276   752 ?        Ss   Nov14   0:00 unixserver -U /var/run/bcron-spool -- bcron-spool
Here's where the issue lies! The server is running as a user cron, but only root has permission to write to the directory /var/spool/cron/tmp/. A simple command chown cron /var/spool/cron/tmp/ will do the trick bcron work correctly. (If the issue wasn't this, the next likely suspect is a kernel security module like SELinux or AppArmor, so I would check the kernel message log using POSIX clocks.)
Total
For a beginner in system call trace results, it can be overwhelming, but I hope I've shown that they are a quick way to debug a whole class of common deployment issues. Imagine trying to debug a multi-process bcron, using a step-by-step debugger.
Parsing the trace results back along the system call chain requires skill, but as I've mentioned, almost always, using strace, I simply get the trace result and look for errors starting from the end. In any case, strace it saves me a lot of time on debugging. Hopefully, it will be useful for you too.
Source: habr.com
