

Nowadays, it's hard to question the need for collecting service metrics. The next logical step is to set up alerting on the collected metrics, which will notify about any data deviations in your preferred channels (email, Slack, Telegram). In the hotel booking service all metrics from our services flow into InfluxDB and are displayed in Grafana, where basic alerting is also configured. For tasks like "we need to calculate something and compare it to that," we use Kapacitor.
Kapacitor is part of the TICK stack, which can process metrics from InfluxDB. It can join multiple measurements together, compute something useful from the resulting data, write the results back into InfluxDB, and send alerts to Slack/Twitter/email.
The whole stack has an impressive and detailed , but there will always be useful things that are not explicitly mentioned in the manuals. In this article, I've decided to compile a series of such helpful and non-obvious tips (the basic syntax of TICKscript is described ) and show how to apply them using an example of solving one of our tasks.
Let's go!
float & int, calculation errors
A completely standard problem, solved through casting:
var alert_float = 5.0
var alert_int = 10
data|eval(lambda: float("value") > alert_float OR float("value") < float("alert_int"))
Using default()
If the tag/field is empty, errors will occur in calculations:
|default()
        .tag('status', 'empty')
        .field('value', 0)
fill in join (inner vs outer)
By default, join will drop points where data is missing (inner).
With fill('null'), an outer join will be performed, after which you need to do default() to fill in empty values:
var data = res1
    |join(res2)
        .as('res1', 'res2')
        .fill('null')
    |default()
        .field('res1.value', 0.0)
        .field('res2.value', 100.0)
There is, however, a nuance. If in the example above one of the series (res1 or res2) is empty, the resulting series (data) will also be empty. There are several tickets on GitHub about this (, , ) – we await fixes and endure a bit of pain.
Using Conditions in Calculations (if in lambda)
|eval(lambda: if("value" > 0, true, false)
The last five minutes from the pipeline over the period
For example, you may need to compare the values from the last five minutes with the previous week. You can take two batches of data with two separate batches or extract part of the data from a larger period:
|where(lambda: duration((unixNano(now()) - unixNano("time"))/1000, 1u) < 5m)
An alternative for the last five minutes could be using the BarrierNode, which cuts off data earlier than the specified time:
|barrier()
        .period(5m)
Examples of using Go templates in message
Templates conform to the format from the package , below are several commonly encountered tasks.
if-else
Let’s keep it concise, avoiding unnecessary triggers with the text:
|alert()
    ...
    .message(
        '{{ if eq .Level "OK" }}It is ok now{{ else }}Chief, everything is broken{{end}}'
    )
Two digits after the decimal point in the message
Improving the readability of the message:
|alert()
    ...
    .message(
        'now value is {{ index .Fields "value" | printf "%0.2f" }}'
    )
Expanding variables in the message
Providing more information in the message to answer the question, 'Why is it screaming?'
var warnAlert = 10
  |alert()
    ...
    .message(
       'Today value less than '+string(warnAlert)+'%'
    )
Unique identifier for the alert
A necessary element when there are multiple groups in the data, otherwise, only one alert will be generated:
|alert()
      ...
      .id('{{ index .Tags "myname" }}\/{{ index .Tags "myfield" }}')
Custom handlers
In a large list of handlers, there is exec, which allows you to execute your script with passed parameters (stdin) – pure creativity!
One of our customizations is a small Python script for sending notifications to Slack.
Initially, we wanted to send a Grafana image in the message, protected by authorization. Then – write OK in the thread of the previous alert from the same group, not as a separate message. A little later – include the most frequent error in the message over the last X minutes.
Another topic is the connection to other services and any actions initiated by the alert (only if your monitoring is working well enough).
Example of the handler description, where slack_handler.py is our custom script:
topic: slack_graph
id: slack_graph.alert
match: level() != INFO AND changed() == TRUE
kind: exec
options:
  prog: \/sbin\/slack_handler.py
  args: ["-c", "CHANNELID", "--graph", "--search"]
How to debug?
Option with logging output
|log()
      .level("error")
      .prefix("something")
Check (cli): kapacitor -url :9092 logs lvl=error
Option with httpOut
Shows data in the current pipeline:
|httpOut('something')
Check (get): :9092\/kapacitor\/v1\/tasks\/task_name\/something
Execution scheme
- Each task returns an execution tree with useful numbers in the format .
- Take the block .
- Insert into the viewer, .
Where else can you get timestamps from InfluxDB during reverse write
timestamp in influxdb for reverse recording
For example, we set up an alert for the number of requests per hour (groupBy(1h)) and want to log that alert in influxdb (to nicely show the issue on a graph in grafana).
influxDBOut() will log the time value from the alert, so the point on the graph will be recorded earlier/later than the alert was received.
When accuracy is required: we work around this issue by calling a custom handler that will log the data in influxdb with the current timestamp.
docker, build and deploy
When starting, kapacitor can load tasks, templates, and handlers from the directory specified in the config under the [load] block.
To correctly create a task, the following things are needed:
- File name – expands into id/name of the script
- Type – stream/batch
- dbrp – a keyword for specifying which database + policy the script operates in (dbrp "supplier"."autogen")
If any batch task is missing the dbrp string, the entire service will refuse to start and will clearly indicate this in the log.
In chronograf, on the other hand, this string should not be present; it is not accepted through the interface and returns an error.
A hack when building the container: the Dockerfile exits with -1 if there are lines with //.+dbrp, which will immediately show the reason for the build failure.
join one to many
Example task: we need to take the 95th percentile of service uptime over a week and compare each minute from the last 10 with this value.
You cannot do a one-to-many join; last/mean/median over a group of points turns the node into a stream, returning the error "cannot add child mismatched edges: batch -> stream."
The result of a batch, as a variable in a lambda expression, is also not substituted.
There is an option to save the required numbers from the first batch into a file via udf and load that file through sideload.
What were we solving with this?
We have about 100 hotel suppliers, each of which can have multiple connections, which we will call channels. There are about 300 of these channels, each of which can drop out. From all the recorded metrics, we will monitor the error rate (requests and errors).
Why not grafana?
Alerts for errors set up in grafana have several downsides. Some are critical; others can be overlooked depending on the situation.
Grafana does not handle calculations between metrics + alerting, but we need the rate (requests-errors)/requests.
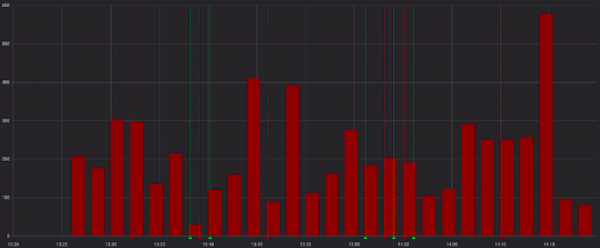
Errors look fierce:
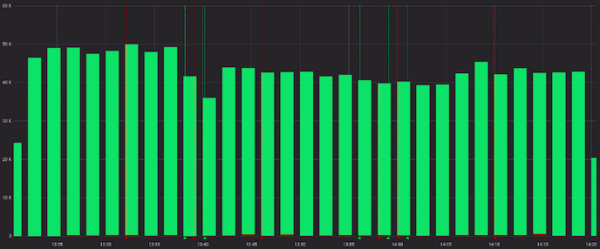
And less fierce when viewed alongside successful requests:
Okay, we can preliminarily calculate the rate in the service before Grafana, and in some cases, it might be suitable. But not in our case, since each channel has its own ratio defined as 'normal,' and alerts work based on static values (we check manually and change it if it triggers too often).
Here are examples of 'normal' for different channels:


Let’s ignore the previous point and assume that all providers have a similar 'normal' picture. Now everything looks good, and can we rely on alerts in Grafana?
We can, but we really don’t want to, because we have to choose one of the options:
a) create multiple graphs for each channel separately (and painfully maintain them)
b) keep one graph for all channels (and get lost among colorful lines and configured alerts)

How did we do it?
Again, the documentation has a good starting example (), which you can refer to or use as a basis for similar tasks.
What we ended up with:
- joining two series over several hours, grouping by channels;
- filling in series by groups if no data was available;
- comparing the median of the last 10 minutes with previous data;
- alerting if something was detected;
- writing the calculated rates and triggered alerts into InfluxDB;
- sending a useful message to Slack.
In my opinion, we successfully achieved everything we wanted as an output (and even a bit more with custom handlers).
You can check out and of the resulting script.
An example of the final code:
dbrp "supplier"."autogen"
var name = 'requests.rate'
var grafana_dash = 'pczpmYZWU/mydashboard'
var grafana_panel = '26'
var period = 8h
var todayPeriod = 10m
var every = 1m
var warnAlert = 15
var warnReset = 5
var reqQuery = 'SELECT sum("count") AS value FROM "supplier"."autogen"."requests"'
var errQuery = 'SELECT sum("count") AS value FROM "supplier"."autogen"."errors"'

var prevErr = batch
 |query(errQuery)
 .period(period)
 .every(every)
 .groupBy(1m, 'channel', 'supplier')

var prevReq = batch
 |query(reqQuery)
 .period(period)
 .every(every)
 .groupBy(1m, 'channel', 'supplier')

var rates = prevReq
 |join(prevErr)
 .as('req', 'err')
 .tolerance(1m)
 .fill('null')
 // fill values with zeros if no data was available
 |default()
 .field('err.value', 0.0)
 .field('req.value', 0.0)
 // if in lambda: calculate rate only if there were errors
 |eval(lambda: if("err.value" > 0, 100.0 * (float("req.value") - float("err.value")) / float("req.value"), 100.0))
 .as('rate')

// write the calculated values to influx
rates
 |influxDBOut()
 .quiet()
 .create()
 .database('kapacitor')
 .retentionPolicy('autogen')
 .measurement('rates')

// select data for the last 10 minutes, calculate the median
var todayRate = rates
 |where(lambda: duration((unixNano(now()) - unixNano("time")) / 1000, 1u)  warnAlert)
 .warnReset(lambda: ("prev.median" - "today.median") < warnReset)
 .flapping(0.25, 0.5)
 .stateChangesOnly()
 // collect in message a link to the grafana dashboard chart
 .message(
 '{{ .Level }}: {{ index .Tags "channel" }} err/req ratio ({{ index .Tags "supplier" }})
{{ if eq .Level "OK" }}It is ok now{{ else }}
'+string(todayPeriod)+' median is {{ index .Fields "today.median" | printf "%0.2f" }}%, by previous '+string(period)+' is {{ index .Fields "prev.median" | printf "%0.2f" }}%{{ end }}
http://grafana.ostrovok.in/d/'+string(grafana_dash)+
'?var-supplier={{ index .Tags "supplier" }}&var-channel={{ index .Tags "channel" }}&panelId='+string(grafana_panel)+'&fullscreen&tz=UTC0300'
 )
 .id('{{ index .Tags "name" }} / {{ index .Tags "channel" }}')
 .levelTag('level')
 .messageField('message')
 .durationField('duration')
 .topic('slack_graph')

// "today.median" duplicates as "value", write other alert fields to influx (keep)
trigger
 |eval(lambda: "today.median")
 .as('value')
 .keep()
 |influxDBOut()
 .quiet()
 .create()
 .database('kapacitor')
 .retentionPolicy('autogen')
 .measurement('alerts')
 .tag('alertName', name)
So what’s the output?
Kapacitor is excellent at performing monitoring and alerting with a multitude of groupings, executing additional calculations on already recorded metrics, carrying out custom actions, and running scripts (udf).
The barrier to entry isn’t too high – give it a try if Grafana or other tools don’t fully meet your needs.
Source: habr.com
