

Note: translation.: This article, authored by Galo Navarro, who holds the position of Principal Software Engineer at the European company Adevinta, is an engaging and educational "investigation" into infrastructure operations. Its original title was slightly modified in translation for reasons that the author explains at the very beginning.
Note from the Author: It seems this publication much more attention than expected. I continue to receive angry comments about the misleading title of the article and that some readers are upset. I understand the reasons for this, so despite the risk of ruining the entire intrigue, I want to immediately explain what this article is about. When teams transition to Kubernetes, I observe an interesting phenomenon: every time a problem arises (for example, increased latency after migration), Kubernetes is immediately blamed, but it turns out that the orchestrator is not at fault. This article discusses one such case. Its title echoes the exclamation of one of our developers (you will see that Kubernetes is not involved here at all). You will not find any unexpected revelations about Kubernetes in it, but you can expect a couple of good lessons about complex systems.
A couple of weeks ago, my team was involved in migrating a microservice to the main platform, which includes CI/CD, a Kubernetes-based working environment, metrics, and other useful tools. The migration was experimental: we planned to use it as a basis and transfer about 150 more services in the coming months. All of them are responsible for the operation of some of the largest online platforms in Spain (Infojobs, Fotocasa, and others).
After we deployed the application in Kubernetes and redirected part of the traffic to it, we encountered a troubling surprise. The latency (latency) of requests in Kubernetes was 10 times higher than in EC2. In general, it was necessary to either find a solution to this problem or abandon the migration of the microservice (and possibly the entire project).
Why is the latency in Kubernetes so much higher than in EC2?
To identify the bottleneck, we collected metrics throughout the request path. Our architecture is simple: the API gateway (Zuul) proxies requests to instances of the microservice in EC2 or Kubernetes. In Kubernetes, we use NGINX Ingress Controller, while the backends are standard objects of type with a JVM application on the Spring platform.
                                  EC2
                            +---------------+
                            |  +---------+  |
                            |  |         |  |
                       +-------> BACKEND |  |
                       |    |  |         |  |
                       |    |  +---------+  |
                       |    +---------------+
             +------+  |
Public       |      |  |
      -------> ZUUL +--+
traffic      |      |  |              Kubernetes
             +------+  |    +-----------------------------+
                       |    |  +-------+      +---------+ |
                       |    |  |       |  xx  |         | |
                       +-------> NGINX +------> BACKEND | |
                            |  |       |  xx  |         | |
                            |  +-------+      +---------+ |
                            +-----------------------------+
It seemed that the issue was related to the initial backend latency (I marked the problematic section on the graph as "xx"). In EC2, the application response took about 20 ms. In Kubernetes, the latency increased to 100—200 ms.
We quickly eliminated the likely suspects related to the runtime environment. The JVM version remained the same. Containerization issues were also not a factor: the application had already been successfully running in containers in EC2. Load? But we observed high latencies even with 1 request per second. Garbage collection pauses could also be disregarded.
One of our Kubernetes administrators inquired whether the application had any external dependencies, as in the past, DNS queries had caused similar issues.
Hypothesis 1: DNS resolution
With each request, our application queries the AWS Elasticsearch instance one to three times in a domain like elastic.spain.adevinta.com. Inside the containers, we have , so we can check whether the domain resolution is taking a long time.
DNS queries from the container:
[root@be-851c76f696-alf8z \/]# while true; do dig "elastic.spain.adevinta.com" | grep time; sleep 2; done
;; Query time: 22 msec
;; Query time: 22 msec
;; Query time: 29 msec
;; Query time: 21 msec
;; Query time: 28 msec
;; Query time: 43 msec
;; Query time: 39 msec
Similar queries from one of the EC2 instances where the application runs:
bash-4.4# while true; do dig "elastic.spain.adevinta.com" | grep time; sleep 2; done
;; Query time: 77 msec
;; Query time: 0 msec
;; Query time: 0 msec
;; Query time: 0 msec
;; Query time: 0 msec
Given that the search takes about 30 ms, it became clear that DNS resolution when addressing Elasticsearch indeed contributes to the increased latency.
However, this was strange for two reasons:
- We already have a number of applications in Kubernetes that interact with AWS resources but do not suffer from high latencies. Whatever the reason, it specifically relates to this case.
- We know that the JVM performs in-memory DNS caching. In our images, the TTL value is specified in
$JAVA_HOME/jre/lib/security/java.securityand is set to 10 seconds:networkaddress.cache.ttl = 10. In other words, the JVM should cache all DNS requests for 10 seconds.
To confirm the first hypothesis, we decided to temporarily eliminate DNS calls and see if the problem would disappear. First, we chose to reconfigure the application to connect to Elasticsearch directly via IP address rather than through the domain name. This would require code changes and redeployment, so we simply mapped the domain to its IP address in /etc/hosts:
34.55.5.111 elastic.spain.adevinta.comNow the container received the IP almost instantly. This resulted in some improvement, but we only slightly approached the expected latency level. Although DNS resolution was taking a long time, the real reason still eluded us.
Network diagnostics
We decided to analyze the traffic from the container using tcpdump, to trace what exactly is happening in the network:
[root@be-851c76f696-alf8z \/]# tcpdump -leni any -w capture.pcap Then we sent some requests and downloaded their capture (kubectl cp my-service:\/capture.pcap capture.pcap) for further analysis in .
There was nothing suspicious in the DNS requests (except for one minor detail I'll discuss later). However, there were certain oddities in how our service was handling each request. Below is a screenshot of the capture showing the receipt of the request before the response began:
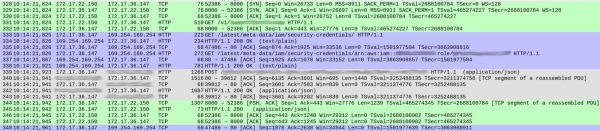
Packet numbers are listed in the first column. For clarity, I highlighted different TCP streams in color.
The green stream beginning with packet 328 shows how the client (172.17.22.150) established a TCP connection with the container (172.17.36.147). After the initial handshake (328-330), packet 331 carried HTTP GET \/v1\/ — an incoming request to our service. The entire process took 1 ms.
The gray stream (from packet 339) indicates that our service sent an HTTP request to the Elasticsearch instance (TCP handshake is absent since an existing connection is used). This took 18 ms.
Everything seems fine so far, and the times are approximately corresponding to the expected latencies (20-30 ms during client measurements).
However, the blue section takes 86 ms. What is happening there? With packet 333, our service sent an HTTP GET request to /latest/meta-data/iam/security-credentials, and immediately after that, another GET request through the same TCP connection to /latest/meta-data/iam/security-credentials/arn:...
We discovered that this repeats with every request throughout the trace. DNS resolution is indeed slightly slower in our containers (the explanation for this phenomenon is quite interesting, but I will save it for a separate article). It turned out that the cause of the significant delays is the calls to the AWS Instance Metadata service with each request.
Hypothesis 2: unnecessary calls to AWS
Both endpoints belong to . Our microservice uses this service when working with Elasticsearch. Both calls are part of the core authorization process. The endpoint being called during the first request provides the IAM role associated with the instance.
/ # curl http://169.254.169.254/latest/meta-data/iam/security-credentials/
arn:aws:iam::<account_id>:role/some_role
The second request queries the second endpoint for temporary credentials for this instance:
/ # curl http://169.254.169.254/latest/meta-data/iam/security-credentials/arn:aws:iam::<account_id>:role/some_role`
{
    "Code" : "Success",
    "LastUpdated" : "2012-04-26T16:39:16Z",
    "Type" : "AWS-HMAC",
    "AccessKeyId" : "ASIAIOSFODNN7EXAMPLE",
    "SecretAccessKey" : "wJalrXUtnFEMI/K7MDENG/bPxRfiCYEXAMPLEKEY",
    "Token" : "token",
    "Expiration" : "2017-05-17T15:09:54Z"
}
The client can use them for a short period and must periodically retrieve new certificates (until their Expiration). The model is simple: AWS frequently rotates temporary keys for security reasons, but clients can cache them for a few minutes, compensating for the performance drop associated with obtaining new certificates.
The AWS Java SDK should handle this process, but for some reason, it is not happening.
After searching through issues on GitHub, we came across the problem . It helped us identify the direction we should 'dig' further.
AWS SDK updates certificates under one of the following conditions:
- The expiration time (
Expiration) falls withinEXPIRATION_THRESHOLD, hardcoded in the code to 15 minutes. - More time has passed since the last attempt to update the certificates than
REFRESH_THRESHOLD, hardcoded to 60 minutes.
To check the actual expiration period of the certificates we receive, we executed the cURL commands mentioned above from both the container and the EC2 instance. The validity period of the certificate obtained from the container was significantly shorter: exactly 15 minutes.
Now everything is clear: for the first request, our service received temporary certificates. Since their validity did not exceed 15 minutes, with each subsequent request, the AWS SDK decided to refresh them. This happened with every request.
Why has the validity of the certificates become shorter?
The AWS Instance Metadata service is designed to work with EC2 instances, not Kubernetes. On the other hand, we did not want to change the application's interface. For this, we used — a tool that allows users (engineers deploying applications in the cluster) to assign IAM roles to containers in pods as if they were EC2 instances, using agents on each Kubernetes node. KIAM intercepts calls to the AWS Instance Metadata service and processes them from its cache, having first obtained them from AWS. From the application's perspective, nothing changes.
KIAM supplies short-lived certificates to pods. This makes sense considering that the average lifespan of a pod is shorter than that of an EC2 instance. By default, the validity period of the certificates .
As a result, when we overlay both default values, a problem arises. Each certificate provided to the application expires after 15 minutes. Meanwhile, the AWS Java SDK forcibly refreshes any certificate that has less than 15 minutes remaining until expiration.
As a result, the temporary certificate is forcibly refreshed with each request, which entails a couple of calls to the AWS API and leads to a significant increase in latency. In the AWS Java SDK, we discovered , which mentions a similar issue.
The solution was simple. We simply reconfigured KIAM to request certificates with a longer validity period. Once this happened, the requests began to go through without involving the AWS Metadata service, and latency dropped even below that in EC2.
Conclusions
Based on our experience with migrations, one of the most frequent sources of problems is not errors in Kubernetes or other platform elements. It is also not related to any fundamental flaws in the microservices we are migrating. Problems often arise simply because we are connecting different elements together.
We are mixing complex systems that have never interacted with each other before, expecting them to form a cohesive, larger system. Unfortunately, the more elements involved, the greater the potential for errors, and the higher the entropy.
In our case, high latency was not the result of errors or poor decisions in Kubernetes, KIAM, AWS Java SDK, or our microservice. It was the outcome of combining two independent default parameters: one in KIAM and the other in AWS Java SDK. Separately, both parameters make sense: the active certificate update policy in AWS Java SDK and the short certificate lifespan in KIAM. But when combined, the results become unpredictable. Two independent and logical solutions do not necessarily have to make sense when combined.
P.S. from the translator
To learn more about the architecture of the KIAM utility for integrating AWS IAM with Kubernetes, you can find more information from its creators.
Also, read in our blog:
- «»;
- «»;
- «»;
- «».
Source: habr.com
