

The task of increasing the communication range with an unmanned aerial vehicle (UAV) remains relevant. This article discusses methods to improve this parameter. It is written for developers and operators of UAVs and continues a series of articles on communication with UAVs (see the beginning of the series in .
Factors affecting communication range
The communication range depends on the modem used, antennas, antenna cables, propagation conditions of radio waves, external interference, and some other factors. To determine the extent of the influence of various parameters on the communication range, let’s consider the range equation.
(1)

where
 — required communication range [meters];
 — speed of light in a vacuum [m/sec];
 — frequency [Hz];
 — transmitter power of the modem [dBm];
 — gain of the transmitting antenna [dBi];
 — losses in the cable from the modem to the transmitting antenna [dB];
 — gain of the receiving antenna [dBi];
 — losses in the cable from the modem to the receiving antenna [dB];
 — sensitivity of the modem receiver [dBm];
 — attenuation multiplier accounting for additional losses caused by the impact of the earth's surface, vegetation, atmosphere, and other factors [dB].
From the equation, it is evident that the range is determined by:
- the modem used;
- the frequency of the radio channel;
- the antennas used;
- losses in the cables;
- the impact of the earth's surface, vegetation, atmosphere, buildings, etc., on the propagation of radio waves.
Next, the parameters affecting the range are considered individually.
Used modem
The communication range depends solely on two parameters of the modem: transmitter power  and receiver sensitivity,
  or rather on their difference — the energy budget of the modem.
(2)

To increase the communication range, it is essential to choose a modem with a higher value.  Increase
  can, in turn, be achieved by increasing
  or by reducing
  . Preference should be given to finding modems with high sensitivity (
 as low as possible), rather than increasing the transmitter power.
  This issue is discussed in detail in the first article. .
In addition to the materials, it is worth noting that some manufacturers, such as Microhard... , specifications for certain devices indicate the peak transmitter power rather than the average, which is several times higher and cannot be used for distance calculation, as this will lead to a significant discrepancy between the calculated distance and the actual value. Devices like the popular pDDL2450 module are examples of this.,] This fact is directly evident from the testing results of this device, conducted to obtain FCC certification. (see p. 58). The testing results for wireless devices that have FCC certification can be viewed on the FCC ID website, , by entering the corresponding FCC ID in the search box, which should be on the label specifying the type of device. The FCC identifier for the pDDL2450 module is as follows: NS916pDDL2450.
Channel frequency
From the range equation, it clearly follows that the lower the operating frequency, , the greater the communication range.  . However, let's not rush to conclusions. The fact is that other parameters involved in the equation also depend on frequency. For instance, the antenna gain coefficients
  will depend on frequency when the maximum dimensions of the antennas
  and
and  are fixed, which is indeed the case in practice. The antenna gain coefficient , expressed in dimensionless units (multiples), can be represented through the physical area of the antenna,as follows:
  - the aperture efficiency of the antenna, i.e., the ratio of the effective area of the antenna to its physical area (depends on the antenna design),
  it is immediately clear that with a fixed antenna area, the gain ratio increases proportionally to the square of the frequency. Let's substitute
(3)

where  , rewriting it first .
From using dimensionless units for antenna gain coefficients, downward API support (simultaneously with this in , cable losses, and the attenuation factor,  ,
,  , as well as using watts instead of dBm. Then,
  ,
,  where the coefficient
  is a constant for fixed antenna dimensions. Thus, in this situation, the communication range is directly proportional to frequency, meaning the higher the frequency, the greater the range.
  and
and  instead of dBm. Then
(4)

where the coefficient  is a constant with fixed antenna dimensions. Thus, in this scenario, the communication range is directly proportional to the frequency, meaning that the higher the frequency, the greater the range. Output. With fixed antenna dimensions, increasing the frequency of the radio link enhances the communication range due to improved directional properties of the antennas. However, it should be noted that as frequency increases, so does the attenuation of radio waves in the atmosphere, caused by gases, rain, hail, snow, fog, and clouds. . Moreover, as the length of the path increases, the attenuation in the atmosphere also rises. For this reason, for each path length and average weather conditions present, there exists a maximum carrier frequency value limited by the allowable signal attenuation in the atmosphere. We will leave the final resolution on the influence of radio channel frequency on communication range until the section where the effect of the Earth's surface and atmosphere on radio wave propagation will be discussed.
Antennas
The communication range is determined by the antenna parameter known as the gain  (gain in English terminology), measured in dBi. The gain is an important composite parameter as it considers: (1) the antenna's ability to focus the transmitter's energy in the direction of the receiver compared to an isotropic radiator (isotropic, hence the index i in dBi); (2) losses within the antenna [,]. To increase communication range, one should choose antennas with the highest possible gain values that fit within the weight and dimension parameters and the guidance system's capabilities. The antenna's ability to focus energy does not come for free but only by increasing the dimensions (aperture) of the antenna. For instance, the larger the receiving antenna, the more area it can collect energy from to provide to the receiver's input, and the more energy collected, the stronger the received signal, thereby increasing communication range. Therefore, one needs to first determine the maximum dimensions of the antennas appropriate for the task at hand and limit the search area by this parameter, before then seeking a specific antenna model, focusing on the maximum gain. A second important practical parameter of the antenna is the beamwidth (beamwidth) [,], measured in angular degrees. Generally, the beamwidth is defined as the angle between two spatial directions from the center of the antenna at which the antenna gain decreases by 3 dB from its maximum. The beamwidth in azimuth and elevation can vary significantly. This parameter is closely related to the dimensions of the antenna by the rule: larger dimensions mean smaller beamwidth. It does not directly enter the range equation, but it determines the requirements for the ground station's (GS) antenna tracking system for UAVs, as highly directional antennas are typically used in GS, especially when maximizing communication range with the UAV is a priority. Indeed, as long as the GS tracking system provides angular accuracy for the antenna aiming at the UAV that is half the beamwidth or less, the level of the received/transmitted signal will not drop below 3 dB from the maximum. Half the beamwidth of the chosen antenna must under no circumstances be less than the angular error of the GS antenna tracking system in azimuth or elevation.
Cables
To maximize communication range, it is necessary to use cables with the lowest possible cable attenuation (or cable loss) at the operational frequency of the GS-UAV radio link. The cable attenuation is defined as the ratio of the signal at the output of a one-meter segment of cable (in the metric system) to the signal at the input of that cable segment, expressed in dB. Losses in the cables  , which are part of the range equation , are determined by multiplying the cable attenuation by the length of the cable. Thus, to achieve the maximum possible communication range, it is necessary to use cables with the minimal allowable cable attenuation and to minimize the length of these cables. On the GS, modem units should be installed directly on the mast next to the antennas. Inside the UAV, the modem should be positioned as close to the antennas as possible. The impedance of the chosen cable should also be monitored. This parameter is measured in Ohms and is usually equal to 50 or 75 Ohms. The impedance of the cable, the modem antenna connector, and the connector on the antenna itself should match.
The influence of the Earth's surface
In this section, we will examine the propagation of radio waves over flat or marine surfaces. Such a scenario often occurs in the practice of using UAVs. Monitoring pipelines, power lines, agricultural crops, and various military and special operations are all well described by this model. Human experience paints a picture where communication between objects is possible if they are within direct optical visibility of each other; otherwise, communication is not possible. However, radio waves do not fall within the optical range, so the situation is somewhat different. In this regard, it is useful for UAV developers and operators to remember the following two facts.
1. Communication in the radio range is possible even without direct visibility between the ground station and the UAV.
2. The influence of the underlying surface on communication with the UAV will be felt even when there are no objects on the optical line between the ground station and the UAV.
To understand the specifics of radio wave propagation near the Earth's surface, it is helpful to familiarize oneself with the concept of the effective propagation area of radio waves. . In the absence of any objects in the effective propagation area of radio waves, range calculations can be performed using formulas for free space, i.e.,  downward API support (simultaneously with this in it can be assumed equal to 0. However, if there are objects in the effective area, this approach should not be taken. In Figure 1, point A shows a point emitter located at a height
  above the Earth's surface, radiating electromagnetic energy in all directions with equal intensity. At point B, at a height of
  there is a receiver to measure the field intensity. In this model, the effective area of radio wave propagation is represented as an ellipsoid with foci at points A and B.
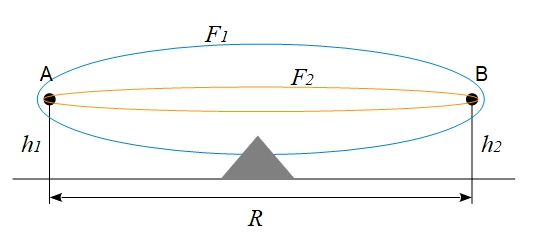
Figure 1. Effective area of radio wave propagation
The radius of the ellipsoid at its "thickest" part is determined by the expression
(5)

From it can be seen that  depends on the frequency
  inversely proportional, meaning the smaller
  , the "thicker" the ellipsoid (
 in Figure 1). Moreover, the "thickness" of the ellipsoid increases with the distance between communication objects. For radio waves,
  can reach quite a substantial size; for instance, at
  10 km,
  2.45 GHz, we get
  50 to 60 m.
Let's now consider the opaque object represented by the gray triangle in Fig. 1. It will influence the propagation of radio waves at a frequency  , since it lies within a significant propagation zone, and will practically have no effect on the propagation of radio waves at a frequency
  . For optical range radio waves (light), the magnitude
  is small, so the Earth's surface does not significantly affect light propagation in practice. Considering that the Earth's surface is spherical, it is easy to understand that as the distance increases
  , the underlying surface will increasingly intrude into the significant propagation zone, thereby blocking the energy flow from point A to point B — the connection with the UAV is interrupted. Similarly, other objects along the route, such as terrain irregularities, buildings, forests, etc., will also affect the connection.
Now let’s look at Fig. 2, where the opaque object completely blocks the significant propagation zone of the radio wave at a frequency  , making communication at that frequency impossible. At the same time, communication at frequency
  is still possible because some of the energy 'jumps' over the opaque object. The lower the frequency, the further a radio wave can propagate beyond the optical horizon, maintaining a stable connection with the UAV.
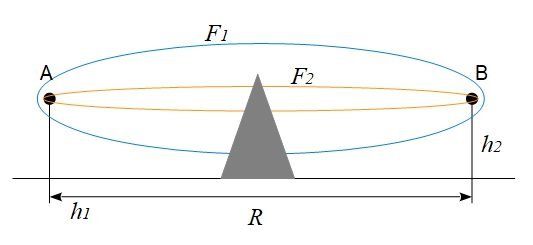
Fig. 2. Overlap of the significant propagation area of radio waves
The degree of influence of the Earth's surface on communication also depends on the height of the antennas  and
and  . The higher the antennas, the further apart points A and B can be without allowing objects or the underlying surface to enter the significant zone.
As an object or underlying surface intrudes into the significant zone, the field strength at point B will oscillate. , i.e., it will vary between higher and lower field intensity levels. This occurs due to the reflection of energy from the object. Reflected energy may combine at point B with the primary energy in phase—leading to an increase in field intensity—or out of phase—resulting in a decrease in field intensity (which can be quite significant). It is important to remember this effect for understanding the specifics of communication with UAVs. Loss of communication with a UAV at a certain distance may be caused by a local decrease in field intensity due to oscillations; that is, if you fly a bit further, communication may be restored. Final communication loss will only occur after complete coverage of a significant zone by objects or the underlying surface. The following methods will be suggested to combat the consequences of field intensity oscillations.
Formulas for calculating the attenuation factor  when propagating radio waves over a smooth surface of the Earth are quite complex, especially for distances
  , exceeding the range of the optical horizon . Therefore, in further consideration of the problem, we will resort to mathematical modeling using a set of computer programs developed by the author. We will consider a typical task of transmitting video from a UAV to a ground station via a 3D Link modem from Geoscan. The initial data are as follows.
1. Height of the antenna at the ground station: 5 m.
2. Flight height of the UAV: 1000 m.
3. Frequency of the radio link: 2.45 GHz.
4. Gain of the ground station antenna: 17 dB.
5. Gain of the UAV antenna: 3 dB.
6. Transmitter power: +25 dBm (300 mW).
7. Bitrate in the video channel: 4 Mbit/sec.
8. Sensitivity of the receiver in the video channel: −100.4 dBm (for the bandwidth occupied by the signal of 12 MHz).
9. Underlying surface: dry soil.
10. Polarization: vertical.
The distance of direct optical visibility for this initial data will be 128.8 km. The calculated results in terms of signal power at the modem receiver input in dBm are presented in Fig. 3.
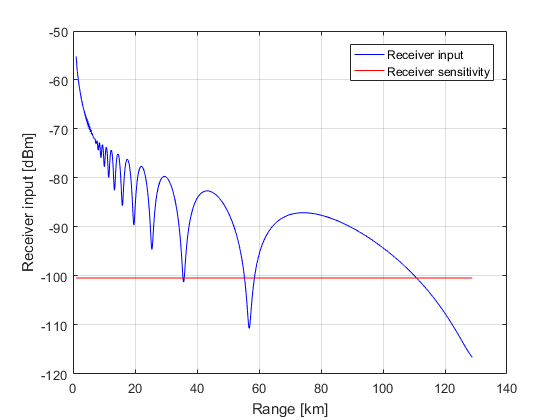
Fig. 3. Signal power at the input of the 3D Link modem receiver
The blue curve in Fig. 3 represents the signal power at the input of the NS receiver, while the red straight line indicates the sensitivity of this receiver. The X-axis shows the range in km, and the Y-axis shows the power in dBm. At the range points where the blue curve is above the red line, video transmission from the UAV is possible; otherwise, there will be no connection. The graph illustrates that due to oscillations, the connection will drop within the range of 35.5–35.9 km and again within the range of 55.3–58.6 km. However, the final disconnection will occur much farther — after 110.8 km of flight.
As mentioned above, the dips in field strength occur due to the out-of-phase superposition of the direct signal and the reflected signal from the Earth's surface at the location of the NS antenna. To eliminate connection loss at the NS due to these dips, two conditions must be met.
1. Use a modem at the NS with at least two receiving channels (RX diversity), such as 3D Link. .
2. Place the receiving antennas on the NS mast at different heights.
The height separation of the receiving antennas must be configured so that dips in field strength at one antenna position are compensated by levels above the sensitivity of the receiver at the position of the other antenna. Fig. 4 presents the results of this approach for the case where one NS antenna is located at a height of 5 m (solid blue curve), and the other is at a height of 4 m (dotted blue curve).
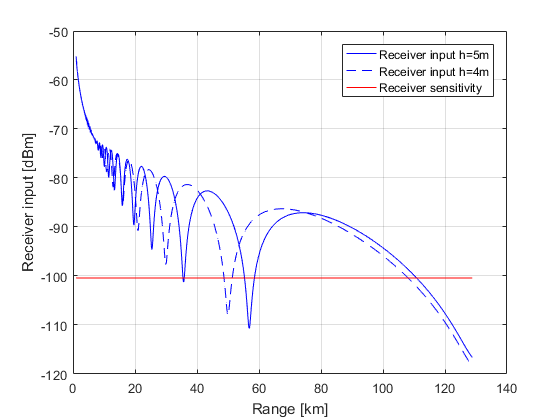
Fig. 4. Signal power at the inputs of two 3D Link modem receivers from antennas positioned at different heights.
Fig. 4 clearly illustrates the effectiveness of this method. Indeed, throughout the entire flight range of the UAV, up to a distance of 110.8 km, the signal at the input of at least one NS receiver exceeds the sensitivity level, meaning that video from the UAV will not be interrupted during the entire flight distance.
However, the proposed method primarily increases the reliability of the radio link from UAV to NS, as the possibility of placing antennas at different heights exists only at the NS. Achieving a height difference of 1 m between antennas on the UAV is not feasible. To enhance the reliability of the radio link from NS to UAV, the following approaches can be used.
1. Feed the transmitter signal from the NS to the antenna that receives a stronger signal from the UAV.
2. Use space-time codes, for example, Alamouti code. .
3. Use the antenna DN management technology (beamforming) with the ability to control the power of the signal directed to each of the antennas.
The first method is close to optimal for communication with UAVs. It is simple, and all the transmitter's energy is directed to the necessary direction — to the optimally placed antenna. For instance, at a distance of 50 km (see Fig. 4), the transmitter's signal is supplied to an antenna suspended at 5 meters, and at a distance of 60 km — to an antenna suspended at 4 meters. This method is used in the 3D Link modem. The second method does not use a priori data about the communication channel state (levels of received signals at the antenna outputs), so it divides the transmitter's energy equally between two antennas, which inevitably leads to energy losses, as one of the antennas may be in the dip of the field strength. The third method provides communication quality equivalent to the first but is much more complex to implement.
Next, let us consider the impact of radio wave frequency on the communication range with UAVs, taking into account the influence of the underlying surface. It has been shown above that increasing the frequency is beneficial, as this leads to increased communication range when the antenna dimensions are fixed. However, the issue of dependence on frequency has not been discussed.  It follows that the ratio of the gain coefficients of antennas with equal areas designed to operate at frequencies is equal to
  and
and  2450 MHz;
(6)

For  915 MHz gives
  7.2 (8.5 dB). This is approximately how it works in practice. For comparison, let's look at the specifications of the following antennas from the manufacturer Wireless Instruments:
  WiBOX PA 0809-8V [13] (frequency: 0.83–0.96 GHz; beamwidth: 70°/70°; gain: 8 dBi);
- WiBOX PA 24-15 [14] (frequency: 2.3–2.5 GHz; beamwidth: 30°/30°; gain: 15 dBi).
- WiBOX PA 24-15 [14] (frequency: 2.3–2.5 GHz; beamwidth: 30°/30°; gain: 15 dBi).
The parameters of these antennas are easy to compare, as they are designed in identical casings of 27x27 cm, meaning they have the same area. It is noteworthy that the gain coefficient of the antennas differs by 15−8=7 dB, which is close to the calculated value of 8.5 dB. From the characteristics of the antennas, it is also evident that the beam width of the antenna in the frequency range of 2.3–2.5 GHz (30°/30°) is more than twice narrower than that of the antenna in the frequency range of 0.83–0.96 GHz (70°/70°), i.e., the gain of the antennas with identical dimensions indeed increases due to improved directional properties. Considering that in the communication line two antennas are used, the ratio  will be 2∙8.5=17 dB. Thus, with the same dimensions of the antennas, the energy budget of the radio line at a frequency
  of 2450 MHz will be greater by 17 dB than the budget of the line at a frequency
  of 915 MHz. In this calculation, we will also take into account that, as a rule, monopole antennas are used for UAVs, for which the dimensions are not as critical as for the panel antennas considered. Therefore, we will assume the gain coefficients of the UAV antenna for the frequencies
  and
and  to be equal. That is, the difference in energy budgets of the lines will be 8.5 dB, not 17 dB. The results of the calculation performed for these initial data and for the height of the panel antenna suspension of 5 m are shown in Fig. 5.
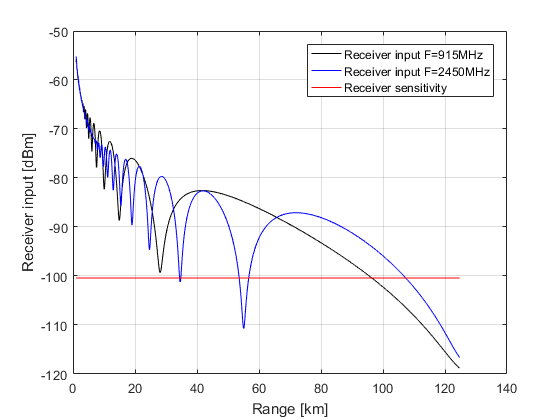
Fig. 5. Signal power at the receiver input for radio lines operating at frequencies of 915 and 2450 MHz
From Fig. 5, it is clearly visible that the range of communication increases with the increase in operating frequency and identical area of the panel antenna, from 96.3 km for the radio line at a frequency of 915 MHz to 110.8 km for the line at a frequency of 2450 MHz. However, the line at 915 MHz has a lower oscillation frequency. Fewer oscillations mean fewer dips in field intensity, i.e., a lower likelihood of losing connection with the UAV over the entire flight distance. This fact may be the reason for the popularity of the sub-gigahertz frequency range for command and telemetry communication lines with UAVs as the most reliable. At the same time, by carrying out the aforementioned complex of actions to protect against oscillations in field intensity, gigahertz range radio lines offer greater communication range due to improved directional properties of the antennas.
From the review of Fig. 5, it can also be concluded that in the shadow zone (after the mark of 128.8 km), a decrease in the operating frequency of the communication line makes sense. Indeed, at a point of approximately −120 dBm, the power curves for frequencies  and
and  intersect. That is, when using receivers with a sensitivity better than −120 dBm, the radio link at a frequency of 915 MHz will provide a greater range of communication. In this case, however, it is necessary to take into account the required throughput of the link, since for such a high sensitivity value, the information speed will be very low. For example, the 3D Link modem although it provides sensitivity up to −122 dBm, the aggregate (in both directions) information transfer rate will be 23 kbps, which is generally sufficient for telemetry communication with UAVs, but clearly insufficient for video transmission from the onboard. Thus, the sub-gigahertz band indeed has a slight advantage over the gigahertz band for telemetry, but clearly loses in characteristics when organizing video lines.
When selecting the frequency of the radio link, it is also necessary to consider signal attenuation when propagating in the Earth's atmosphere. For NS-UAV communication lines, attenuation in the atmosphere is caused by gases, rain, hail, snow, fog, and clouds . For working frequencies of radio links below 6 GHz, gas attenuation can be neglected . The most significant attenuation occurs in rain, especially of high intensity (downpours). Table 1 presents data on specific attenuation [dB/km] in rains of varying intensities for frequencies of 3–6 GHz.
Table 1. Specific attenuation of radio waves [dB/km] in rains of varying intensities depending on frequency
Frequency [GHz]
3 mm/hour (light)
12 mm/hour (moderate)
30 mm/hour (heavy)
70 mm/hour (downpour)
3.00
0.3∙10−3
1.4∙10−3
3.6∙10−3
8.7∙10−3
4.00
0.3∙10−2
1.4∙10−2
3.7∙10−2
9.1∙10−2
5.00
0.8∙10−2
3.7∙10−2
10.6∙10−2
28∙10−2
6.00
1.4∙10−2
7.1∙10−2
21∙10−2
57∙10−2
Table 1 shows that, for example, at a frequency of 3 GHz, the attenuation in rain will be around 0.0087 dB/km, which gives a total attenuation of 0.87 dB over a distance of 100 km. As the operating frequency of the radio link increases, the attenuation in rain sharply rises. For a frequency of 4 GHz, the attenuation in rain on the same link will be 9.1 dB, while at frequencies of 5 and 6 GHz, it will be 28 and 57 dB, respectively. However, it is assumed that rain with the specified intensity occurs along the entire length of the route, which is rarely the case in practice. Nevertheless, when using UAVs in areas where heavy rains are common, it is recommended to choose an operating frequency for the radio link below 3 GHz.
Literature
1. Smorodinov A.A. Habr. 2019.
2. Kalinin A.I., Cherenkova E.L. Propagation of radio waves and operation of radio links. Communications. Moscow. 1971.
3.
4.
5.
6.
7.
8. C.A. Balanis. Antenna theory. Analysis and design. Fourth edition. John Wiley & Sons. 2016.
9. Wikipedia article.
10. Wikipedia article.
11.
12. S.M. Alamouti. "A simple transmit diversity technique for wireless communications". IEEE Journal on Selected Areas in Communications. 16 (8): 1451–1458.
13.
14.
Source: habr.com
