

The more complex a system, the more it accumulates various alerts. This creates the need to respond to, aggregate, and visualize these alerts. I think this situation is familiar to many up to the point of a nervous tick.
The solution we will discuss is not the most unexpected, but a comprehensive article on this topic is not easily found.
Therefore, I decided to share the experiences of FunCorp and explain how the on-call process is organized, who calls, why, and how all of this can be monitored.

What is PagerDuty?
So, to solve all these tasks, we began searching for a convenient tool. After a short search, we settled on PagerDuty. PD seemed to us a fairly complete and concise solution with numerous integrations and settings. What does it consist of?
In short, PagerDuty is an incident management platform that can process incoming incidents through various integrations, set the order of on-call duties, and then alert the on-call engineer depending on the incident level (a phone call for a high level, a push notification from the app/SMS for a low level).
Who is the on-call engineer?
This is probably the first thing to start with when setting up PD.
At FunCorp, as in other companies, there is an honorary position of on-call engineer. It is passed from engineer to engineer once a day. There are so-called first and second response lines for alerts from PagerDuty. Suppose a high-priority alert comes in, and if there is no response from the first-line on-call engineer within 10 minutes after the call (i.e., it has not been acknowledged or resolved), the call goes to the second on-call engineer. This is configured in PagerDuty through Escalation Policies.
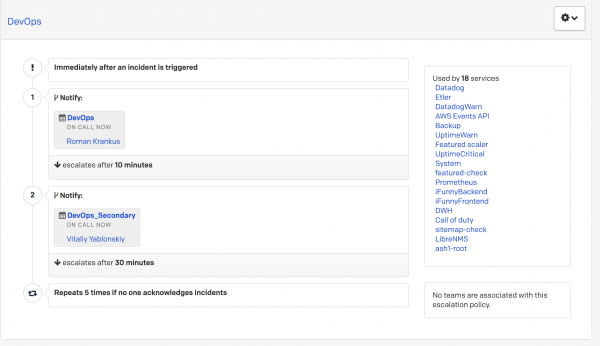
If the second on-call engineer does not respond either, the notification goes back to the primary on-call engineer.
Thus, any incoming high-priority alert cannot go unaddressed.
Now let's look at where incidents might come from.
What integrations do we use?
In PD, a variety of incidents flood in from different services. We currently have about 25 such services, and we use several ready-made integrations to process them.
- Prometheus
The main metrics collection system is Prometheus. A lot has already been written about it on Habr, so I'll just say that we have several instances for different environments: one gathers metrics from virtual machines and Docker containers, another from Amazon services, and a third from physical machines. Telegraf is mainly used as the metrics exporter.
Here as well, I think everything is clear from the name. This integration is used to send notifications from certain scripts executed via cron. PD provides you with an address to which you send emails. When creating a service with this integration, you can configure priorities for processing incoming incidents and specify how alerts will be created (for each incoming email, for an incoming email plus a certain rule, etc.).

- Slack
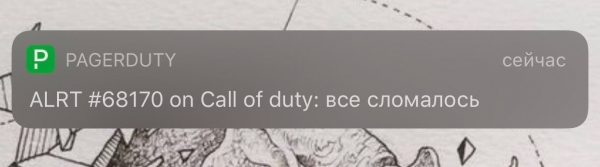
In my opinion, this is a very interesting integration. Sometimes something happens that isn't covered by incidents. Therefore, we added an integration from Slack for creating incidents. That is, in the corporate Slack, you can write /callofduty все тормозит и скоро сломается and PD will process this and send the incident to the on-call engineer.
We do:

We see:
- API
HTTP integration. Here, in fact, there's not much interesting, just a POST request with a JSON body. For example, interestingly enough, we use it for external monitoring with . This service checks the availability of our websites from different locations around the world. If we receive an unacceptable response code (for example, 502), an incident is created, and everything proceeds through the chain described above. StatusCake itself offers the ability to monitor internal URLs, SSL certificate expiration, or domain issues.
- LibreNMS
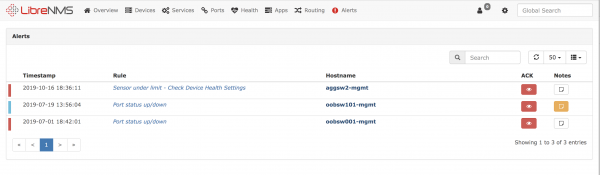
This is another monitoring system, and you can read more about it on their website . With its help, we monitor network interfaces and iDRAC from the servers.
There were also integrations like Datadog and CloudWatch. More details about what has happened with them can be viewed .
Visualization
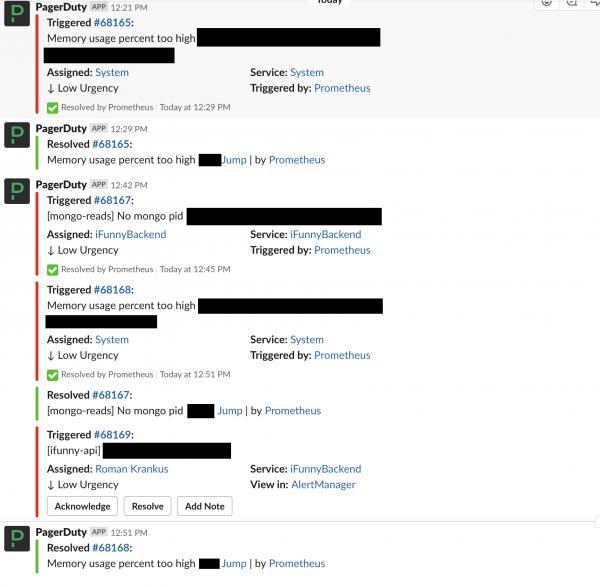
The primary incident notification system is Slack. A special chat logs all incoming incidents in PD, and if their status changes, this is also displayed in the chat.
When the opportunity arose to display useful data on monitors hanging from the ceiling, we suddenly realized that we (in the devops department) had nothing to show on them. There’s wonderful Grafana, but it can't cover everything, and employees respond to alerts, not graphs.
After a thorough but unsuccessful search on GitHub for a concise and informative dashboard for PD, we decided to create our own — only with what we need. Initially, there was an idea to display the PD interface itself, but that seemed even more inconvenient.
To create it, you only need to obtain a key from PD with read-only permissions.
And here’s what we came up with:
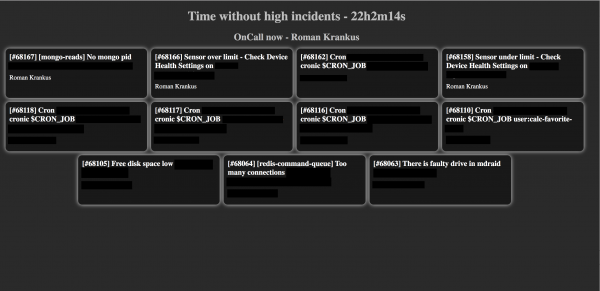
The display shows current open incidents, the name of the current on-call engineer from the selected schedule, and the time without a high-priority incident (the panel with the high-priority incident will be highlighted in red).
.
As a result, we created a convenient dashboard for monitoring all our incidents. I would be glad if our experience proves useful to someone.
Source: habr.com
