


By 2019, we still had no standard solution for log aggregation in Kubernetes. In this article, we would like to share our findings, encountered problems, and their solutions using real-world examples.
However, I should clarify that different clients have very different understandings of log collection:
- some want to see security and audit logs;
- some desire centralized logging of the entire infrastructure;
- while others are content to only collect application logs, excluding, for example, load balancers.
Regarding how we implemented various 'requirements' and the challenges we faced, read on.
Theory: About logging tools
Background on logging system components
Logging has come a long way, resulting in methodologies for log collection and analysis that we apply today. As early as the 1950s, Fortran introduced an equivalent of standard input-output streams, which assisted programmers in debugging their programs. These were the first computer logs that made life easier for programmers of that era. Today, we see the first component of the logging system in them — the source or 'producer' of logs.
Computer science did not stand still: computer networks and the first clusters emerged... Complex systems made up of multiple computers began to operate. System administrators were now required to collect logs from several machines, and in special cases, they might also include kernel messages in case a system failure investigation was necessary. To describe centralized log collection systems, the early 2000s saw the release of , which standardized remote_syslog. This brought about another important component: the log collector and its storage.
With the increasing volume of logs and the widespread adoption of web technologies, the question arose of how to present logs conveniently to users. Advanced log viewers — the third component.
With the increase in log volume, it became clear that logs are necessary, but not all of them. Additionally, different logs require different levels of retention: some can be lost after a day, while others must be kept for 5 years. Thus, a filtering and routing component was added to the logging system, let's call it the filter.
Storage has also made significant strides: from regular files to relational databases, and then to document-oriented storage (such as Elasticsearch). Thus, the storage separated from the collector.
Ultimately, the very concept of a log has expanded to an abstract stream of events that we want to retain for history. More precisely, for the cases when it’s necessary to conduct an investigation or compile an analytical report…
As a result, within a relatively short period, log collection has evolved into an important subsystem, rightly considered one of the subdivisions in Big Data.
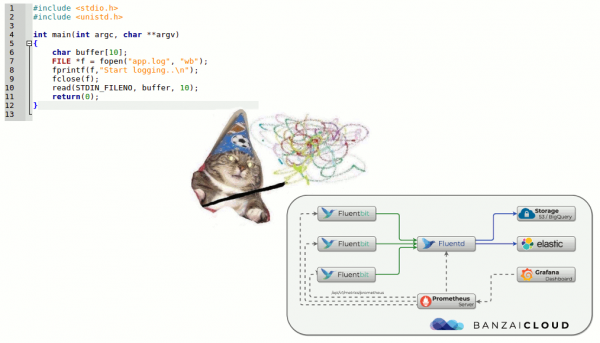
If once ordinary prints might have been sufficient for a 'logging system', the situation has now changed dramatically.
Kubernetes and logs
When Kubernetes entered the infrastructure, the already existing log collection problem also affected it. In a sense, it became even more painful: managing the infrastructure platform was not only simplified but also complicated. Many old services began migrating to microservices. In the context of logs, this translated into an increasing number of log sources, their unique lifecycles, and the need to track the interconnections of all system components through logs…
To jump ahead, I can state that unfortunately, there is currently no standardized logging solution for Kubernetes that stands out favorably from all others. The most popular schemes in the community boil down to the following:
- someone deploys the EFK (Elasticsearch, Fluentd, Kibana);
- someone else is trying the recently released or uses the ;
- we (and maybe not just us? ..) are largely satisfied with our own development — …
Typically, we use such combinations in K8s clusters (for self-hosted solutions):
- ;
- .
However, I won't dwell on the instructions for installing and configuring them. Instead, I'll focus on their shortcomings and the broader insights regarding the situation with logs in general.
Working with logs in K8s

‘Everyday logs,’ how many of you are there?..
Centralized log collection from a sufficiently large infrastructure requires considerable resources for collecting, storing, and processing logs. During the operation of various projects, we encountered various requirements and the associated problems in their maintenance.
Let's try ClickHouse
Let's consider a centralized repository for a project with an application that generates logs quite actively: over 5000 lines per second. We'll start by working with its logs, storing them in ClickHouse.
As soon as maximum real-time is required, a 4-core server with ClickHouse will already be overloaded in terms of the disk subsystem:
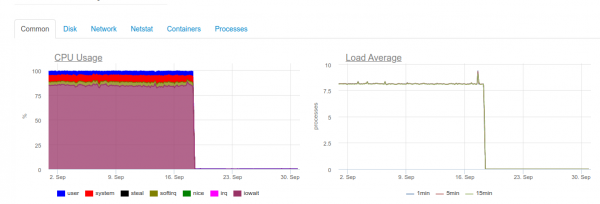
This type of load is linked to our effort to write to ClickHouse as quickly as possible. The database responds with increased disk load, which can cause such errors:
DB::Exception: Too many parts (300). Merges are processing significantly slower than inserts
The fact is that in ClickHouse (where log data is stored) have their own challenges during write operations. The data inserted into them generates a temporary partition, which is then merged with the main table. As a result, writing becomes very demanding on the disk, and there is a limitation, the notification of which we received above: no more than 300 sub-partitions can be merged in one second (basically, this is 300 inserts per second).
To avoid such behavior, in as large batches as possible and no more than once every 2 seconds. However, writing in large batches implies that we should write to ClickHouse less frequently. This, in turn, can lead to buffer overflow and loss of logs. The solution is to increase the Fluentd buffer, but this will also increase memory consumption.
Note: Another problematic aspect of our solution with ClickHouse was that partitioning in our case (loghouse) is implemented through external tables linked This leads to excessive memory usage when querying large time intervals, as the metadata table iterates through all partitions — even those that do not contain the required data. However, this approach can now be confidently deemed outdated for current versions of ClickHouse. ).
As a result, it becomes clear that not every project has sufficient resources for real-time log collection in ClickHouse (more precisely, their allocation would not be practical). Additionally, it will be necessary to use a buffer, which we will return to later. The scenario described above is real. At that time, we could not offer a reliable and stable solution that would satisfy the client and allow collecting logs with minimal latency…
And what about Elasticsearch?
It is known that Elasticsearch handles heavy loads. Let’s try it in the same project. Now the load appears as follows:
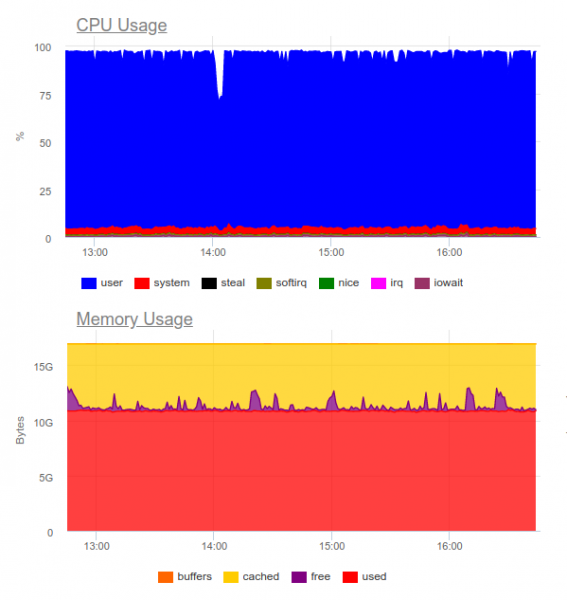
Elasticsearch was able to process the data stream; however, writing such volumes heavily utilizes the CPU. This can be mitigated by organizing a cluster. Technically, this is not an issue, but it means that we are already using about 8 cores just for the log collection system and have an additional high-load component in the system…
Conclusion: this option can be justified, but only if the project is large and its management is willing to allocate significant resources for a centralized logging system.
Then the logical question arises:
Which logs are really needed?
 Let’s try to change the approach: logs should be both informative and not cover every event in the system.
For example, we have a successful online store. Which logs are important? Collecting maximum information, such as from the payment gateway — is a great idea. However, for the image slicing service in the product catalog, not all logs are critical: just errors and extended monitoring (for example, on the percentage of 500 errors generated by this component) will suffice.
So we have come to the conclusion that centralized logging is far from justified in all cases.Very often, the client wants to gather all logs in one place, even though only about 5% of the entire log consists of messages that are critical for the business:
- Sometimes it is enough to configure, say, just the size of the container log and the error collector (for example, Sentry).
- For incident investigation, an error alert and a large local log might often suffice.
- We had projects that relied solely on functional tests and error collection systems. The developer did not need logs per se — they saw everything through error traces.
A real-life example
A good example can be another story. We received a request from the security team of one of our clients, who was already using a commercial solution developed long before the implementation of Kubernetes.
It was necessary to "marry" the centralized logging system with the corporate problem detection sensor — QRadar. This system can accept logs via the syslog protocol and retrieve them via FTP. However, integrating it with the remote_syslog plugin for fluentd did not work right away. (as it turned out, )). The issues with configuring QRadar were on the client's security team's side.
As a result, part of the logs critical for business was uploaded to FTP QRadar, while another part was redirected directly from the nodes via remote syslog. For this, we even wrote — perhaps it will help someone solve a similar task… Thanks to the resulting scheme, the client received and analyzed critical logs (using their favorite tools), while we were able to reduce logging system costs, keeping only the past month.
Another example is quite indicative of how not to do it. One of our clients generated a multi-line unstructured output of information in the log for every event coming from the user. As you might guess, such logs were extremely inconvenient both to read and to store.
Criteria for logs
Such examples lead to the conclusion that in addition to choosing a logging collection system, one must also design the logs themselves!What are the requirements here?
- Logs must be in a machine-readable format (e.g., JSON).
- Logs should be compact and allow for changes in the logging level to debug potential issues. At the same time, in production environments, systems should be run with a logging level like Warning or Error.
- Logs must be normalized, meaning that all entries in the log object should have the same field type.
Unstructured logs can lead to issues with loading logs into storage and a complete halt of their processing. For example, consider an error 400 encountered frequently in fluentd logs:
2019-10-29 13:10:43 +0000 [warn]: dump an error event: error_class=Fluent::Plugin::ElasticsearchErrorHandler::ElasticsearchError error="400 - Rejected by Elasticsearch"
This error indicates that you are sending a field to an index with a predefined mapping where the type is unstable. A simple example is a field in the nginx log with the variable $upstream_status. It can be either a number or a string. For instance:
{ "ip": "1.2.3.4", "http_user": "-", "request_id": "17ee8a579e833b5ab9843a0aca10b941", "time": "29/Oct/2019:16:18:57 +0300", "method": "GET", "uri": "\/staffs\/265.png", "protocol": "HTTP\/1.1", "status": "200", "body_size": "906", "referrer": "https:\/\/example.com\/staff", "user_agent": "Mozilla\/5.0 (Windows NT 10.0; Win64; x64) AppleWebKit\/537.36 (KHTML, like Gecko) Chrome\/78.0.3904.70 Safari\/537.36", "request_time": "0.001", "cache_status": "-", "upstream_response_time": "0.001, 0.007", "upstream_addr": "127.0.0.1:9000", "upstream_status": "200", "upstream_response_length": "906", "location": "staff"}
 { "ip": "1.2.3.4", "http_user": "-", "request_id": "47fe42807f2a7d8d5467511d7d553a1b", "time": "29/Oct/2019:16:18:57 +0300", "method": "GET", "uri": "\/staff", "protocol": "HTTP\/1.1", "status": "200", "body_size": "2984", "referrer": "-", "user_agent": "Mozilla\/5.0 (Windows NT 10.0; Win64; x64) AppleWebKit\/537.36 (KHTML, like Gecko) Chrome\/78.0.3904.70 Safari\/537.36", "request_time": "0.010", "cache_status": "-", "upstream_response_time": "0.001, 0.007", "upstream_addr": "10.100.0.10:9000, 10.100.0.11:9000", "upstream_status": "404, 200", "upstream_response_length": "0, 2984", "location": "staff"}
The logs show that server 10.100.0.10 responded with a 404 error, and the request went to another content storage. As a result, the log value became like this:
"upstream_response_time": "0.001, 0.007"
This situation is so common that it has even earned a separate .
But what about reliability?
There are cases where it is vital to have all logs without exception. Typical log collection schemes for K8s discussed above have issues with this.
For example, fluentd cannot collect logs from short-lived containers. In one of our projects, a container for database migration lived for less than 4 seconds before being deleted as per the corresponding annotation:
"helm.sh/hook-delete-policy": hook-succeeded
Because of this, the migration execution log did not make it to storage. A policy can help in this case before-hook-creation.
Another example is Docker log rotation. Suppose there is an application that actively writes to logs. Under normal conditions, we manage to process all logs, but as soon as an issue arises — like the one described above with the incorrect format — processing halts, and Docker rotates the file. The result is that critical business logs may be lost.
That is why it is important to separate log streams, embedding the transmission of the most valuable logs directly in the application to ensure their preservation. Additionally, creating some kind of ‘log accumulator’, which can withstand brief unavailability of storage while keeping critical messages, would not be excessive.
Finally, do not forget that it is crucial to monitor any subsystem effectivelyOtherwise, it's easy to encounter a situation where fluentd is in a state CrashLoopBackOff and sends nothing, which risks losing important information.
Conclusions
In this article, we do not consider SaaS solutions like Datadog. Many of the issues described here have already been addressed by commercial companies specializing in log collection, but not everyone can use SaaS for various reasons. (the main ones being cost and compliance with 152-FZ).
Centralized log collection may initially seem like a simple task, but it is not at all. It's important to remember that:
- You should only log critical components in detail, while monitoring and error collection can be set up for other systems.
- Logs in production should be minimal to avoid unnecessary load.
- Logs should be machine-readable, normalized, and have a strict format.
- Really critical logs should be sent through a separate stream, distinct from the main one.
- Consider implementing a log buffer that can protect against spikes in load and create a more even storage load.

If these simple rules are applied universally, it would allow the above-mentioned schemes to operate — even though they lack important components (the buffer). Failing to adhere to such principles can easily lead you and your infrastructure to yet another high-load (and at the same time, ineffective) component of the system.
P.S.
Also read in our blog:
- «»;
- «»;
- «».
Source: habr.com
