


Previously We met with the ELK stack, which consists of various software products. The first task an engineer faces when working with the ELK stack is sending logs for storage in Elasticsearch for subsequent analysis. However, this is only simple in theory; Elasticsearch stores logs in the form of documents with specific fields and values, meaning the engineer must use various tools to parse the message sent from the end systems. This can be done in several ways: either by writing a program that adds documents to the database via API or by using already existing solutions. Within this course, we will consider a solution Logstash, which is part of the ELK stack. We'll look at how to send logs from end systems to Logstash, and then we will configure the configuration file for parsing and redirecting to the Elasticsearch database. For this, we will take logs from the Check Point firewall as our input system.
The course does not cover the installation of the ELK stack, as there are a multitude of articles available on this topic; we will focus on the configuration aspect.
Let's outline the action plan for configuring Logstash:
- Check that Elasticsearch will accept logs (check functionality and port accessibility).
- Consider how we can send events to Logstash, choose a method, and implement it.
- Configure Input in the Logstash configuration file.
- Configure Output in the Logstash configuration file in debug mode to understand how the log message looks.
- Configure Filter.
- Configure the correct Output in Elasticsearch.
- Launch Logstash.
- Check the logs in Kibana.
Let's look more closely at each point:
Check that Elasticsearch will accept logs.
You can verify this by using the curl command to check access to Elasticsearch from the system where Logstash is deployed. If you have authentication set up, you must also pass the username/password through curl, specifying port 9200 if you haven't changed it. If you receive a response like the one indicated below, everything is fine.
[elastic@elasticsearch ~]$ curl -u <>:<> -sS -XGET "<>:9200"
{
  "name" : "elastic-1",
  "cluster_name" : "project",
  "cluster_uuid" : "sQzjTTuCR8q4ZO6DrEis0A",
  "version" : {
    "number" : "7.4.1",
    "build_flavor" : "default",
    "build_type" : "rpm",
    "build_hash" : "fc0eeb6e2c25915d63d871d344e3d0b45ea0ea1e",
    "build_date" : "2019-10-22T17:16:35.176724Z",
    "build_snapshot" : false,
    "lucene_version" : "8.2.0",
    "minimum_wire_compatibility_version" : "6.8.0",
    "minimum_index_compatibility_version" : "6.0.0-beta1"
  },
  "tagline" : "You Know, for Search"
}
[elastic@elasticsearch ~]$
If no response is received, there may be several types of errors: the elasticsearch process is not running, the wrong port is specified, or the port is blocked by a firewall on the server where elasticsearch is installed.
Let's see how we can send logs to Logstash from the Check Point firewall.
From the Check Point management server, logs can be sent to Logstash via syslog, using the log_exporter utility; more details can be found here. , here we will leave only the command that creates the stream:
cp_log_export add name check_point_syslog target-server <> target-port 5555 protocol tcp format generic read-mode semi-unified
<> — the address of the server where Logstash is running, target-port 5555 — the port to which we will send logs; sending logs via tcp can load the server, so in some cases it's more appropriate to use udp.
Configuring INPUT in the Logstash configuration file.
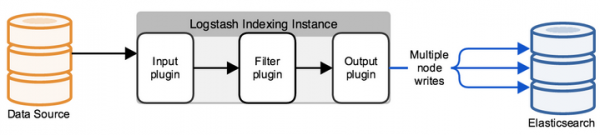
By default, the configuration file is located in the directory /etc/logstash/conf.d/. The configuration file consists of 3 meaningful parts: INPUT, FILTER, OUTPUT. In INPUT we specify where the system will get the logs from, in FILTER we parse the log — set up how to split the message into fields and values, in OUTPUT we configure the outgoing stream — where the parsed logs will be sent.
First, let's configure INPUT; we'll consider some types that may exist — file, tcp, and exe.
Tcp:
input {
tcp {
    port => 5555
    host => “10.10.1.205”
    type => "checkpoint"
    mode => "server"
}
}
mode => «server»
Indicates that Logstash is accepting connections.
port => 5555
host => “10.10.1.205”
We accept connections on the IP address 10.10.1.205 (Logstash), port 5555 — the port must be allowed by the firewall policy.
type => «checkpoint»
We tag the document, which is very convenient if you have multiple incoming connections. Subsequently, a custom filter can be written for each connection using the logical if structure.
File:
input {
  file {
    path => "\/var\/log\/openvas_report\/*"
    type => "openvas"
    start_position => "beginning"
    }
}
Description of settings:
path => «\/var\/log\/openvas_report\/*»
Specify the directory that contains the files to be read.
type => "openvas"
Event type.
start_position => "beginning"
When changing the file, it reads the entire file; if you set it to "end," the system waits for new entries to appear at the end of the file.
Exec:
input {
  exec {
    command => "ls -alh"
    interval => 30
  }
}
This input launches (only!) a shell command, and its output is wrapped in a log message.
command => "ls -alh"
The command whose output we're interested in.
interval => 30
The interval for calling the command in seconds.
To accept logs from the firewall, we set up the filter. tcp or udp, depending on how the logs are sent to Logstash.
Configure the Output in the Logstash configuration file in debug mode to understand how the log message looks.
After configuring INPUT, we need to understand how the log message will look and which methods to use for configuring the filter (parser) for the logs.
To do this, we will use a filter that outputs results to stdout to view the original message. The complete configuration file at this point will look like this:
input
{
         tcp
         {
                port => 5555
			 type => "checkpoint"
			 mode => "server"
                host => "10.10.1.205"
	 }
}

output
{
	if [type] == "checkpoint"
       {
		stdout { codec => json }
	}
}
We run the command to check:
sudo /usr/share/logstash/bin/logstash -f /etc/logstash/conf.d/checkpoint.conf
We see the result; the image is clickable:
If copied, it will look like this:
action="Accept" conn_direction="Internal" contextnum="1" ifdir="outbound" ifname="bond1.101" logid="0" loguid="{0x5dfb8c13,0x5,0xfe0a0a0a,0xc0000000}" origin="10.10.10.254" originsicname="CN=ts-spb-cpgw-01,O=cp-spb-mgmt-01.tssolution.local.kncafb" sequencenum="8" time="1576766483" version="5" context_num="1" dst="10.10.10.10" dst_machine_name="ts-spb-dc-01@tssolution.local" layer_name="TSS-Standard Security" layer_name="TSS-Standard Application" layer_uuid="dae7f01c-4c98-4c3a-a643-bfbb8fcf40f0" layer_uuid="dbee3718-cf2f-4de0-8681-529cb75be9a6" match_id="8" match_id="33554431" parent_rule="0" parent_rule="0" rule_action="Accept" rule_action="Accept" rule_name="Implicit Cleanup" rule_uid="6dc2396f-9644-4546-8f32-95d98a3344e6" product="VPN-1 & FireWall-1" proto="17" s_port="37317" service="53" service_id="domain-udp" src="10.10.1.180" ","type":"qqqqq","host":"10.10.10.250","@version":"1","port":50620}{"@timestamp":"2019-12-19T14:50:12.153Z","message":"time="1576766483" action="Accept" conn_direction="Internal" contextnum="1" ifdir="outbound" ifname="bond1.101" logid="0" loguid="{0x5dfb8c13,
Looking at the data messages, we see that the logs are formatted as: field = value or key = value, which means the filter called kv is applicable. To correctly select the filter for each specific case, it would be beneficial to familiarize ourselves with them in the technical documentation or ask a friend.
Configuring the Filter
In the previous step, we selected kv, below is the configuration for this filter:
filter {
if [type] == "checkpoint"{
	kv {
		value_split => "="
		allow_duplicate_values => false
	}
}
}
We choose the symbol by which we will separate the field and value — "= " If we have identical entries in the log, we store only one instance in the database; otherwise, you will end up with an array of identical values. For example, if we have the message "foo = some foo=some" we only save foo = some.
Setting up the correct Output in ElasticSearch
Once the Filter is configured, logs can be exported to the database. Elasticsearch:
output
{
if [type] == "checkpoint"
{
 	elasticsearch
        {
		hosts => ["10.10.1.200:9200"]
		index => "checkpoint-%{+YYYY.MM.dd}"
    		user => "tssolution"
    		password => "cool"
  	}
}
}
If a document is signed with the type checkpoint, we save the event to the elasticsearch database, which accepts connections on 10.10.1.200 on port 9200 by default. Each document is saved to a specific index, in this case, we save to the index "checkpoint-" + the current date. Each index can have a specific set of fields, or it is created automatically when a new field appears in the message; the settings for fields and their types can be viewed in mappings.
If authentication is set up (to be discussed later), credentials for writing to a specific index must be specified; in this example, it is "tssolution" with the password "cool". User rights can be restricted to allow log writing only to a specific index and nothing more.
Starting Logstash.
Logstash configuration file:
input
{
         tcp
         {
                port => 5555
  	  	type => "checkpoint"
    		mode => "server"
                host => "10.10.1.205"
   	 }
}

filter {
        if [type] == "checkpoint"{
	kv {
		value_split => "="
		allow_duplicate_values => false
	}
        }
}

output
{
if [type] == "checkpoint"
{
 	elasticsearch
        {
		hosts => ["10.10.1.200:9200"]
		index => "checkpoint-%{+YYYY.MM.dd}"
    		user => "tssolution"
    		password => "cool"
  	}
}
}
Checking the configuration file for correctness:
/usr/share/logstash/bin//logstash -f checkpoint.conf

Starting the Logstash process:
sudo systemctl start logstash
Checking that the process has started:
sudo systemctl status logstash
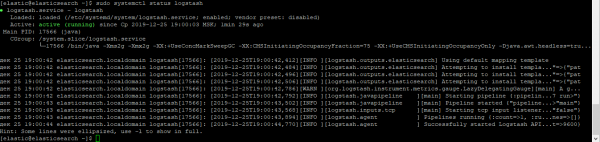
Checking whether the socket is up:
netstat -nat |grep 5555

Check the logs in Kibana.
Once everything is up and running, we access Kibana — Discover, ensuring everything is set up correctly, and the image is clickable!
All logs are in place, and we can see all fields and their values!
Conclusion
We discussed how to write a Logstash configuration file, resulting in a parser for all fields and values. Now we can work with searching and creating charts based on specific fields. In the following course sections, we will explore visualization in Kibana and create a simple dashboard. It’s worth mentioning that the Logstash configuration file needs to be constantly updated in certain situations, for example, when we want to replace a field value from a number to a word. In the upcoming articles, we will do this regularly.
So stay tuned for updates (, , , ), .
Source: habr.com
