

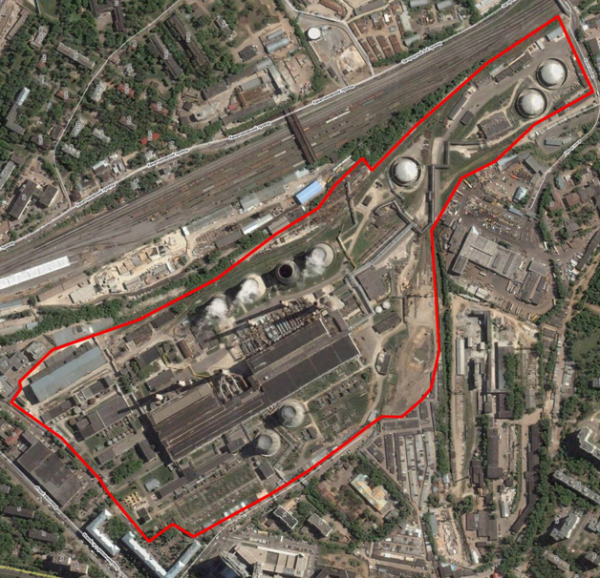
There is a large heat and power plant. It operates as usual: burning gas, producing heat for home heating and electricity for the grid. The primary task is heating. The second is to sell all produced electricity on the wholesale market. Sometimes, in freezing weather under a clear sky, snow appears, but that is a side effect of cooling towers operation.
An average heat and power plant consists of a couple of dozen turbines and boilers. If the required volumes of electricity and heat production are known, the task boils down to minimizing fuel costs. In this case, the calculation involves selecting the composition and load percentage of turbines and boilers to achieve the highest possible efficiency. The efficiency of turbines and boilers greatly depends on the type of equipment, hours of operation without maintenance, operating mode, and many other factors. There is also another task where, given the prices of electricity and volumes of heat, it is necessary to determine how much electricity to produce and sell to maximize profit in the wholesale market. In this scenario, the optimization factor — profit and equipment efficiency — becomes much less significant. The result can be a mode where the equipment operates absolutely inefficiently, but the entire volume of produced electricity can be sold at maximum margin.
In theory, all of this is well understood and sounds nice. The problem is how to implement it in practice. We started simulating the operation of each piece of equipment and the entire plant as a whole. We visited the heat and power plant and began collecting parameters from all units, measuring their actual characteristics and evaluating performance in various modes. Based on these, we created accurate models for simulating the operation of each piece of equipment and used them for optimization calculations. To give you a preview, we achieved about a 4% real efficiency increase simply through mathematics.
We succeeded. But before describing our solutions, I will discuss how a heat and power plant operates from the perspective of decision-making logic.
Basic concepts
The main components of a power plant are boilers and turbines. Turbines are driven by high-pressure steam, which in turn rotates generators that produce electricity. The residual energy of the steam is used for heating and hot water. Boilers are the places where steam is created. Heating the boiler and accelerating the steam turbine takes a lot of time (hours), resulting in direct fuel losses. The same applies to load changes. Such things need to be planned in advance.
The equipment of a CHP has a technical minimum, which includes a minimum yet stable operating mode that can provide sufficient heating to homes and industrial consumers. Usually, the required amount of heat directly depends on the weather (air temperature).
Each unit has an efficiency curve and a point of maximum efficiency: at a certain load, a specific boiler and turbine provide the cheapest electricity. Cheap in the sense of minimal specific fuel consumption.
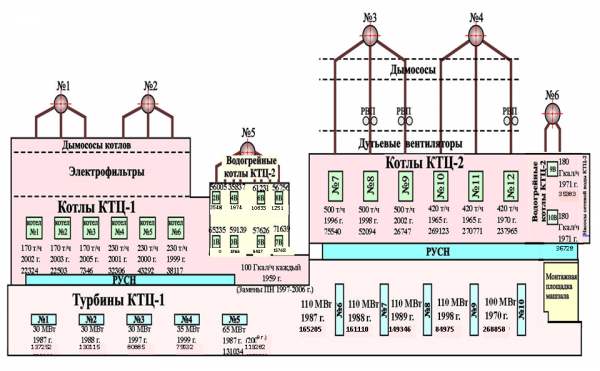
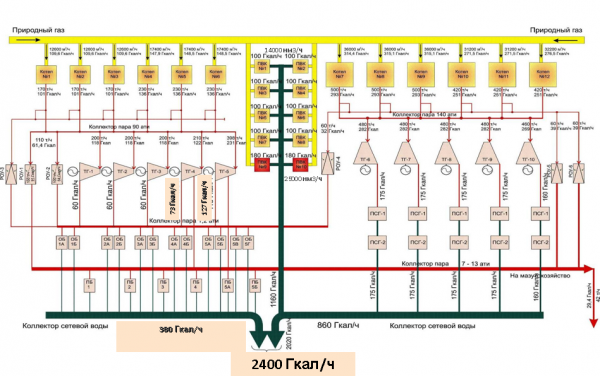
Most CHP plants in Russia operate with parallel connections, where all boilers work on a single steam collector and all turbines are also fed from one collector. This adds flexibility in loading the equipment but complicates calculations significantly. Sometimes, the station's equipment is divided into parts that operate on different collectors with varying steam pressures. And when you add costs for internal needs — the operation of pumps, fans, cooling towers, and, to be honest, saunas right behind the CHP fence — things can get quite complicated.
The characteristics of all equipment are nonlinear. Each unit has a curve with zones where efficiency is higher and lower. This depends on the load: at 70% the efficiency will be one, at 30% — another.
The equipment varies in characteristics. There are new and old turbines and boilers, as well as units of different designs. By correctly selecting the equipment and optimally loading it at points of maximum efficiency, it is possible to reduce fuel consumption, leading to cost savings or greater margins.
How does a CHP know how much energy needs to be produced?
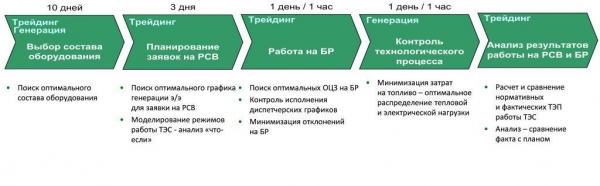
Planning is done three days in advance: the planned composition of equipment is known three days ahead. These are the turbines and boilers that will be operational. In other words, we know that today five boilers and ten turbines will be working. We cannot turn on different equipment or switch off what is planned, but we can adjust the load for each boiler from minimum to maximum, and for turbines, we can increase or decrease the power. The transition from maximum to minimum takes between 15 to 30 minutes depending on the equipment unit. The task here is simple: to select optimal modes and maintain them with operational adjustments in mind.
Where did this equipment setup come from? It was determined by the results of trading on the wholesale market. There is a market for capacity and electricity. In the capacity market, producers submit requests: 'We have this equipment, here are the minimum and maximum capacities considering scheduled maintenance. We can supply 150 MW at this price, 200 MW at that price, and 300 MW at another price.' These are long-term requests. On the other hand, large consumers also submit requests: 'We need this amount of energy.' Specific prices are determined at the moment when the capabilities of energy producers intersect with what consumers want to take. These capacities are determined for each hour of the day.
Typically, a heating and power station carries a roughly uniform load throughout the season: in winter, the primary product is heat, while in summer, it is electricity. Significant deviations are usually related to some accidents at the station itself or at neighboring power plants within the same pricing zone of the wholesale market. However, there are always fluctuations, and these fluctuations greatly impact the economic efficiency of the station's operation. The required power can be supplied by three boilers running at 50% load or two at 75%, and it is necessary to determine which option is more efficient.
Profitability depends on market prices and the cost of electricity generation. Market prices can align in such a way that it's profitable to burn fuel but sell electricity at a good price. Alternatively, there might be instances where one has to operate at a technical minimum during specific hours to mitigate losses. Additionally, one must remember about fuel reserves and costs: natural gas, for instance, is usually limited, and excess gas is significantly more expensive, not to mention the costs associated with fuel oil. All of this necessitates precise mathematical models to understand what bids to place and how to respond to changing circumstances.
How it was done before we arrived
Practically on paper with not very accurate equipment specifications, which have a large deviation from the actual figures. Immediately after equipment tests, at best, they will be plus or minus 2% from the actual results, and a year later — plus or minus 7-8%. Testing is conducted every five years, often even less frequently.
The next point is that all calculations are conducted in conditional fuel. In the USSR, a scheme was adopted where a certain conditional fuel was calculated to compare different stations using fuel oil, coal, gas, nuclear generation, and so on. It was necessary to understand the efficiency in 'conditional units' of each generator, where conditional fuel represents that very unit. It is determined by the calorific value of the fuel: one ton of conditional fuel is approximately equal to one ton of anthracite coal. There are conversion tables for different types of fuel. For instance, the performance metrics for brown coal are almost twice as poor. However, calorific value is not tied to currency. It’s similar to gasoline and diesel: it’s not a given that if diesel is priced at 35 rubles and 92-octane gasoline at 32 rubles, then diesel will perform better in calorific value.
The third factor is the complexity of calculations. Typically, based on an employee's experience, two or three options are calculated, and more often than not, the best mode is chosen from historical data for similar loads and weather conditions. Naturally, employees believe they are selecting the most optimal modes and assume that no mathematical model can ever surpass them.
We arrive at a solution by preparing a digital twin — a simulation model of the power plant. This involves using specialized approaches to simulate all technological processes for each piece of equipment, consolidating steam-water and energy balances, and obtaining an accurate model of the CHPP's operation.
To create the model, we use:
- The design and specifications of the equipment.
- Characteristics based on the latest equipment tests: tests are conducted every five years to verify and update equipment specifications.
- Data in the archives of the Automated Process Control System (APCS) and accounting systems for all available technological indicators, expenses, and heat and electricity generation. In particular, data from accounting systems for heat and electricity delivery, as well as from telemetry systems.
- Data from strip and circular paper charts. Yes, such analog methods of recording equipment performance parameters are still used at Russian power plants, and we digitize them.
- Paper logs at the plants, where the main operational parameters are constantly recorded, including those not captured by APCS sensors. An inspector makes rounds every four hours, copies the readings, and records everything in the log.
In other words, we have reconstructed datasets regarding what mode operated, the amount of fuel supplied, the temperature and steam consumption, and how much thermal and electrical energy was produced at the output. From thousands of such datasets, we needed to gather characteristics of each node. Fortunately, we have been adept at this Data Mining for a long time.
Describing such complex objects using mathematical models is extremely challenging. Even more difficult is convincing the chief engineer that our model accurately calculates the power plant's operating modes. Therefore, we opted for specialized engineering complexes that allow us to assemble and refine the CHPP model based on the structural and technological characteristics of the equipment. We chose Termoflow software from the American company TermoFlex. At that time, this package was the best in its class, although Russian alternatives have emerged since then.
For each unit, its design and main technological characteristics are selected. The system allows for a very detailed description at both the logical and physical levels, even specifying the degree of deposits in the heat exchanger tubes.
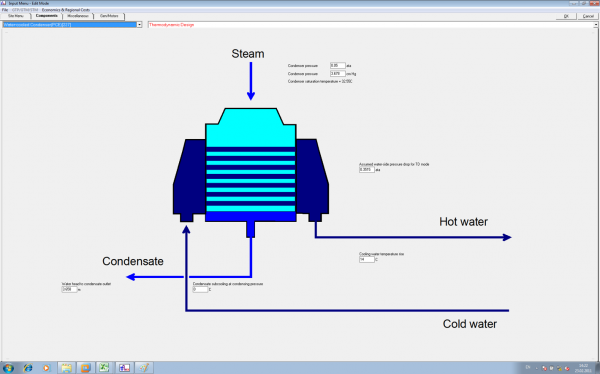
As a result, the thermal scheme model of the station is visually described in terms of power engineers. Technologists do not understand programming, mathematics, and modeling, but they can select the design of the unit, the inlets and outlets of the aggregates, and specify the parameters on them. The system then selects the most suitable parameters, and the technologist refines them to achieve maximum accuracy for the entire range of operating modes. We set a goal for ourselves — to ensure a model accuracy of 2% for the main technological parameters, and we achieved this.
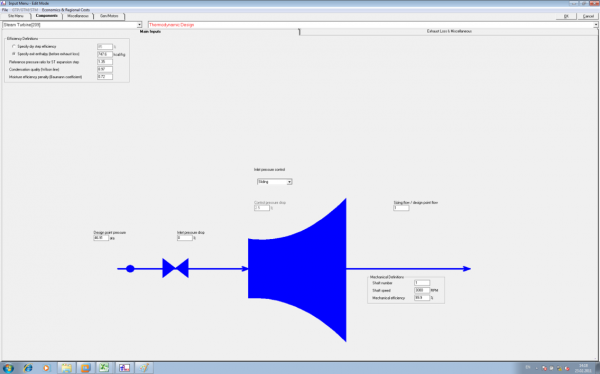
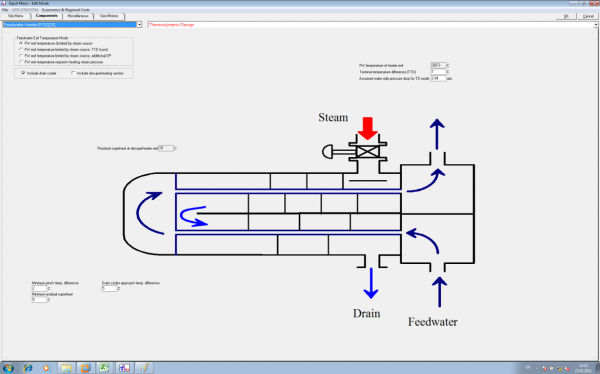
It turned out to be not so simple: the initial data were not very accurate, so for the first couple of months, we walked around the CHP plant and manually recorded current readings from the manometers and tuned the model to the actual modes. We started by modeling the turbines and boilers, carefully adjusting each turbine and boiler. To verify the model, we created a working group that included representatives from the CHP.
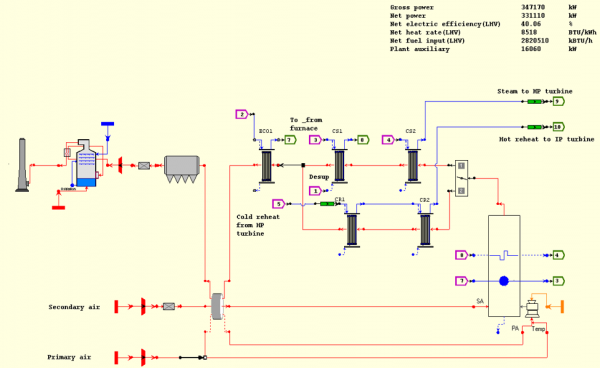
Then we assembled all the equipment into a general scheme and tuned the CHP model as a whole. It required some effort, as there were many conflicting data in the archives. For example, we found modes with an overall efficiency of 105%.
When assembling the complete scheme, the system always calculates a balanced mode: material, electrical, and thermal balances are formed. We then assess how everything in the assembly corresponds to the actual parameters of the mode based on the indicators from the instruments.
What we achieved
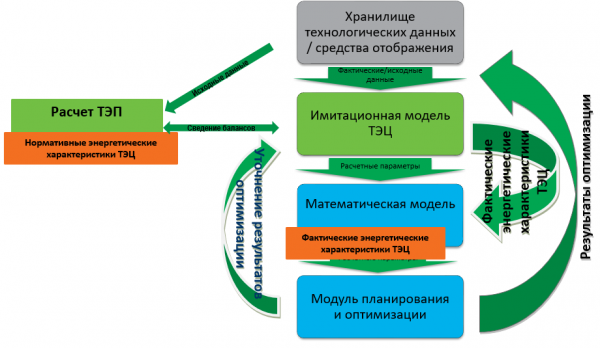
As a result, we obtained an accurate model of the CHP processes based on the actual characteristics of the equipment and historical data. This allowed for more precise forecasting than based solely on testing characteristics. It resulted in a simulator of the real processes of the station, a digital twin of the CHP.
In this simulator, we implemented the ability to conduct analyses based on scenarios of 'what if...' for given indicators. This model was also used to address the optimization of the operation of the actual station.
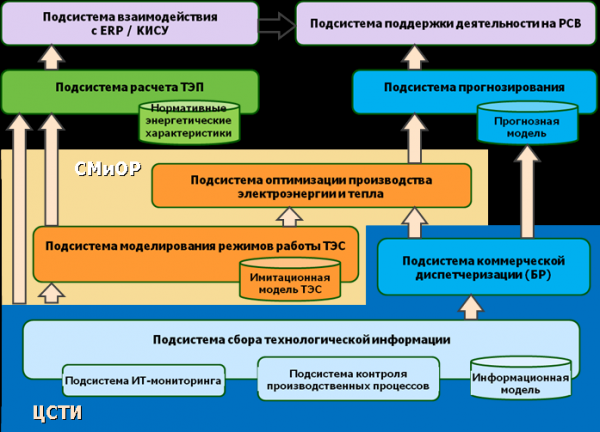
We managed to implement four optimization calculations:
- The shift manager of the station knows the heat supply schedule, the commands of the system operator are known, and the electricity supply schedule is clear: which equipment to use for what loads to maximize margins.
- Selection of equipment composition based on market price forecasts: on a specified date, taking into account the load schedule and outdoor temperature forecast, we determine the optimal composition of equipment.
- Submitting bids on the market one day in advance: when the equipment composition is established and a more accurate price forecast is available. We calculate and submit the bid.
- The balancing market — within the current days, when electrical and thermal schedules are fixed, but several times a day every four hours, trading starts in the balancing market, and you can submit a request: 'I ask to add 5 MW to my load.' It is necessary to find the proportions of overload or underload that provide maximum margin.
Testing
For accurate testing, we needed to compare standard loading modes of the station's equipment with our calculated recommendations under identical conditions: equipment composition, load schedules, and weather. Over a couple of months, we selected time intervals of four to six hours with stable graphs. We came to the station (often at night), waited for the station to reach its mode, and only then calculated it in the simulation model. If the shift manager was satisfied, we sent the operational personnel to adjust valves and change the equipment modes.
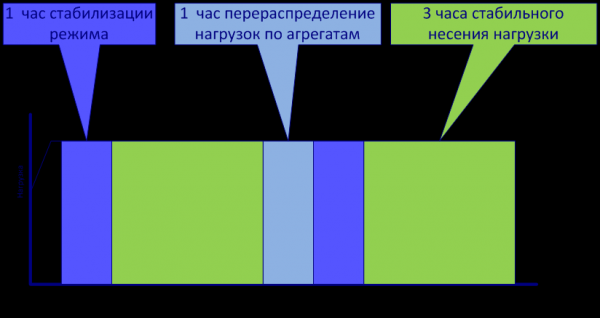
We compared indicators before and after in fact. At peak times, day and night, on weekends and weekdays. In each mode, we achieved fuel savings (in this task, the margin depends on fuel consumption). Then we fully transitioned to new modes. I should mention that the station quickly believed in the effectiveness of our recommendations, and closer to the end of the tests, we increasingly noticed that the equipment operated in the modes we had calculated earlier.
Project Outcome
Object: CHPP with cross-connections, 600 MW electrical capacity, 2,400 Gcal — thermal.
Team: KROK — seven people (technology experts, analysts, engineers), CHPP — five people (business experts, key users, specialists).
Implementation period: 16 months.
Results:
- We have automated business processes for managing modes and operations in the wholesale market.
- We conducted field tests that confirm the economic impact.
- We saved 1.2% of fuel by redistributing loads during the operation.
- We preserved 1% of fuel thanks to short-term equipment composition planning.
- We optimized the calculation of application stages for RSV based on maximizing marginal profit.
The overall effect is approximately 4%.
The estimated payback period for the project (ROI) is 1–1.5 years.
Of course, implementing and testing all of this required changing many processes and working closely with both the management of the CHP and the generating company as a whole. But the result was definitely worth it. We managed to create a digital twin of the station, develop optimization planning procedures, and achieve real economic benefits.
Source: habr.com
