

Hello everyone. Below is the transcript .
– a monitoring system for various systems and services, which allows system administrators to collect information about the current parameters of systems and set up alerts to receive notifications about deviations in system performance.
The report will compare and — projects for long-term storage of Prometheus metrics.
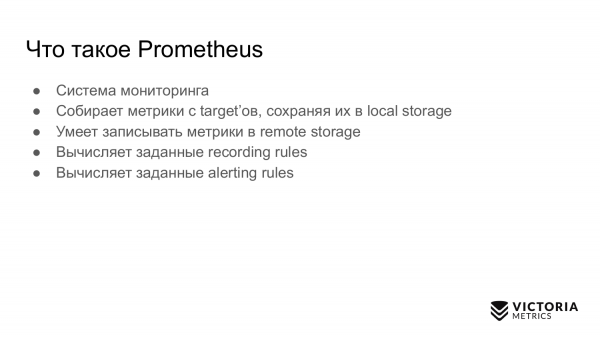
First, I'll talk about Prometheus. It is a monitoring system that collects metrics from specified targets and stores them in local storage. Prometheus can write metrics to remote storage, generate alerts, and create recording rules.
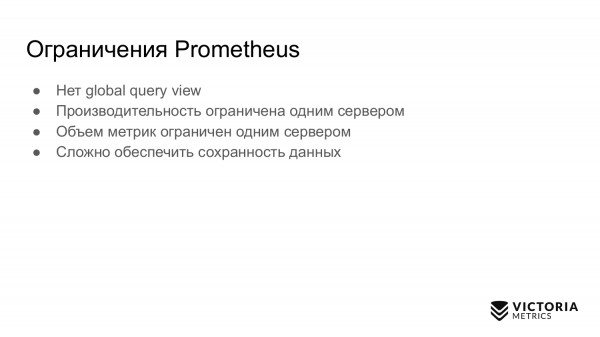
Limitations of Prometheus:
- It lacks a global query view. This is when you have multiple independent instances of Prometheus. They collect metrics, and you want to query across all these metrics collected from different Prometheus instances. Prometheus does not allow this.
- Prometheus's performance is limited to a single server. It cannot automatically scale to multiple servers. You can only manually split your targets among multiple Prometheuses.
- The volume of metrics in Prometheus is limited to a single server for the same reason it cannot automatically scale to multiple servers.
- In Prometheus, organizing data retention is not straightforward.
What are the solutions to these problems/tasks?
The solutions are:
All these solutions are for remote data storage collected by Prometheus. They address the remote storage issue from the previous slide in different ways. In this presentation, I will only cover the first two solutions: and .
The first information about appeared in . It describes the architecture and how it works.
Thanos takes data that Prometheus has saved on the local disk and copies it to S3, to or another object storage.
Thus, Thanos provides a global query view. You can query data stored in object storage from multiple Prometheus instances.
Thanos supports PromQL and .
Thanos uses Prometheus code for data storage.
Thanos is developed by the same developers as Prometheus.
About . Here’s , where we first talked about .
VictoriaMetrics retrieves data from multiple Prometheuses via protocol supported by Prometheus.
VictoriaMetrics provides a global query view, allowing multiple Prometheus instances to write data to a single VictoriaMetrics. Consequently, you can query all this data.

VictoriaMetrics also supports PromQL and the Prometheus querying API, just like Thanos.
Unlike Thanos, the source code of VictoriaMetrics has been written from the ground up and is optimized for speed and resource consumption.
Unlike Thanos, VictoriaMetrics scales both vertically and horizontally. There is , which scales vertically. You can start with one processor and 1 GB of memory and gradually scale up to hundreds of processors and 1 TB of memory. VictoriaMetrics can utilize all these resources. Its performance can increase approximately 100 times compared to a single-core system.

The history of Thanos began in November 2017 with the first public commit. Before that, Thanos was developed internally within the company .

In June 2019, a landmark release 0.5.0 was made, in which protocol was removed. It was removed from Thanos because it did not perform well. Often, the Thanos cluster operated incorrectly, and nodes connected to it improperly due to the gossip protocol. Therefore, it was decided to remove it. I believe this was the right decision.

In the same June 2019, they submitted application number downward API support (simultaneously with this in .
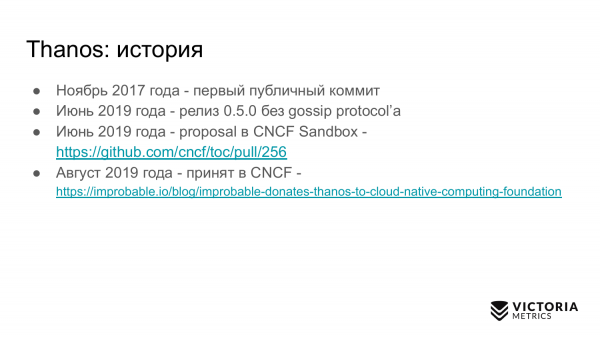
And after a couple of months, Thanos was accepted into , which includes Prometheus, Kubernetes, and other popular projects.
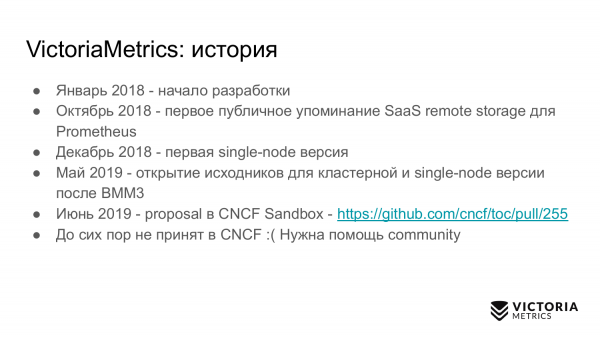
In January 2018, the development of VictoriaMetrics began.
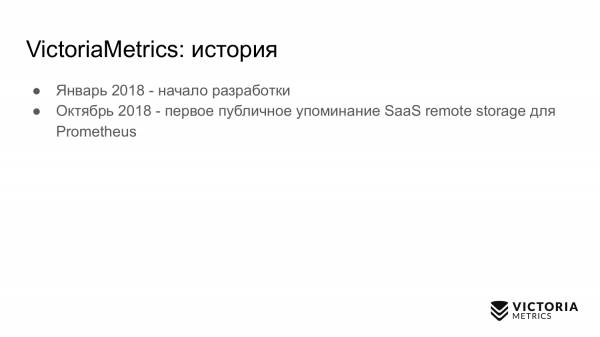
In September 2018, I first publicly mentioned VictoriaMetrics.
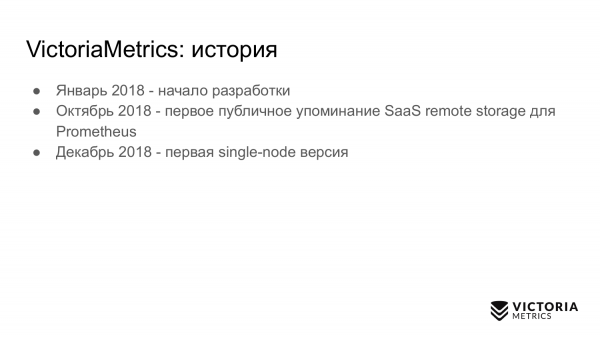
In December 2018, the single-node version was released.
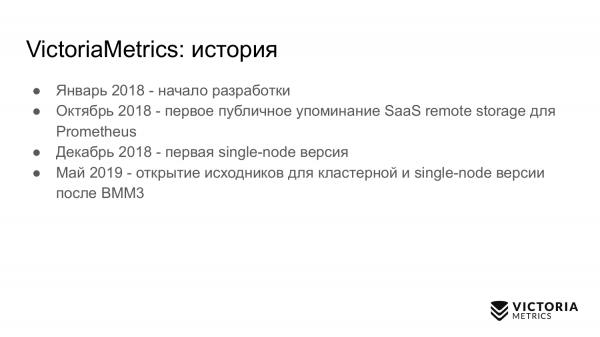
In May 2019, In June 2019, just like Thanos, we submitted an application to the CNCF foundation under the number
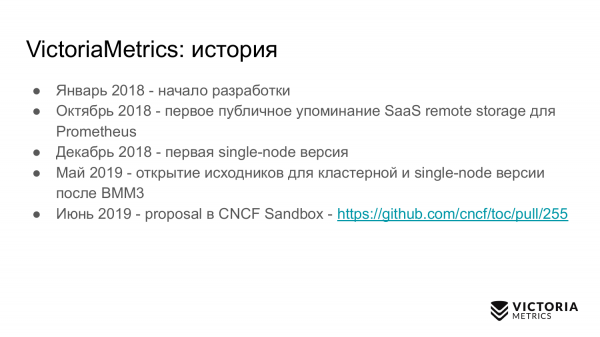
. We submitted our application one day earlier than Thanos. Unfortunately, we have not yet been accepted there. We need community support.
Let's look at the most important slides that demonstrate the architecture of Thanos and VictoriaMetrics.
We will start with Thanos. The yellow components are the components of Prometheus. Everything else consists of Thanos components. Let's begin with the most important component. Thanos Sidecar is a component that is installed next to each Prometheus. It handles loading Prometheus data from local storage to S3 or another Object Storage.
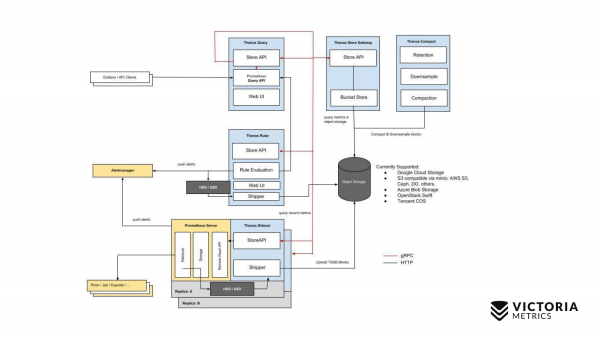
Let's start with Thanos. The yellow components are Prometheus components. Everything else consists of Thanos components. We begin with the most important component. The Thanos Sidecar is a component that is installed alongside each Prometheus. It is responsible for uploading Prometheus data from local storage to S3 or another Object Storage.
There is also a component called Thanos Store Gateway, which can read data from Object Storage upon incoming requests from Thanos Query. Thanos Query implements PromQL and the Prometheus API. Therefore, it appears externally as Prometheus. It accepts PromQL queries, sends them to Thanos Store Gateway, which retrieves the necessary data from Object Storage and sends it back.
However, we have data in Object Storage that doesn't include the last two hours due to the specifics of Thanos Sidecar's implementation, which cannot upload the last two hours to Object Storage S3 because Prometheus has not yet created files in local storage for this period.
How was this issue resolved? Thanos Query, in addition to sending requests to Thanos Store Gateway, concurrently sends requests to each Thanos Sidecar located near Prometheus.
Thanos Sidecar, in turn, proxies the requests further to Prometheus and retrieves the data for the last two hours.
Besides these components, there is also an optional component without which Thanos would not perform well. This is Thanos Compact, which merges small files in Object Storage into larger files that have been uploaded there by Thanos Sidecars. Thanos Sidecar uploads files with data for two hours. If these files are not merged into larger ones, their quantity can grow significantly. The more files there are, the more memory is required for Thanos Store Gateway, and the more resources are needed for data transfer over the network and metadata. The operation of Thanos Store Gateway becomes inefficient. Therefore, it is essential to run Thanos Compact to merge small files into larger ones to reduce the number of such files and decrease the overhead on Thanos Store Gateway.
There is also a component called Thanos Ruler. It executes Prometheus alerting rules and can compute Prometheus recording rules to write data back to Object Storage. However, this component is not recommended for use, as it .
This is the simple scheme of Thanos.
Now let's compare it with the scheme of VictoriaMetrics.
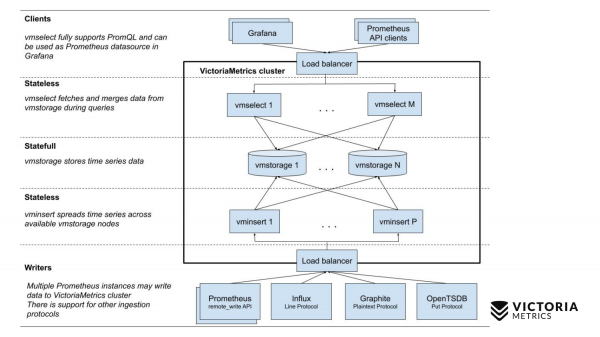
VictoriaMetrics has two versions: Single-node and clustered. The Single-node runs on a single computer. It does not have these components; just one binary. This binary appears in the slide as this square. Everything inside the square is the content of the binary file for the Single-node version. You do not need to know about it. Just run the binary—and everything works.
The cluster version is more complex. It contains three different components: vmselect, vminsert, and vmstorage. Their names indicate what each of them does. The Insert component accepts data in various formats: from the Prometheus remote write API, Influx line protocol, Graphite protocol, and from the OpenTSDB protocol. The Insert component accepts them, parses, and distributes them among the available storage components, where the data is finally saved. , as well as the Prometheus querying API, and it can be used as a replacement for Prometheus in Grafana or other Prometheus API clients. The Select component accepts PromQL queries, parses them, reads the necessary data to execute this query from the storage nodes, processes this data, and returns an answer.
Let's compare the complexity of installing Thanos and VictoriaMetrics.
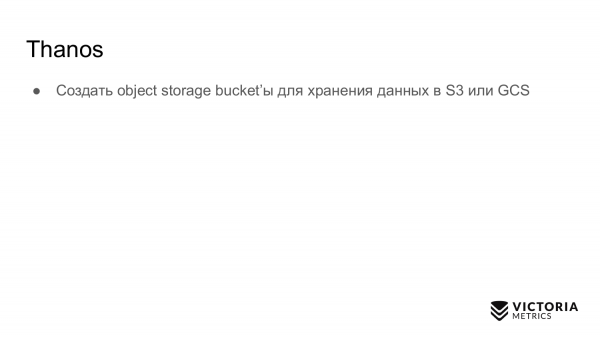
Starting with Thanos. Before you begin working with Thanos, you need to create a bucket in an Object Storage service like S3 or GCS so that the Thanos Sidecar can write data there.
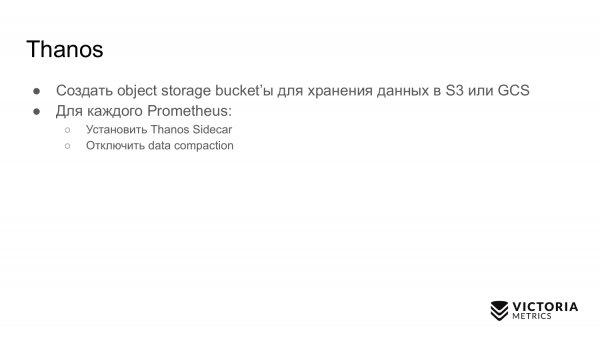
Then, for each Prometheus, you need to install the Thanos Sidecar. Before that, do not forget to disable data compaction in Prometheus. Data compaction periodically compresses the data in Prometheus's local storage to reduce resource consumption.
When you install the Thanos Sidecar for your Prometheus instances, you must disable this data compaction because the Thanos Sidecar does not work properly when data compaction is enabled. This means that your Prometheus will start saving data in two-hour blocks and will stop merging these blocks into larger ones. Accordingly, if you make requests that exceed the duration of the last two hours, they will not work as efficiently compared to how they could work if data compaction was enabled.
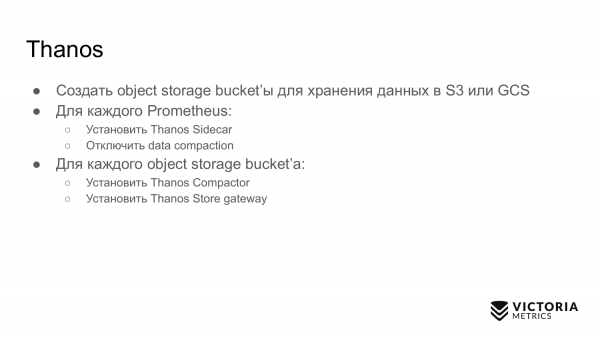
Therefore, Thanos recommends reducing the data retention time in local storage to 6-8 hours to minimize the overhead of a large number of small blocks.
After you have installed the Thanos Sidecar, you need to install two components for each Object Storage Bucket. These are the Thanos Compactor and Thanos Store Gateway.
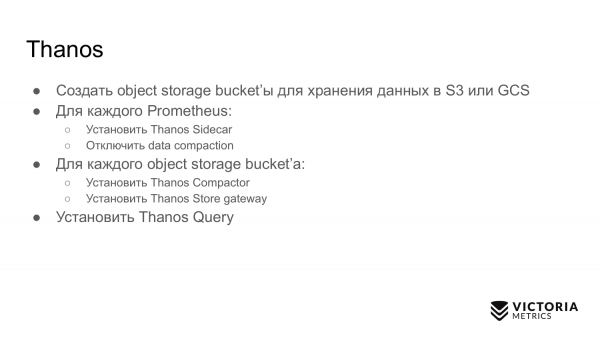
After that, you need to install Thanos Query and configure it to connect to all the Thanos Store Gateways that you have, as well as to connect to all the Thanos Sidecars.
There may be a small issue here.
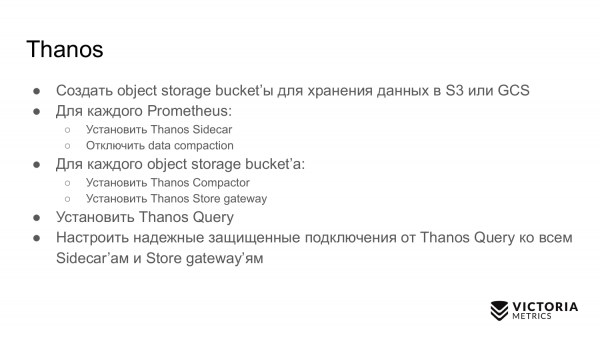
You need to establish a reliable and secure connection from Thanos Query to these components. If your Prometheus instances are located in different data centers or in different VPCs, external connections to them are prohibited. However, to make Thanos Query work, you need to set up some form of connection to them, and you must come up with a solution.
If you have many such data centers, the reliability of the entire system decreases accordingly. Thanos Query must constantly maintain connections to all Thanos Sidecars located in different data centers. For each incoming request, it will direct requests to all Thanos Sidecars. If the connection is interrupted, you will either receive incomplete data or a response indicating that the cluster is not operational.
With VictoriaMetrics, things are a bit simpler. For the Single-node version, you only need to run a single binary, and everything works.
For the clustered version, you simply need to run all three types of components mentioned above in any quantity you require, or use to automate the deployment of components in Kubernetes. We also plan to create a Kubernetes operator. The Helm chart does not cover certain cases and can cause issues. For example, it allows you to reduce the number of storage nodes, which will lead to data loss.
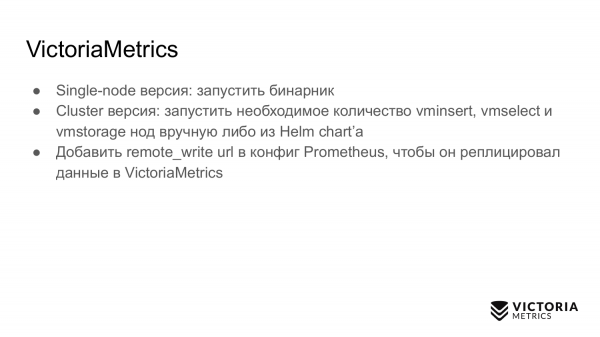
After you have started a single binary or the clustered version, you just need to add to the Prometheus configuration , so it starts writing data simultaneously to local storage and remote storage. As you may have noticed, this configuration should operate much more reliably compared to the Thanos configuration. We do not need to maintain a connection from VictoriaMetrics to all Prometheus instances because the Prometheus instances themselves connect to VictoriaMetrics and send the data.
Let's consider the maintenance of Thanos and VictoriaMetrics.
Thanos needs to monitor the Sidecar to ensure they continue uploading data to Object Storage. They may stop uploading data due to upload errors, such as a temporary network interruption with Object Storage or if Object Storage becomes temporarily unavailable. At this moment, Thanos Sidecar will notice this, report an error, may crash, and subsequently stop functioning. If you do not monitor it, data will no longer be transmitted to Object Storage. If the retention period (recommended 6-8 hours) passes, you will lose data that hasn't reached Object Storage.
Thanos compactor may stop functioning due to . Compactors take data from Object Storage and merge it into larger chunks. Since compactors are not synchronized with Sidecars, the following can happen: the Sidecar hasn't finished writing a block, and the Compactor decides that this block is fully recorded. The Compactor starts reading it, but it reads the block incompletely and stops working. See details .
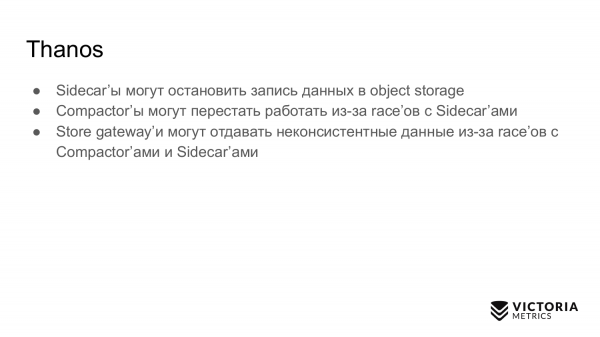
Store Gateway can return inconsistent data due to races between the Compactor and the Sidecars. This is similar, as Store Gateway is not synchronized with the Compactors and Sidecars. Consequently, race conditions may arise where Store Gateway does not see part of the data or sees extra data.
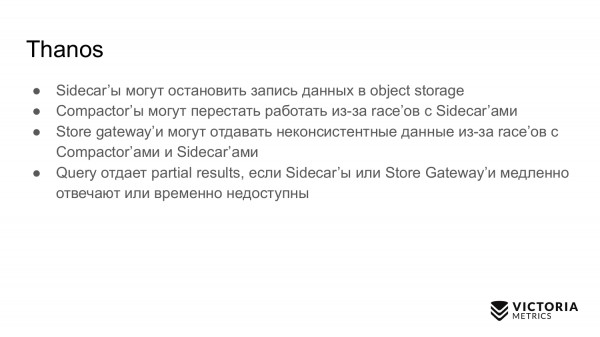
The Query component in Thanos by default returns a partial result if some Sidecars or Store Gateway are unavailable at the moment. You will receive some data and won’t even know that you haven't received all the data. This is how it works by default. In a similar situation, VictoriaMetrics returns marked data as partial.
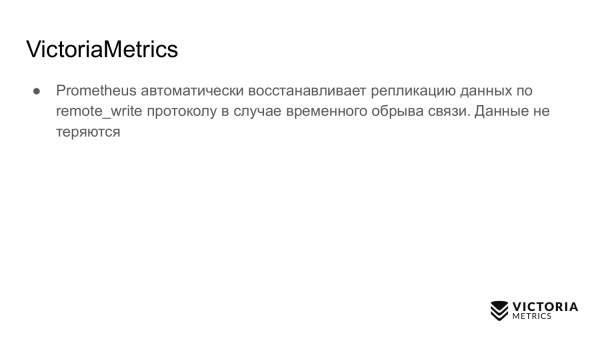
Unlike Thanos, VictoriaMetrics rarely loses data. Even if the connection from Prometheus to VictoriaMetrics is interrupted, it's not a problem since Prometheus continues to write incoming new data to the Write Ahead Log, which spans 2 hours. If you restore the connection to VictoriaMetrics within two hours, the data will not be lost. Prometheus .
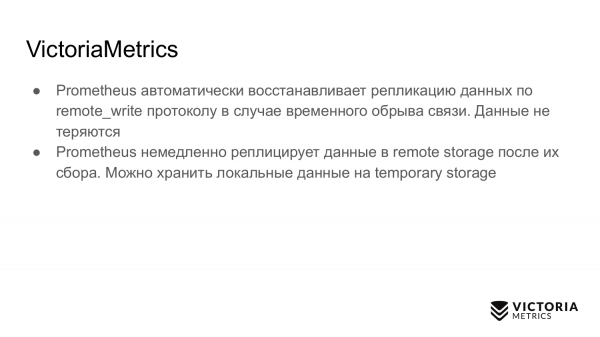
Unlike Thanos, which writes data to object storage only after two hours, Prometheus automatically replicates data via the remote write protocol to remote storage, such as VictoriaMetrics. You need not worry about losing local storage in Prometheus. If it unexpectedly loses local storage, in the worst case, you will lose only the last few seconds of data that haven't been written to remote storage.
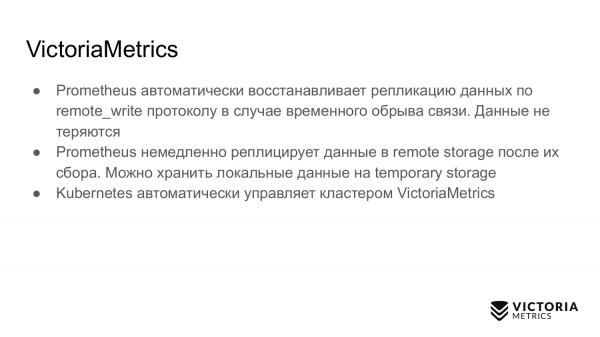
Kubernetes automatically manages the cluster, unlike Thanos. All Thanos components are difficult to fit into a single Kubernetes cluster, unlike the clustered components of VictoriaMetrics.
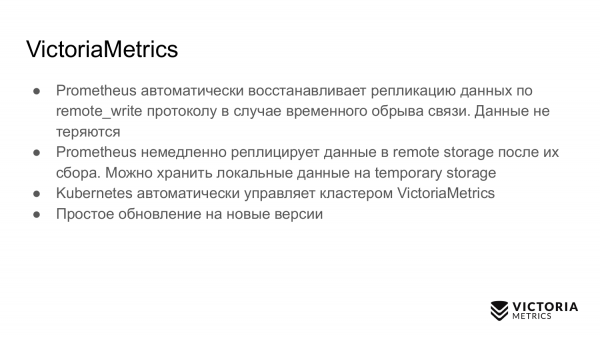
Updating VictoriaMetrics to a new version is very straightforward. You just stop VictoriaMetrics, update the binaries, and restart it. When stopped via the SIGINT signal, all VictoriaMetrics binaries perform a graceful shutdown. They properly save the necessary data and correctly close incoming connections to avoid any loss. Therefore, you will not lose anything during the update.
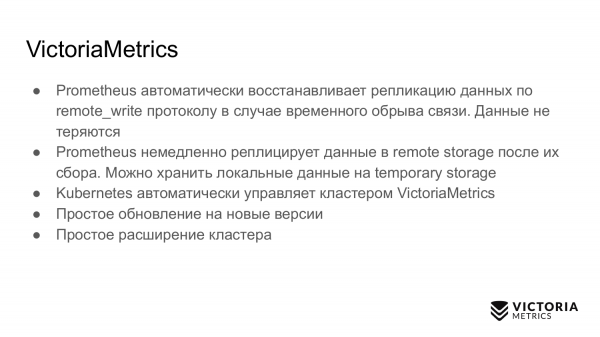
Expanding a cluster with VictoriaMetrics is very simple. You just add the necessary components and continue working.
On the pitfalls of Thanos and VictoriaMetrics.
Thanos has the following pitfalls. Prometheus must store data for the last two hours. If they are lost, you will lose them completely, as they have not yet been written to Object Storage, such as S3.
The Store Gateway component and the compactor component may require a lot of memory to work with large Object Storage if it stores many small files. The more files there are and the larger their size, the more RAM is needed by the Store Gateway and the compactor to store metadata. Thanos has many issues regarding this. .
Thanos advertises that it can scale infinitely with the number of your Prometheus instances. In reality, this is not true. Since all queries go through the Query component, which must poll all Store Gateway components and all Sidecar components in parallel to extract data and then preprocess it. Obviously, the speed of queries is limited by the slowest weak link, whether it be the slowest Store Gateway or the slowest Sidecar.
These components can be unevenly loaded. For example, you have Prometheus collecting millions of metrics per second. And then there's a Prometheus that collects thousands of metrics per second. The Prometheus collecting millions of metrics per second puts a significantly higher load on the server it runs on. Consequently, the Sidecar operates slower there. Everything runs slowly in that environment, and the Query component will retrieve data from there very slowly. As a result, the performance of your entire cluster will be limited by this slow Sidecar.
By default, Thanos delivers partial data if some Sidecars or the Store Gateway are unavailable. For instance, if your Sidecars are distributed around the world across different data centers, the likelihood of connection failures and component unavailability greatly increases. Therefore, in most cases, you will receive partial data without even realizing it.
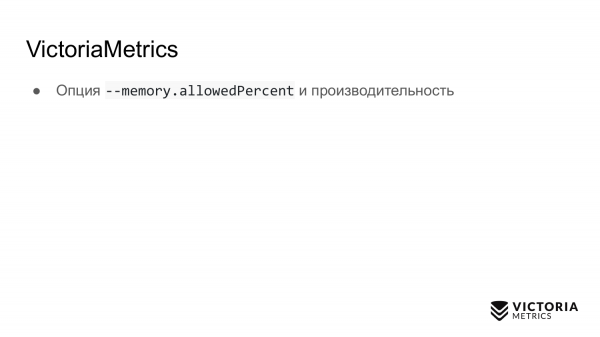
VictoriaMetrics also has its pitfalls. The first pitfall is an option that limits the amount of memory used for the VictoriaMetrics cache. By default, it is set to 60% of the RAM on the machine where VictoriaMetrics is running, or 60% of the pod's RAM in Kubernetes.
If this value is incorrectly configured, it can severely impact the performance of VictoriaMetrics. For example, setting it too low may cause data to no longer fit into the VictoriaMetrics cache. This forces it to perform unnecessary work, placing additional load on the CPU and the disk. Conversely, setting this option too high increases, firstly, the chance that VictoriaMetrics will crash with an out-of-memory error, and secondly, it leaves very little RAM available for the file cache in the operating system. VictoriaMetrics relies on the file cache for performance. If it's insufficient, disk load can increase significantly. Therefore, the advice is: do not change this parameter without extreme necessity.
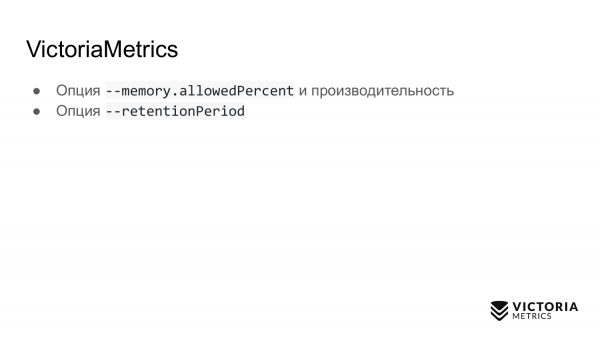
The second option is retentionPeriod — a duration which is set to 1 month by default. This is the time period during which VictoriaMetrics retains data. After this period, VictoriaMetrics deletes the data.
Many launch VictoriaMetrics without this parameter, recording data for a month. Later, they ask: why did the data disappear for the previous month? Because the retentionPeriod defaults to 1 month. Therefore, it is essential to know and set the correct retentionPeriod.
Let’s go over the unique features.
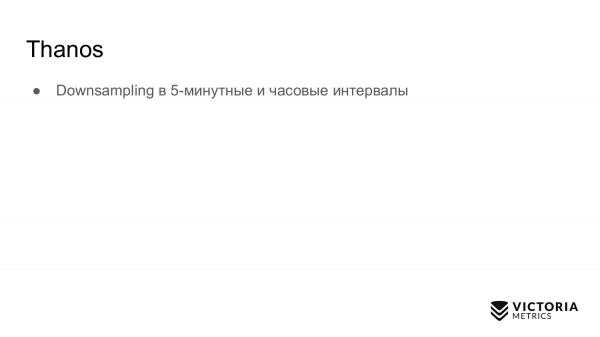
Thanos has a feature called downsampling: 5-minute and hourly intervals that often . If you search on GitHub, you'll find many issues related to this downsampling, as it sometimes doesn't function as expected by users.
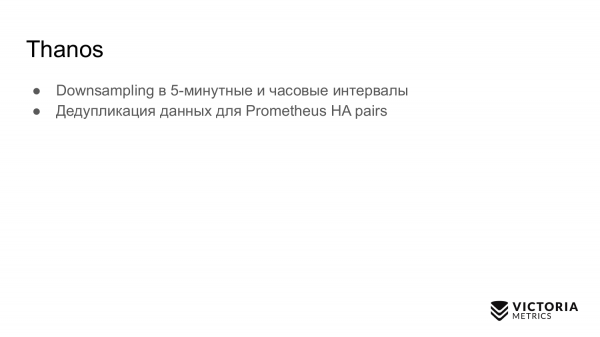
Thanos provides data deduplication for Prometheus HA pairs. When two Prometheus instances collect the same metrics from the same targets, Thanos aggregates them into Object Storage. Thanos correctly deduplicates this data, unlike VictoriaMetrics.
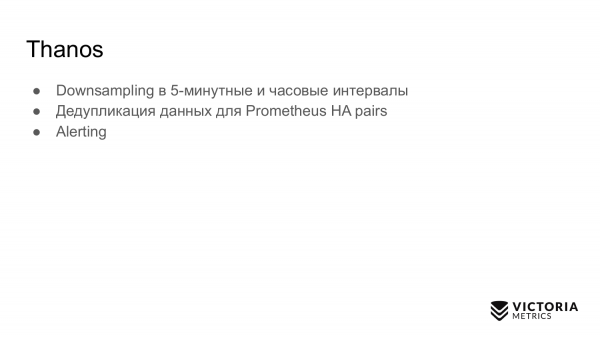
Thanos includes an alert component, which was shown in the Thanos diagram. However, it is .
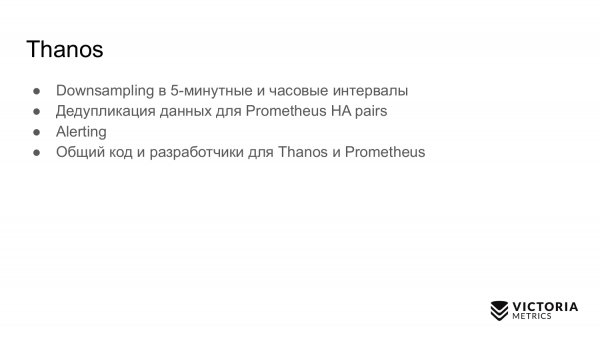
Thanos has the advantage that the code for Thanos and Prometheus is shared. Thanos and Prometheus are developed by the same team. When improvements are made in either Thanos or Prometheus, both benefit.
The main feature of VictoriaMetrics is MetricsQL. This is the extension of VictoriaMetrics for PromQL, which I discussed at the last big monitoring meetup.
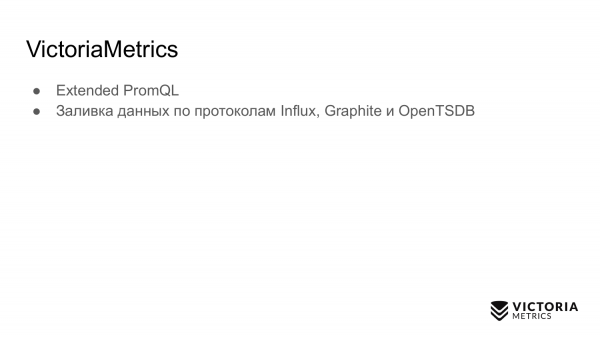
VictoriaMetrics supports data ingestion via multiple protocols. VictoriaMetrics can not only accept data from Prometheus but also via Influx, OpenTSDB, and Graphite protocols.
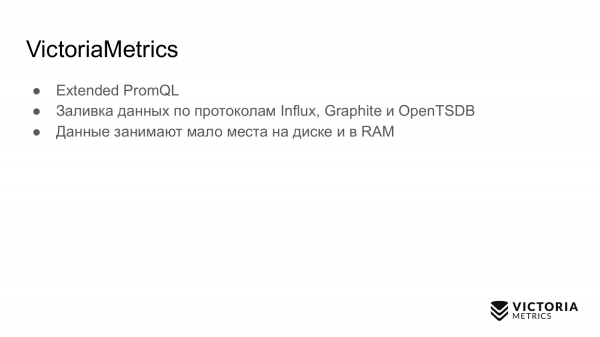
VictoriaMetrics data typically takes much less space compared to Thanos and Prometheus.
When recording actual data, users report a 2-5 times reduction in disk space compared to Prometheus and Thanos.
Another advantage of VictoriaMetrics is that it is optimized for speed.
Let’s discuss infrastructure costs.
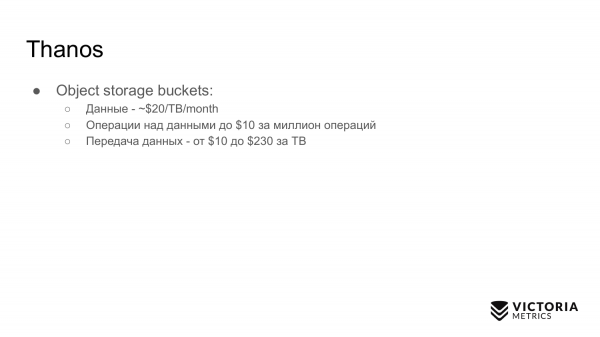
One advantage of Thanos is that it stores data in object storage, which is relatively inexpensive.
When you save data in object storage, you have to pay for read and write operations ($10 per million operations). When you write data to object storage, you incur costs for your hosting services to upload data to the Internet, unless your cluster is on AWS — in which case it is free. When you read data, you pay between $10 to $230 per 1TB. This can add up significantly if you frequently request historical data from the Thanos cluster.
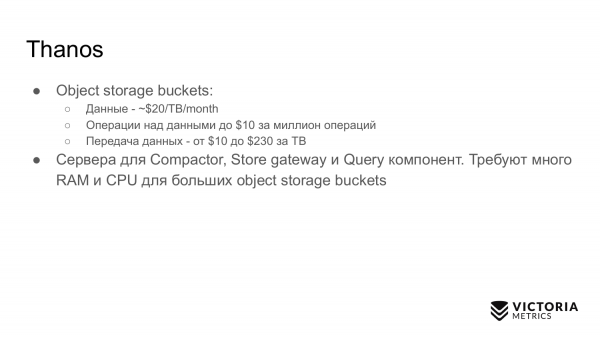
For a Thanos cluster, servers must be paid for the Compact, Store Gateway, and Query components, which require a lot of memory and CPU for large data volumes.
The expenses for VictoriaMetrics are as follows. If storing data on GCE HDD disks, it totals $40 per 1TB. VictoriaMetrics only requires standard HDD disks, without any need for SSDs, which are five times more expensive. VictoriaMetrics is optimized for HDD.
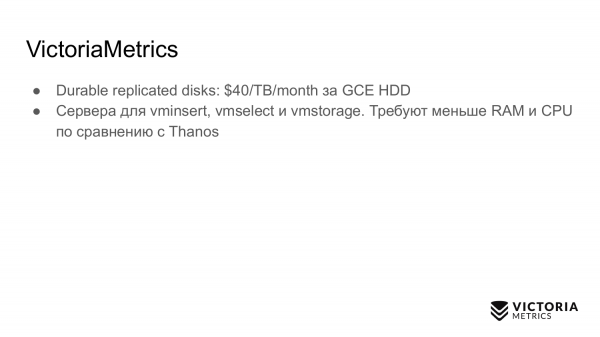
VictoriaMetrics requires servers for components: either Single-node or for cluster components, which, unlike Thanos components, require significantly less CPU and RAM — thus being more affordable.
Implementation examples.
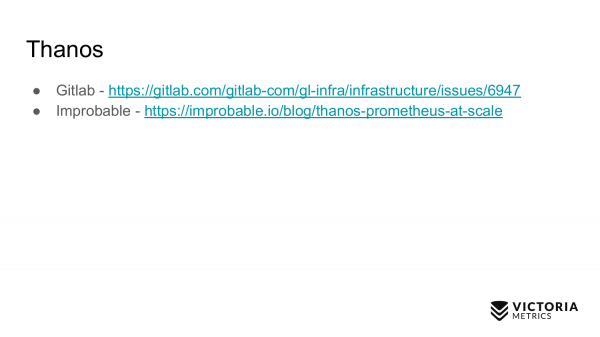
An implementation example for Thanos is Gitlab. Gitlab operates entirely on Thanos. However, not everything is smooth. If you look at their , you can see that they constantly encounter some : they lack memory for Store Gateway or Query components. They continually have to increase memory capacity.
This leads to increased costs for resolving these issues.
The second implementation, which may be more successful, is the company Improbable, which started the development of Thanos. They published the Thanos source code. Improbable is a company that develops game engines.
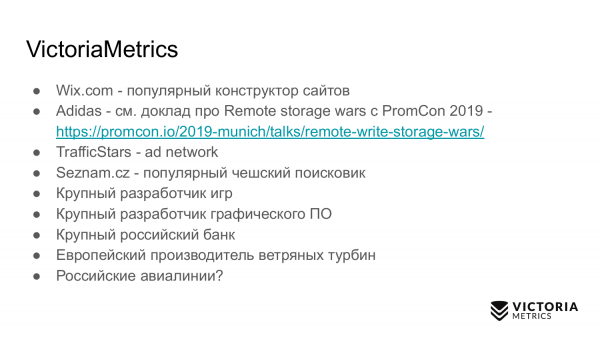
Public examples of VictoriaMetrics implementations include:
- wix.com website builder
- Adidas implements VictoriaMetrics and even presented a report at the last PromCon 2019
- TrafficStars — ad network
- Seznam.cz — a popular Czech search engine.
Then there are some unknown companies that I cannot name right now. They did not give consent.
- One large game developer. Bigger than Improbable.
- A large graphics software developer.
- A major Russian bank.
- A European wind turbine manufacturer that successfully tested VictoriaMetrics. This manufacturer implements VictoriaMetrics for monitoring data obtained from wind turbines at a rate of 50 samples per second for each sensor. Each wind turbine has several hundred sensors. They have several hundred wind turbines.
- Russian airlines that want to implement VictoriaMetrics but are yet to do so. We are in the contract stage with them.
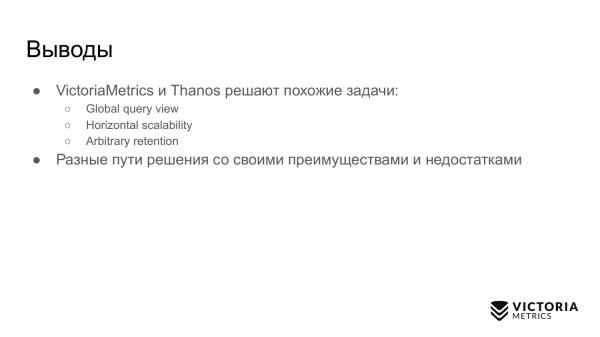
 Conclusions.
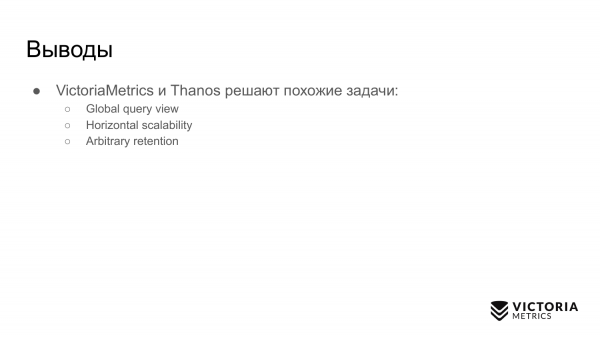
VictoriaMetrics and Thanos address similar tasks but in different ways:
- Global query view
- horizontal scaling
- arbitrary retention
Thank you.
We look forward to seeing you on our .

Only registered users can participate in the survey. , please.
What do you use as long-term storage for Prometheus?
35,3%Thanos
0,0%Cortex
0,0%M3DB
41,2%VictoriaMetrics
23,5%other
17 users voted. 16 users abstained.
Source: habr.com
