

This article will discuss the project , which will read nginx logs and send them to a Clickhouse cluster. Usually, ElasticSearch is used for logs. Clickhouse requires fewer resources (disk space, RAM, CPU). Clickhouse writes data faster. Clickhouse compresses data, making the data on disk even more compact. The advantages of Clickhouse are evident from the 2 slides from the report


To view analytics on the logs, we will create a dashboard for Grafana.
If you are interested, welcome under the cut.
We install nginx and grafana in the standard way.
We install a Clickhouse cluster using the ansible-playbook from .
Creating a database and tables in Clickhouse
In this SQL queries for creating a database and tables for nginx-log-collector in Clickhouse are described.
Each query is executed sequentially on each server of the Clickhouse cluster.
Important note. In this line, logs_cluster should be replaced with your cluster name from the clickhouse_remote_servers.xml file between "remote_servers" and "shard".
ENGINE = Distributed('logs_cluster', 'nginx', 'access_log_shard', rand())Installation and configuration of nginx-log-collector-rpm
Nginx-log-collector does not have an rpm. Here we create an rpm for it. The rpm will be built using
We install the rpm package nginx-log-collector-rpm
yum -y install yum-plugin-copr
yum copr enable antonpatsev/nginx-log-collector-rpm
yum -y install nginx-log-collector
systemctl start nginx-log-collector
We edit the config /etc/nginx-log-collector/config.yaml:
  .......
  upload:
    table: nginx.access_log
    dsn: http://cluster-clickhouse-ip-address:8123/

- tag: "nginx_error:"
  format: error  # access | error
  buffer_size: 1048576
  upload:
    table: nginx.error_log
    dsn: http://cluster-clickhouse-ip-address:8123/
Nginx Configuration
General nginx config:
user  nginx;
worker_processes  auto;

#error_log  /var/log/nginx/error.log warn;
pid        /var/run/nginx.pid;

events {
    worker_connections  1024;
}

http {
    include       /etc/nginx/mime.types;
    default_type  application/octet-stream;

    log_format  main  '$remote_addr - $remote_user [$time_local] "$request" '
                      '$status $body_bytes_sent "$http_referer" '
                      '"$http_user_agent" "$http_x_forwarded_for"';

    log_format avito_json escape=json
                     '{'
                     '"event_datetime": "$time_iso8601", '
                     '"server_name": "$server_name", '
                     '"remote_addr": "$remote_addr", '
                     '"remote_user": "$remote_user", '
                     '"http_x_real_ip": "$http_x_real_ip", '
                     '"status": "$status", '
                     '"scheme": "$scheme", '
                     '"request_method": "$request_method", '
                     '"request_uri": "$request_uri", '
                     '"server_protocol": "$server_protocol", '
                     '"body_bytes_sent": $body_bytes_sent, '
                     '"http_referer": "$http_referer", '
                     '"http_user_agent": "$http_user_agent", '
                     '"request_bytes": "$request_length", '
                     '"request_time": "$request_time", '
                     '"upstream_addr": "$upstream_addr", '
                     '"upstream_response_time": "$upstream_response_time", '
                     '"hostname": "$hostname", '
                     '"host": "$host"'
                     '}';

    access_log     syslog_server=unix:/var/run/nginx_log.sock,nohostname,tag=nginx avito_json; #ClickHouse
    error_log      syslog_server=unix:/var/run/nginx_log.sock,nohostname,tag=nginx_error; #ClickHouse

    #access_log  /var/log/nginx/access.log  main;

    proxy_ignore_client_abort on;
    sendfile        on;
    keepalive_timeout  65;
    include /etc/nginx/conf.d/*.conf;
}
One virtual host:
vhost1.conf:
upstream backend {
    server server-ip-address-with-stub_http_server:8080;
    server server-ip-address-with-stub_http_server:8080;
    server server-ip-address-with-stub_http_server:8080;
    server server-ip-address-with-stub_http_server:8080;
    server server-ip-address-with-stub_http_server:8080;
}

server {
    listen   80;
    server_name vhost1;
    location / {
        proxy_pass http://backend;
    }
}
Add virtual hosts to the file /etc/hosts:
server-ip-address-with-nginx vhost1HTTP server emulator
We will use from
Nodejs-stub-server does not have an rpm. Here we create an rpm for it. The rpm will be built using
Install the upstream nginx rpm package nodejs-stub-server
yum -y install yum-plugin-copr
yum copr enable antonpatsev/nodejs-stub-server
yum -y install stub_http_server
systemctl start stub_http_server
Load Testing
We conduct testing using Apache benchmark.
Install it:
yum install -y httpd-toolsBegin testing using Apache benchmark with 5 different servers:
while true; do ab -H "User-Agent: 1server" -c 10 -n 10 -t 10 http://vhost1/; sleep 1; done
while true; do ab -H "User-Agent: 2server" -c 10 -n 10 -t 10 http://vhost1/; sleep 1; done
while true; do ab -H "User-Agent: 3server" -c 10 -n 10 -t 10 http://vhost1/; sleep 1; done
while true; do ab -H "User-Agent: 4server" -c 10 -n 10 -t 10 http://vhost1/; sleep 1; done
while true; do ab -H "User-Agent: 5server" -c 10 -n 10 -t 10 http://vhost1/; sleep 1; done
Setting up Grafana
You will not find a dashboard on the official Grafana website.
So we will create it manually.
You can find my saved dashboard .
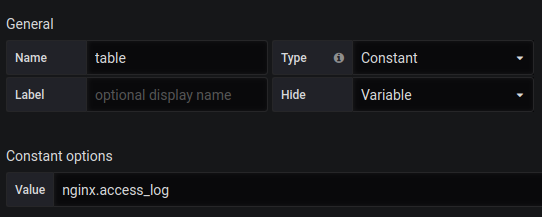
You also need to create a variable table with the content nginx.access_log.
Singlestat Total Requests:
SELECT
 1 as t,
 count(*) as c
 FROM $table
 WHERE $timeFilter GROUP BY t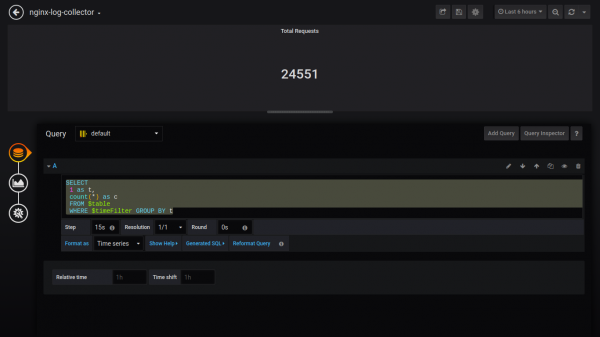
Singlestat Failed Requests:
SELECT
 1 as t,
 count(*) as c
 FROM $table
 WHERE $timeFilter AND status NOT IN (200, 201, 401) GROUP BY t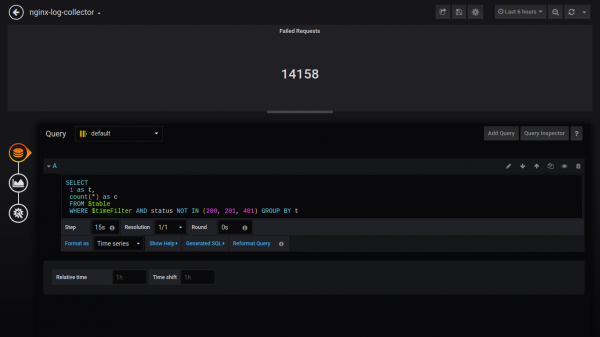
Singlestat Failing Percent:
SELECT
 1 as t, (sum(status = 500 or status = 499) / sum(status = 200 or status = 201 or status = 401)) * 100 FROM $table
 WHERE $timeFilter GROUP BY t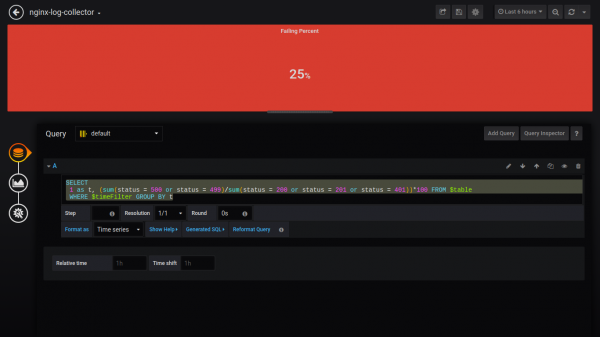
Singlestat Avg Response Time:
SELECT
 1, avg(request_time) FROM $table
 WHERE $timeFilter GROUP BY 1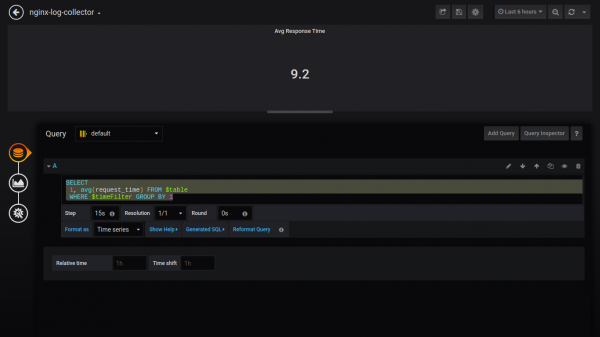
Singlestat Max Response Time:
SELECT
 1 as t, max(request_time) as c
 FROM $table
 WHERE $timeFilter GROUP BY t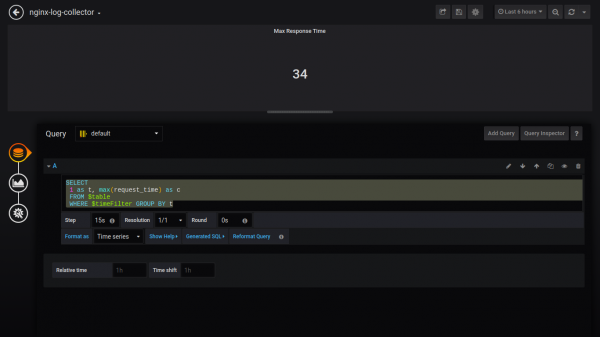
Count Status:
$columns(status, count(*) as c) from $table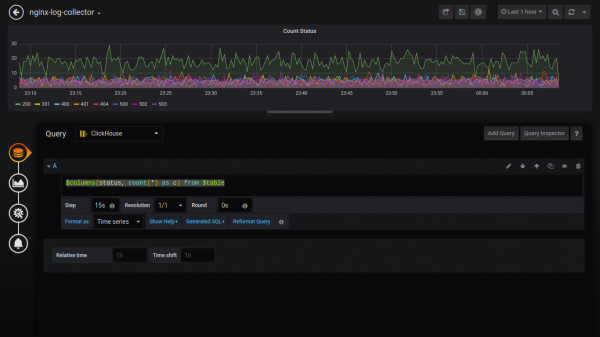
To display data as a pie chart, you need to install the plugin and restart Grafana.
grafana-cli plugins install grafana-piechart-panel
service grafana-server restart
Pie TOP 5 Status:
SELECT
    1,
    status,
    sum(status) AS Reqs
FROM $table
WHERE $timeFilter
GROUP BY status
ORDER BY Reqs desc
LIMIT 5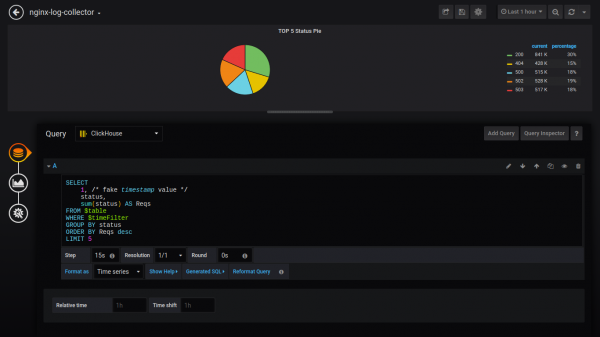
Next, I will present queries without screenshots:
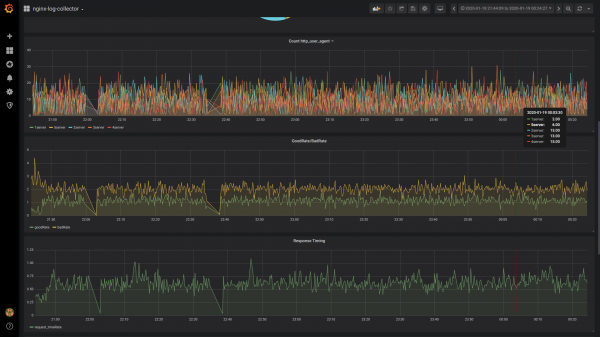
Count http_user_agent:
$columns(http_user_agent, count(*) c) FROM $tableGoodRate/BadRate:
$rate(countIf(status = 200) AS good, countIf(status != 200) AS bad) FROM $tableResponse Timing:
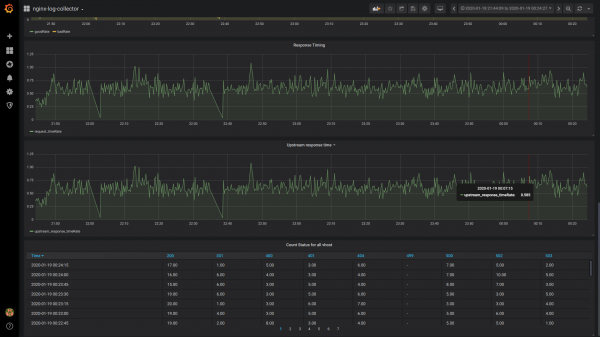
$rate(avg(request_time) as request_time) FROM $tableUpstream response time (response time of the first upstream):
$rate(avg(arrayElement(upstream_response_time,1)) as upstream_response_time) FROM $tableTable Count Status for all vhosts:
$columns(status, count(*) as c) from $tableOverall view of the dashboard

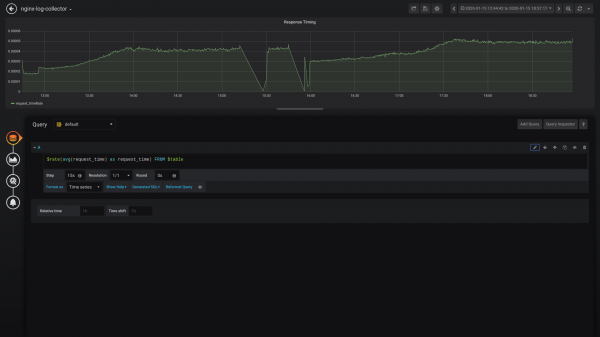
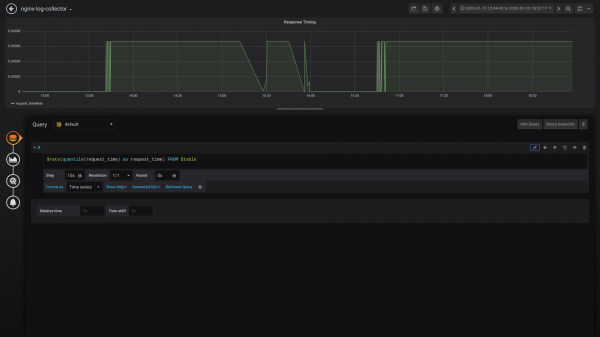
Comparison of avg() and quantile()
avg()
quantile()
Output:
I hope the community will engage in the development/testing and use of nginx-log-collector.
And someone who implements nginx-log-collector will tell how much disk, RAM, CPU has been saved.
Telegram channels:
Milliseconds:
If milliseconds are important to you, please write or vote in this .
Source: habr.com
