

Note: translation.: This article is part of the publicly available materials of the project , teaching work with Kubernetes for companies and individual administrators. In it, Daniele Polencic, the project leader, shares a clear guide on what steps to take in case of common issues with applications running in a K8s cluster.
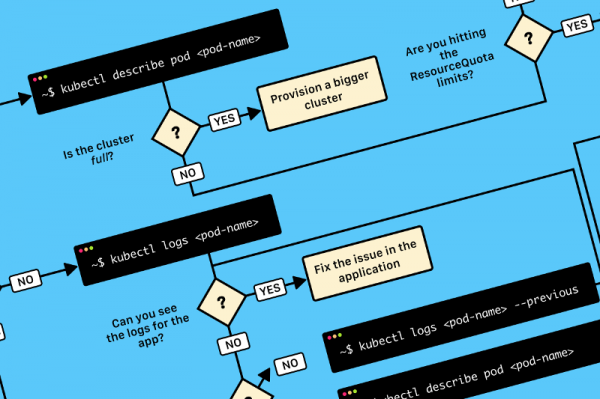
TL;DR: here’s a diagram that will help you debug deployment in Kubernetes:
A flowchart for troubleshooting errors in the cluster. The original (in English) can be found at and .
When deploying an application in Kubernetes, it's usually necessary to define three components:
- Deployment — a kind of recipe for creating copies of the application, called pods;
- Service — an internal load balancer that distributes traffic among the pods;
- Ingress — a description of how traffic will reach the Service from the external world.
Here’s a brief graphical summary:
1) In Kubernetes, applications receive traffic from the external world through two layers of load balancers: internal and external.
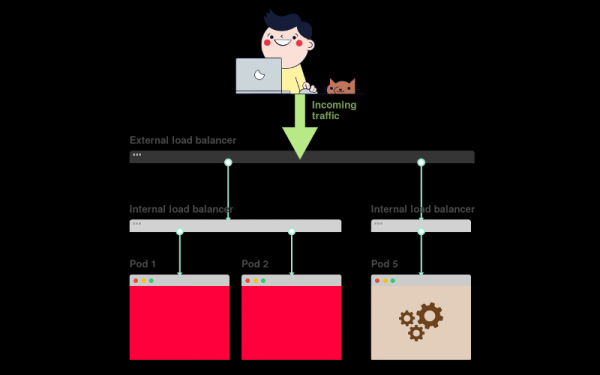
2) The internal load balancer is called Service, while the external one is Ingress.
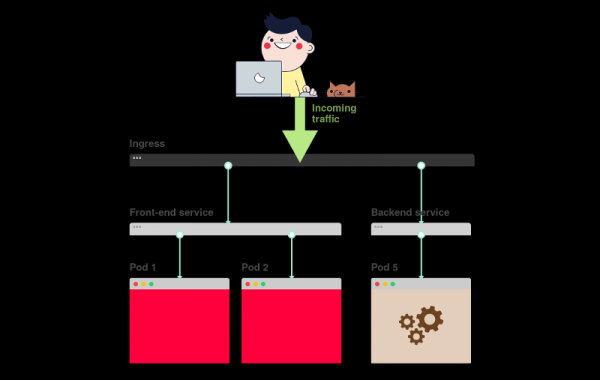
3) Deployment creates pods and monitors them (they are not created manually).
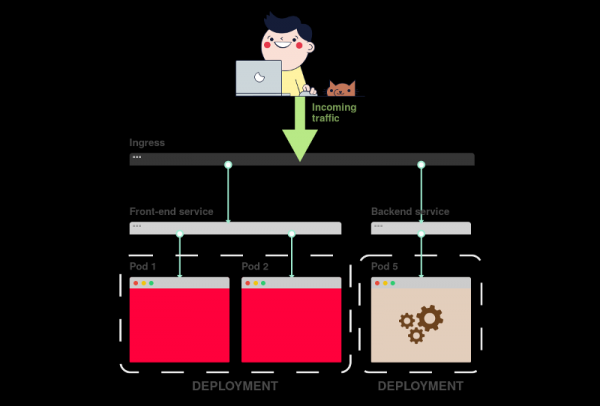
Let’s assume you want to deploy a simple application like Hello World. The YAML configuration for it will look as follows:
apiVersion: apps/v1
kind: Deployment # <<<<
metadata:
  name: my-deployment
  labels:
    track: canary
spec:
  selector:
    matchLabels:
      any-name: my-app
  template:
    metadata:
      labels:
        any-name: my-app
    spec:
      containers:
      - name: cont1
        image: learnk8s/app:1.0.0
        ports:
        - containerPort: 8080
---
apiVersion: v1
kind: Service # <<<<
metadata:
  name: my-service
spec:
  ports:
  - port: 80
    targetPort: 8080
  selector:
    name: app
---
apiVersion: networking.k8s.io/v1beta1
kind: Ingress # <<<<
metadata:
  name: my-ingress
spec:
  rules:
  - http:
    paths:
    - backend:
        serviceName: app
        servicePort: 80
      path: /
The definition is quite lengthy, and it's easy to get confused about how the components are related to one another.
For example:
- When should port 80 be used, and when should 8080 be used?
- Should a new port be created for each service to avoid conflicts?
- Do label names matter? Should they be the same everywhere?
Before focusing on debugging, let’s recall how the three components are related to each other. We will start with the Deployment and Service.
The relationship between Deployment and Service
You might be surprised, but Deployments and Services are not connected. Instead, the Service directly points to the Pods, bypassing the Deployment.
Thus, we are interested in how Pods and Services are interconnected. Three things should be remembered:
- The selector (
selector) of the Service must match at least one label of the Pod. -
targetPortmust matchcontainerPortof the container inside the Pod. -
portThe Service can take any name. Different services can use the same port as they have different IP addresses.
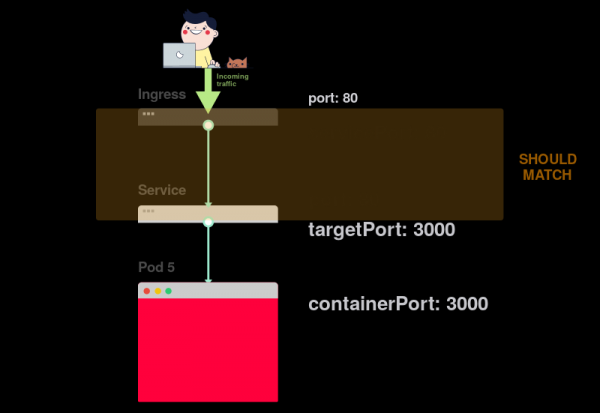
The next diagram represents all of the above in a graphical form:
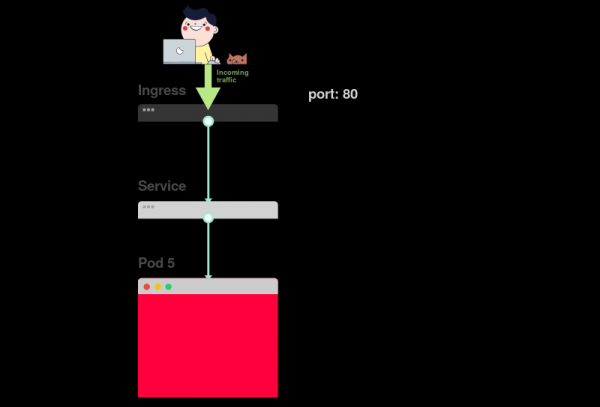
1) Let's imagine that the service directs traffic to a certain pod:
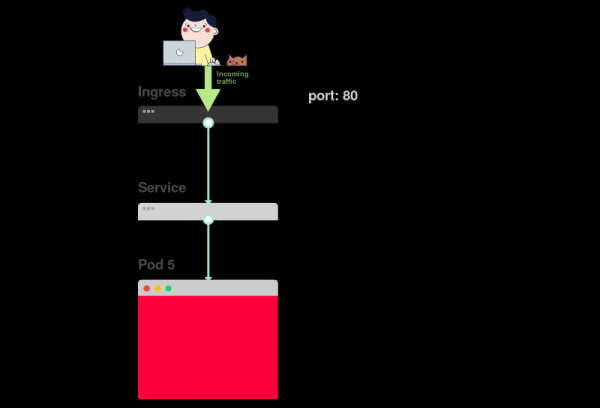
2) When creating a pod, you need to specify containerPort for each container in the pods:
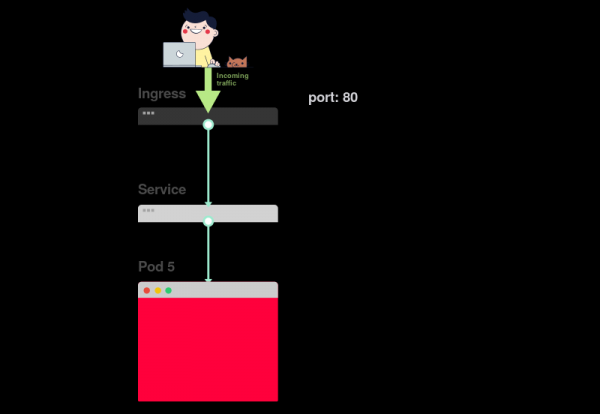
3) When creating a service, you need to indicate port and targetPort. But through which one is the connection to the container established?
4) Through targetPort. It must match containerPort.
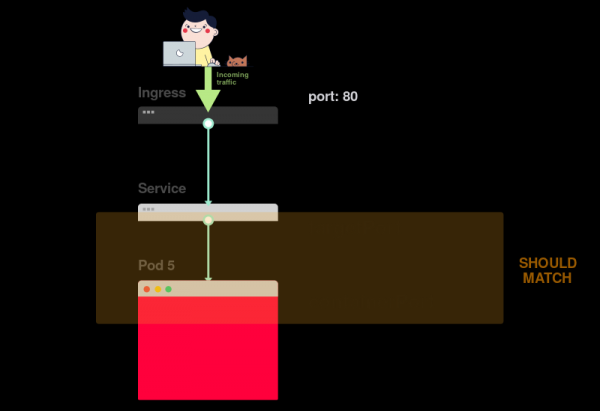
5) Suppose the container has port 3000 open. Then the value targetPort must be the same.
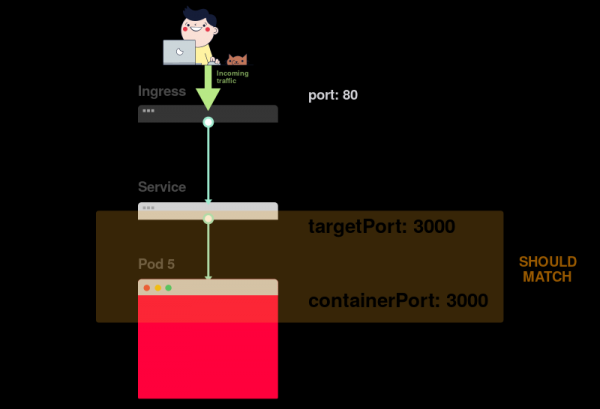
In the YAML file, labels and ports / targetPort must match:
apiVersion: apps/v1
kind: Deployment
metadata:
  name: my-deployment
  labels:
    track: canary
spec:
  selector:
    matchLabels:
      any-name: my-app
  template:
    metadata:
     labels:  # <<<
        any-name: my-app  # <<<
   spec:
      containers:
      - name: cont1
        image: learnk8s/app:1.0.0
        ports:
       - containerPort: 8080  # <<<
---
apiVersion: v1
kind: Service
metadata:
  name: my-service
spec:
  ports:
  - port: 80
   targetPort: 8080  # <<<
 selector:  # <<<
    any-name: my-app  # <<<
And what about the label track: canary at the top of the Deployment section? Should it match?
This label pertains to the deployment and is not used by the service to route traffic. In other words, it can be deleted or assigned a different value.
What about the selector matchLabels?
It must always match the labels of the Pod, as it is used by the Deployment to track the pods.
Suppose you made the correct edits. How can you verify them?
You can check the pod labels with the following command:
kubectl get pods --show-labelsOr, if the pods belong to multiple applications:
kubectl get pods --selector any-name=my-app --show-labels Where any-name=my-app — this is a label any-name: my-app.
Do you still have difficulties?
You can connect to the pod! To do this, use the command port-forward in kubectl. It allows connecting to the service and checking the connection.
kubectl port-forward service/ 3000:80Here:
-
service/— service name; in our case, it ismy-service; - 3000 — the port you need to open on the computer;
- 80 — the port listed in the field
portof the service.
If the connection is successful, it means the settings are correct.
If the connection could not be established, then there is a problem with the labels or the ports do not match.
Connection between Service and Ingress
The next step in ensuring access to the application involves configuring the Ingress. The Ingress must know how to locate the service, find the pods, and direct traffic to them. The Ingress locates the required service by its name and open port.
Two parameters must match in the descriptions of Ingress and Service:
-
servicePortin the Ingress must match the parameterportin the Service; -
serviceNamein the Ingress must match the fieldnamein the Service.
The following diagram summarizes the connection of the ports:
1) As you already know, the Service listens on a certain port:
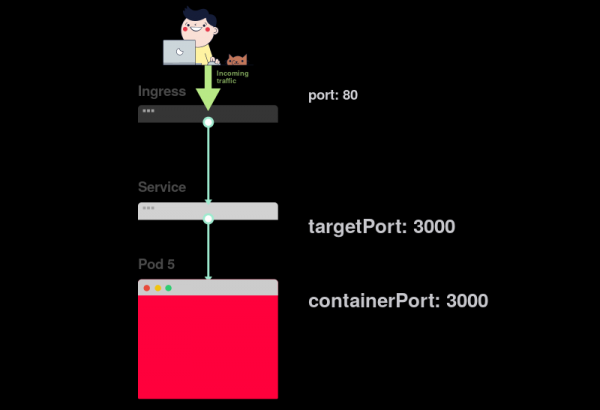
2) The Ingress has a parameter called servicePort:
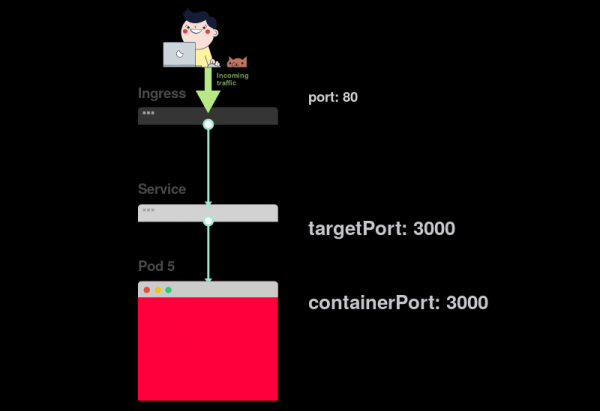
3) This parameter (servicePort) must always match with port in the Service definition:
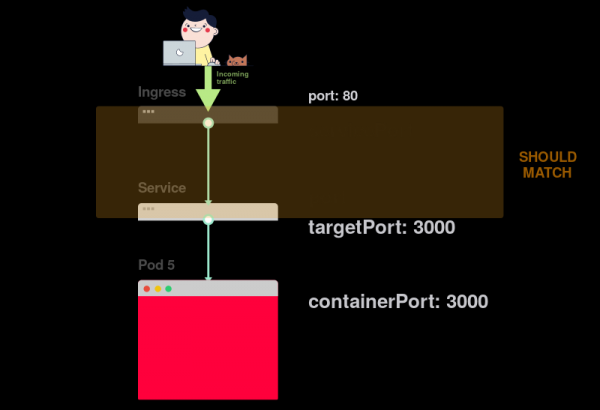
4) If the Service specifies port 80, then it is necessary that servicePort also equals 80:
In practice, pay attention to the following lines:
apiVersion: v1
kind: Service
metadata:
 name: my-service  # <<<
spec:
  ports:
 - port: 80  # <<<
   targetPort: 8080
  selector:
    any-name: my-app
---
apiVersion: networking.k8s.io/v1beta1
kind: Ingress
metadata:
  name: my-ingress
spec:
  rules:
  - http:
    paths:
    - backend:
       serviceName: my-service  # <<<
       servicePort: 80  # <<<
     path: /
How to check if Ingress is working?
You can use the method with kubectl port-forward, but instead of the service, you need to connect to the Ingress controller.
First, you need to find the name of the pod with the Ingress controller:
kubectl get pods --all-namespaces
NAMESPACE   NAME                              READY STATUS
kube-system coredns-5644d7b6d9-jn7cq          1/1   Running
kube-system etcd-minikube                     1/1   Running
kube-system kube-apiserver-minikube           1/1   Running
kube-system kube-controller-manager-minikube  1/1   Running
kube-system kube-proxy-zvf2h                  1/1   Running
kube-system kube-scheduler-minikube           1/1   Running
kube-system nginx-ingress-controller-6fc5bcc  1/1   Running
Find the Ingress pod (it may belong to another namespace) and run the command of the PVC object:, to find out the port numbers:
kubectl describe pod nginx-ingress-controller-6fc5bcc
--namespace kube-system
 | grep Ports
Ports:         80/TCP, 443/TCP, 18080/TCP
Finally, connect to the pod:
kubectl port-forward nginx-ingress-controller-6fc5bcc 3000:80 --namespace kube-systemNow, every time you send a request to port 3000 on your computer, it will be redirected to port 80 of the Ingress controller pod. By going to , you should see the page created by the application.
Summary on ports
Let's recap which ports and labels need to match:
- The selector in the Service definition must match the label of the pod;
-
targetPortin the Service definition must match thecontainerPortcontainer inside the pod. -
portThe definition of Service can be anything. Different services can use the same port since they have different IP addresses; -
servicePortIngress must match theportin the definition of Service; - The service name must match the field
serviceNamein the Ingress.
Unfortunately, it's not enough to know how to structure the YAML configuration correctly.
What happens when something goes wrong?
Perhaps the pod is not starting or it keeps crashing.
3 steps to troubleshoot applications in Kubernetes
Before starting to debug the deployment, it's essential to have a good understanding of how Kubernetes works.
Since every application deployed in K8s has three components, debugging them should follow a specific order, starting from the bottom.
- First, you need to make sure the pods are running, then…
- Check if the service is delivering traffic to the pods, and then…
- Check if the Ingress is properly configured.
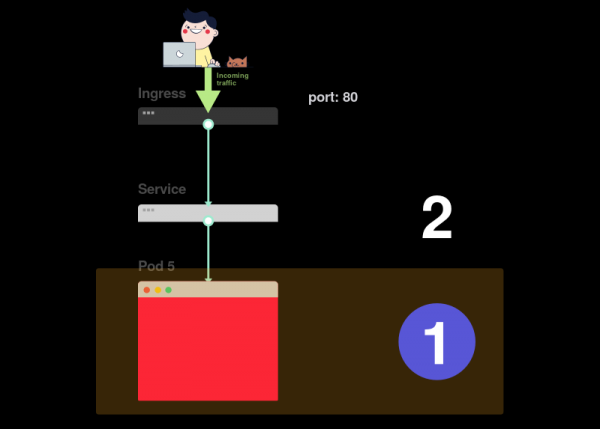
Visual representation:
1) Start the problem search from the bottom. First, check that the pods are in the status of Ready and Running:
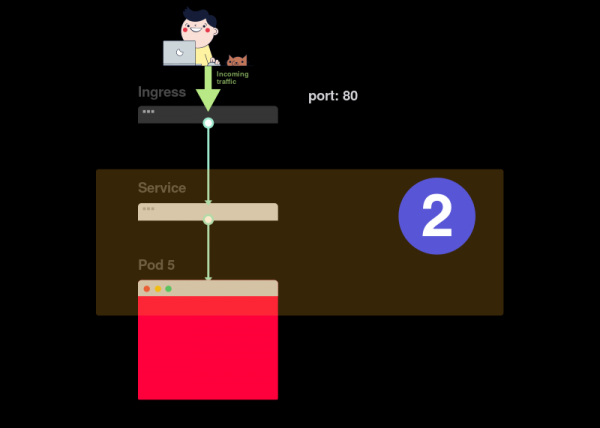
2) If the pods are ready (Ready), it is necessary to find out whether the service distributes traffic among the pods:
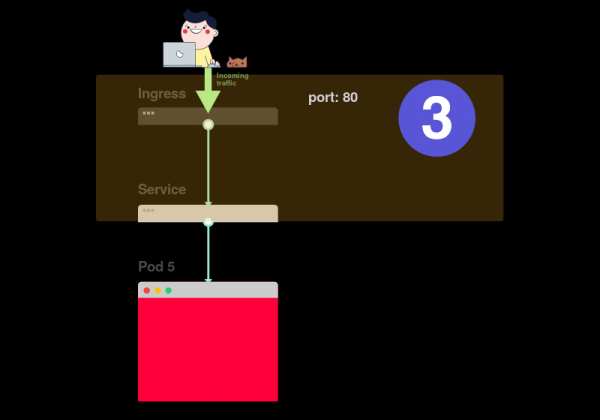
3) Finally, you need to analyze the connection between the service and the Ingress:
1. Diagnosing pods
In most cases, the problem is related to the pod. Make sure that the pods are listed as Ready and Running. You can check this using the command:
kubectl get pods
NAME                    READY STATUS            RESTARTS  AGE
app1                    0/1   ImagePullBackOff  0         47h
app2                    0/1   Error             0         47h
app3-76f9fcd46b-xbv4k   1/1   Running           1         47h
In the command output above, the last pod is listed as Running and Ready, however, this is not the case for the other two.
How do you know what went wrong?
There are four useful commands for diagnosing pods:
-
kubectl logsallows you to extract logs from the containers in the pod; -
kubectl describe podallows you to view the list of events related to the pod; -
kubectl get podallows you to obtain the YAML configuration of the pod stored in Kubernetes; -
kubectl exec -ti bashallows you to start an interactive command shell in one of the pod's containers.
Which one to choose?
The thing is, there is no universal command. You should use a combination of them.
Typical pod problems
There are two main types of pod errors: startup errors and runtime errors.
Startup errors:
-
ImagePullBackoff -
ImageInspectError -
ErrImagePull -
ErrImageNeverPull -
RegistryUnavailable -
InvalidImageName
Runtime Errors:
-
CrashLoopBackOff -
RunContainerError -
KillContainerError -
VerifyNonRootError -
RunInitContainerError -
CreatePodSandboxError -
ConfigPodSandboxError -
KillPodSandboxError -
Some errors occur more frequently than others. Here are some of the most common errors and how to fix them. -
ImagePullBackOff
This error appears when Kubernetes cannot pull the image for one of the pod’s containers. Here are the three most common reasons:
The image name is incorrect — for example, you made a typo, or the image does not exist;
An invalid tag for the image is specified;
- The image is stored in a private registry, and Kubernetes does not have permissions to access it.
- The first two reasons are easy to fix — just correct the image name and tag. In the case of the last, you need to provide access credentials to the private registry in a Secret and link it to the pods. The Kubernetes documentation
- has an example
of how this can be done. if the container cannot start. This usually happens when:
CrashLoopBackOff
There is an error in the application preventing it from starting; CrashLoopBackOffit is misconfigured
- The Liveness test has failed too many times.
- Container ;
- kubectl logs --previous
It outputs error messages from the previous incarnation of the container.
This error occurs when the container is unable to start. It corresponds to the time before the application starts. Its usual cause is a misconfiguration, such as:attempting to mount a non-existent volume, like ConfigMap or Secrets;
RunContainerError
attempting to mount a read-only volume as read-write.
- To analyze such errors, the command is useful
- kubectl describe pod
Pods in Pending state After creation, the pod remains in the.
Pending
state. Why does this happen? Here are possible reasons (assuming that the scheduler is functioning normally):.
There are not enough resources in the cluster, such as compute power and memory, to start the pod.
A ResourceQuota object is set in the corresponding namespace.
- There are not enough resources in the cluster, such as compute power and memory, to run the pod.
- An object is created in the corresponding namespace.
ResourceQuotaCreating a pod will result in the namespace exceeding the quota. - Pod is stuck in Pending
PersistentVolumeClaim.
In this case, it is recommended to use the command kubectl describe and check the section Events:
kubectl describe pod In case of errors related to ResourceQuotas, it is advisable to check the cluster logs using the command
kubectl get events --sort-by=.metadata.creationTimestampPods are not in Ready state
If the pod shows as Running, but is not in the state of Ready, it means the readiness check (readiness probe) is failing.
When this happens, the pod does not connect to the service and traffic does not reach it. The failure of the readiness test is caused by issues in the application. In this case, to troubleshoot the error, it is necessary to analyze the section Events in the output of the command kubectl describe.
2. Service Diagnosis
If the pods are listed as Running and Ready, but there is still no response from the application, check the service settings.
Services handle traffic routing to pods based on their labels. Therefore, the first thing to do is check how many pods are working with the service. To do this, you can check the endpoints in the service:
kubectl describe service | grep Endpoints An endpoint is a pair of values of the type <IP-адрес:порт>, and the output should contain at least one such pair (meaning at least one pod is working with the service).
If the section Endpoints is empty, there are two possibilities:
- there is no pod with the correct label (tip: check if the namespace is selected correctly);
- there is an error in the service labels in the selector.
If you see a list of endpoints but still cannot access the application, the likely culprit is an error in targetPort the service description.
How to check the service's functionality?
Regardless of the type of service, you can use the command kubectl port-forward to connect to it:
kubectl port-forward service/ 3000:80Here:
-
<service-name>— is the name of the service; - 3000 — the port you are opening on your computer;
- 80 — the port on the service side.
3. Ingress Diagnosis
If you have read this far, then:
- the pods are listed as
RunningandReady; - the service is successfully distributing traffic among the pods.
However, you still cannot 'reach' the application.
This means that, most likely, the Ingress controller is incorrectly configured. Since the Ingress controller is an external component in the cluster, there are various debugging methods depending on its type.
Before resorting to special tools for configuring Ingress, you can do something quite simple. Ingress uses serviceName and servicePort to connect to the service. It's necessary to check if they are configured correctly. You can do this using the command:
kubectl describe ingress If the column Backend is empty, there is a high likelihood of a configuration error. If the backends are in place but access to the application is still unavailable, the problem may be related to:
- the availability settings of Ingress from the public internet;
- the cluster's accessibility settings from the public internet.
You can identify infrastructure issues by connecting directly to the Ingress pod. First, locate the Ingress controller pod (it may be in a different namespace):
kubectl get pods --all-namespaces
NAMESPACE   NAME                              READY STATUS
kube-system coredns-5644d7b6d9-jn7cq          1/1   Running
kube-system etcd-minikube                     1/1   Running
kube-system kube-apiserver-minikube           1/1   Running
kube-system kube-controller-manager-minikube  1/1   Running
kube-system kube-proxy-zvf2h                  1/1   Running
kube-system kube-scheduler-minikube           1/1   Running
kube-system nginx-ingress-controller-6fc5bcc  1/1   Running
Use the command of the PVC object:, to set the port:
kubectl describe pod nginx-ingress-controller-6fc5bcc
--namespace kube-system
 | grep Ports
Finally, connect to the pod:
kubectl port-forward nginx-ingress-controller-6fc5bcc 3000:80 --namespace kube-systemNow all requests to port 3000 on the computer will be forwarded to port 80 of the pod.
Is it working now?
- If yes, then the problem is with the infrastructure. It is necessary to determine how traffic routing to the cluster is being handled.
- If not, then the issue lies with the Ingress controller.
If you cannot get the Ingress controller to work, you will need to debug it.
There are many types of Ingress controllers. The most popular are Nginx, HAProxy, Traefik, among others. (for more details about existing solutions, see - translator's note) You should refer to the troubleshooting guide in the documentation of the respective controller. Since is the most popular Ingress controller, we have included several tips for resolving related issues in this article.
Debugging the Nginx Ingress controller
The Ingress-nginx project has an official . The command kubectl ingress-nginx can be used for:
- analyzing logs, backends, certificates, etc.;
- connecting to Ingress;
- examining the current configuration.
The following three commands will help you:
-
kubectl ingress-nginx lint— checksnginx.conf; -
kubectl ingress-nginx backend— inspects the backend (similar tokubectl describe ingress); -
kubectl ingress-nginx logs— checks the logs.
Note: In some cases, you may need to specify the correct Ingress controller namespace using the flag --namespace.
Summary
Diagnosing in Kubernetes can be a challenging task if you don't know where to start. Always approach the problem from a "bottom-up" perspective: begin with the pods, and then move on to the service and Ingress. The debugging methods described in this article can also be applied to other objects, such as:
- failing Jobs and CronJobs;
- StatefulSets and DaemonSets.
I would like to express my gratitude , and for valuable comments and contributions.
P.S. from the translator
Also read in our blog:
- «»;
- «»;
- «»;
- «».
Source: habr.com
