

Heisenberg's uncertainty principle states that you cannot simultaneously measure an object's position and its velocity. If an object is in motion, it has no specific location. Conversely, if a location is established, the object has no velocity.

Regarding microservices on the Red Hat OpenShift platform (and managed by Kubernetes), the corresponding open-source software allows them to concurrently report both their performance and their integrity. While this does not disprove Heisenberg's principle, it eliminates uncertainty when working with cloud applications. Istio facilitates easy tracing and monitoring of such applications to keep everything under control.
Defining Terminology
Under tracing (Tracing) refers to logging system activities. It sounds quite general, but one of the key rules here is to dump tracing data into the appropriate storage without worrying about its formatting. All the work of searching and analyzing the data is the responsibility of the consumer. Istio employs the Jaeger tracing system, which implements the OpenTracing data model.
Traces (Traces, where the term 'traces' is used in the context of 'tracks', like in ballistic expertise) refer to data that fully describes the passage of a request or a unit of work, as in the expression 'from start to finish'. For instance, everything that happens from the moment a user clicks a button on a web page until the moment data is returned, including all the microservices involved during this process. One trace can be said to fully describe (or model) the passage of a request back and forth. In the Jaeger interface, traces are broken down into components along the timeline, similar to how a chain can be dissected into individual links. However, instead of links, a trace consists of what are called spans.
Span is the interval from the start of a unit of work to its completion. Continuing the analogy, one can say that each span represents a separate link in the chain. A span may have (or not have) one or more child spans. Consequently, the top-level span (root span) will share the same overall duration as the trace to which it relates.
Monitoring – this is essentially the observation of your system – through the UI or automation tools. Monitoring is based on tracing data. In Istio, monitoring is implemented using Prometheus and has an appropriate UI. Prometheus supports automated monitoring with alerts and Alert Managers.
We make notches
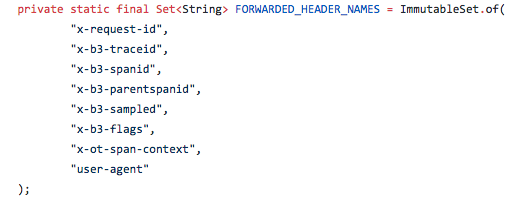
To enable tracing, the application must create a collection of spans. Then, they need to be exported to Jaeger, which will in turn create a visual representation of the trace. Among other things, these spans label the operation name, as well as the timestamps for its start and end. The transmission of spans is carried out by redirecting the headers intended for Jaeger from incoming requests to outgoing requests. Depending on the programming language used, this may require slight modifications to the application's source code. Below is an example of Java code (when using the Spring Boot framework) that adds B3 (Zipkin-style) headers to your request in the Spring configuration class:

The following header settings are used:
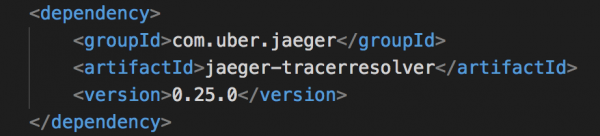
If you are using Java, you can leave the code untouched and simply add a few lines to the Maven POM file and set environment variables. Here are the lines to add to the POM.XML file to implement the Jaeger Tracer Resolver:
The corresponding environment variables are set in the Dockerfile:

That's it, everything is set up, and our microservices will begin generating tracing data.
Looking at it broadly
Istio includes a simple control panel based on Grafana. When everything is set up and running on the Red Hat OpenShift PaaS platform (in our example, Red Hat OpenShift and Kubernetes are deployed on minishift), this panel can be launched using the following command:
open "$(minishift openshift service grafana -u)\/d\/1\/istio-dashboard?refresh=5⩝Id=1"
The Grafana panel allows for a quick assessment of the system's performance. A fragment of this panel is shown in the image below:
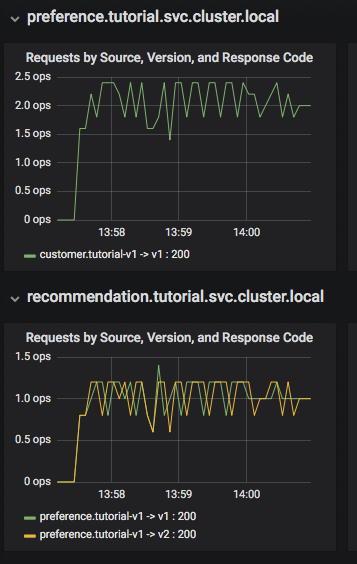
Here, we can see that the customer microservice calls the preference v1 microservice, which in turn calls the recommendation v1 and v2 microservices. On the Grafana panel, there's a Dashboard Row block for high-level metrics, such as Global Request Volume, success rates, and 4xx error rates. Additionally, there's a Server Mesh view with charts for each service and a Services Row block for detailed information about each container for every service.
Now let's dig a bit deeper
With a properly configured Istio tracing, you can dive into system performance analysis straight out of the box. In the Jaeger UI, you can view traces and see how far and deep they extend, as well as visually locate performance bottlenecks. When using Red Hat OpenShift on the minishift platform, you can launch the Jaeger UI with the following command:
minishift openshift service jaeger-query --in-browser
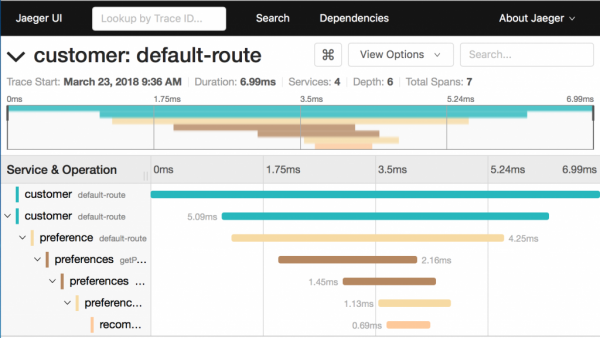
What can be said about tracing in this screenshot:
- It breaks down into 7 spans.
- The total execution time is 6.99 ms.
- The recommendation microservice, which is the last in the chain, takes 0.69 ms.
Diagrams of this type allow for a quick understanding of situations where the performance of the entire system suffers due to a single poorly performing service.
Now let's complicate the task and run two instances of the recommendation:v2 microservice with the command oc scale --replicas=2 deployment/recommendation-v2. Here’s what the pods look like afterward:
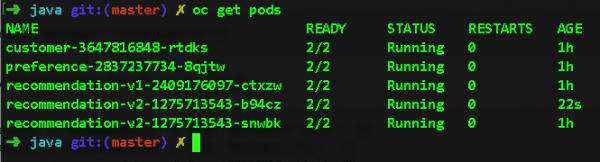
If we switch back to Jaeger and expand the span for the recommendation service, we will see which pod the requests are being routed to. Thus, we can easily localize bottlenecks at the level of a specific pod. We need to look at the node_id field:

Where and how everything is going
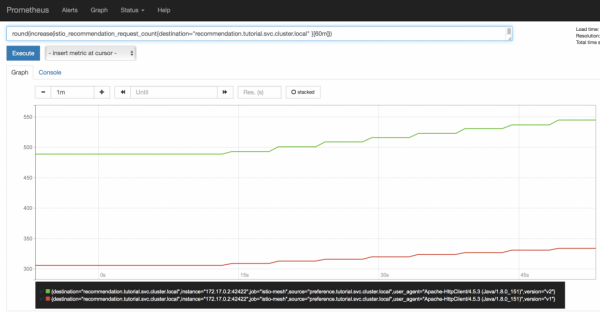
Now we go to the Prometheus interface and quite predictably see that requests between the second and first versions of the recommendation service are split in a ratio of 2:1, strictly based on the number of active pods. Moreover, this chart will dynamically change as pods scale up and down, which will be especially useful during Canary Deployment (we will look in more detail at this deployment scheme next time).
This is just the beginning
Today, we've only touched the surface of a wealth of information about Jaeger, Grafana, and Prometheus. Essentially, this was our goal – to guide you in the right direction and open up the possibilities of Istio.
And remember, all of this is already built into Istio. When using certain programming languages (like Java) and frameworks (like Spring Boot), you can implement all of this without touching the application code. Yes, you will need to make slight modifications to the code if you're using other languages, primarily Node.js or C#. However, since observability (i.e., tracing) is a must when building reliable cloud systems, you'll have to adjust your code regardless of whether you have Istio or not. So why not invest your efforts more wisely?
At the very least, to be able to answer the questions "where?" and "how fast?" with 100% certainty.
Chaos engineering in Istio: it was intended this way
The ability to break things helps ensure they don’t break.
Software testing is not only complex but also crucial. At the same time, testing for correctness (like whether a function returns the correct result) is one thing, while testing under unreliable network conditions is entirely another challenge (often it's assumed that the network always operates smoothly, which is the foremost of eight misconceptions about distributed computing). One of the difficulties in addressing this challenge lies in how to simulate failures in the system or to introduce them deliberately through so-called fault injection. This can be done by modifying the application's source code. But then you will be testing not your original code but a version that specifically simulates failures. As a result, you risk falling into the deadly embrace of fault injection and encountering Heisenbugs – bugs that disappear when you attempt to detect them.
Now, we will show how Istio helps tackle these challenges effortlessly.
Here’s how everything looks when everything runs perfectly.
Let’s consider the following scenario: we have two pods for our recommendation microservice, which we took from the Istio tutorial. One pod is labeled as v1 and the other as v2. As we can see, everything works perfectly so far:
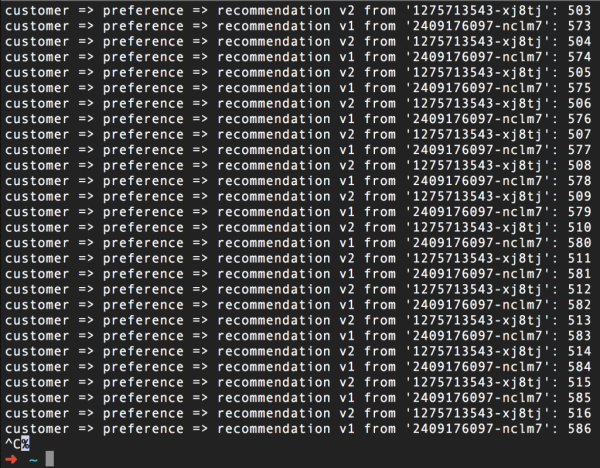
(By the way, the number on the right is simply a call counter for each pod)
But we definitely need more than that, right? Well, let's try to break everything without touching the source code.
Causing disruptions in the microservice
Below is a yaml file for an Istio routing rule that will fail (error) in half of the cases. server 503):
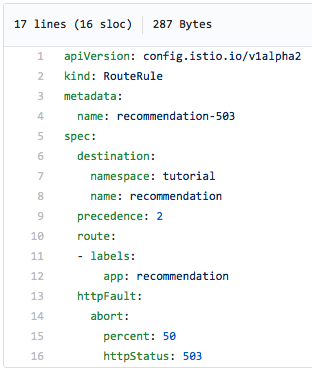
Note that we explicitly state that an error 503 should be returned in half of the cases.
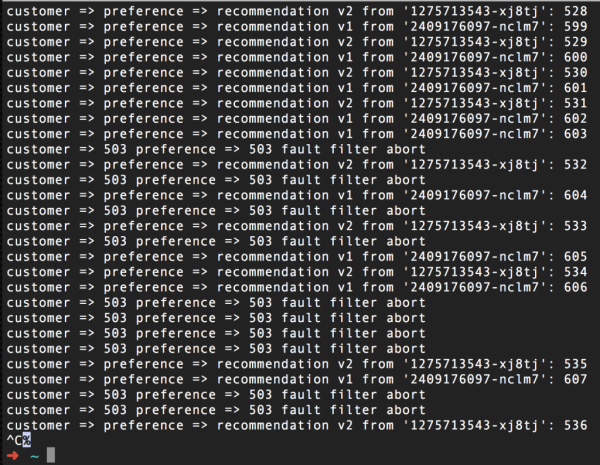
Here’s how a screenshot will look of the curl command running in a loop after we activate this rule to simulate failures. As we see, half of the requests return error 503, regardless of whether they go to pod v1 or v2:
To restore normal operation, just delete this rule with the command istioctl delete routerule recommendation-503 -n tutorial. Here, Tutorial is the name of the Red Hat OpenShift project in which our Istio tutorial runs.
Introducing artificial delays
Artificial error 503 helps test the system for fault tolerance, but the ability to predict and handle delays should impress you even more. Moreover, delays occur more often in real life than failures. A slow microservice is a thorn that affects the entire system. With Istio, you can test code related to delay handling without changing it. To start, we'll show you how to do this in the case of artificially introduced network delays.
Note that after such testing, you may need (or want) to refine your code. The good news here is that in this case, you'll be acting proactively, rather than reactively. This is how the development cycle should be structured: coding-testing-feedback-coding-testing…
Here’s what the rule looks like… Although you know what? Istio is so simple, and this yaml file is so clear, that everything in this example speaks for itself, just take a look:
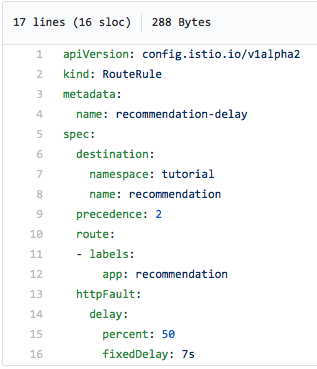
In half of the cases, we will experience a 7-second delay. This is not the same as inserting a sleep command in the source code, as Istio actually delays the request for 7 seconds. Since Istio supports Jaeger tracing, this delay is clearly observed in the Jaeger UI, as shown in the screenshot below. Note the long request in the upper right corner of the graph – its duration is 7.02 seconds:
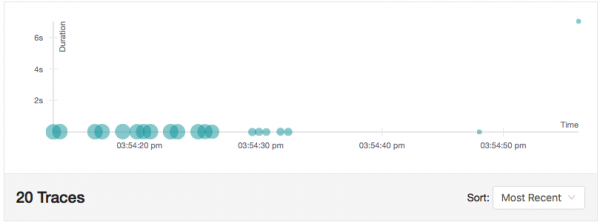
This scenario allows us to test code under network delays. And it's clear that by removing this rule, we will eliminate the artificial delay. To reiterate, we accomplished all of this without touching the source code.
Never give up and never surrender
Another useful feature for chaos engineering in Istio is making retries to the service a specified number of times. The idea is not to stop trying when the first request results in a 503 error – perhaps on the N-th attempt, we will succeed. Maybe the service just needed a brief moment of downtime for some reason. Yes, we should investigate and fix that reason. But that can wait; for now, let's try to keep the system running.
So, we want the service to occasionally return a 503 error, and Istio will then attempt to reconnect. Clearly, we need a way to generate a 503 error without touching the code...
Wait, hold on! We just did this.
This file will cause the recommendation-v2 service to return a 503 error in half of the cases:
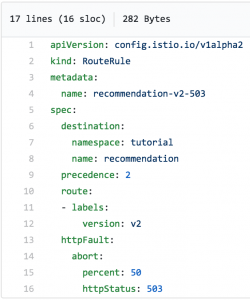
It's obvious that some requests will fail:
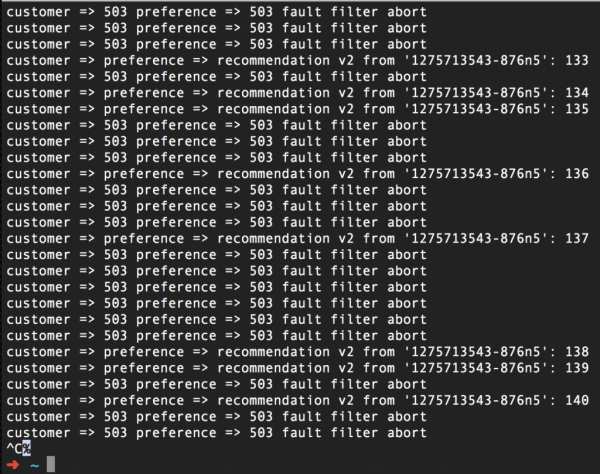
Now let's utilize the Istio Retry feature:
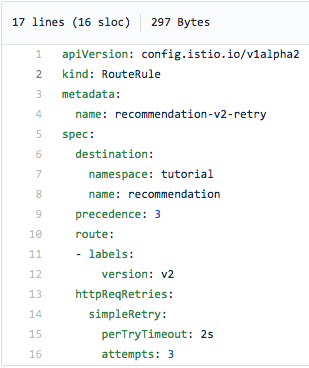
This routing rule makes three retries with a two-second interval and should reduce (or ideally completely eliminate) 503 errors:
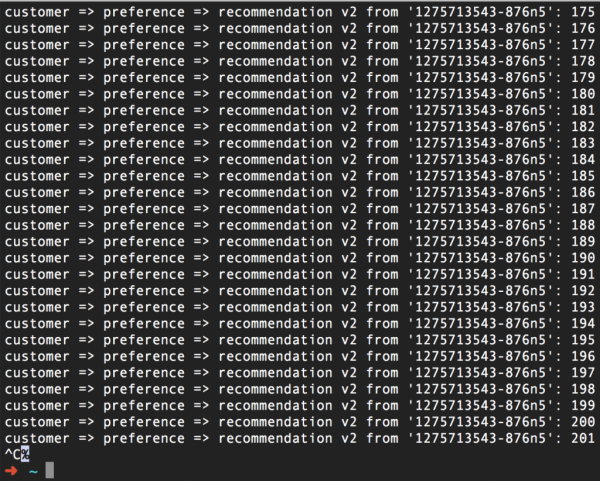
To summarize: we have configured Istio to first generate a 503 error for half of the requests. Secondly, the same Istio retries the connection to the service upon encountering a 503 error. As a result, everything works perfectly. Thus, by using the Retry feature, we fulfilled our promise to never give up and never surrender.
And yes, we did it again without touching the code at all. All we needed were two Istio routing rules:

How not to let the user down or seven waiting for one
Now let's turn the situation inside out and consider a scenario where we should only insist on not giving up for a certain fixed time. After that, we simply need to stop trying to process the request, so as not to make everyone wait for a single lagging service. In other words, we will not defend a lost position, but will retreat to a backup line to avoid letting the website user down and forcing them to linger in the dark.
In Istio, you can set a timeout for request execution. If the service exceeds this timeout, a 504 (Gateway Timeout) error is returned – again, all this is done through Istio's configuration. However, we will need to add a sleep command to the service's source code (and then, of course, perform a rebuild and redeploy) to simulate slow service performance. Unfortunately, there’s no other way.
So, we inserted a three-second sleep into the code of the recommendation v2 service, rebuilt the corresponding image, and redeployed the container, and now we will add a timeout with the following Istio routing rule:
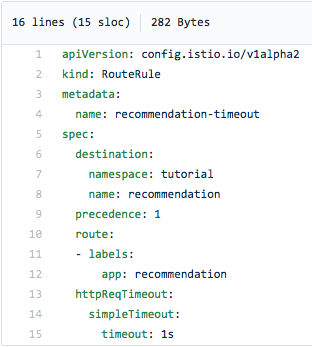
In the screenshot above, you can see that we give up trying to contact the recommendation service if we do not receive a response within one second, i.e., even before a 504 error occurs. After applying this routing rule (and adding a three-second sleep to the recommendation:v2 service code), we will get the following:
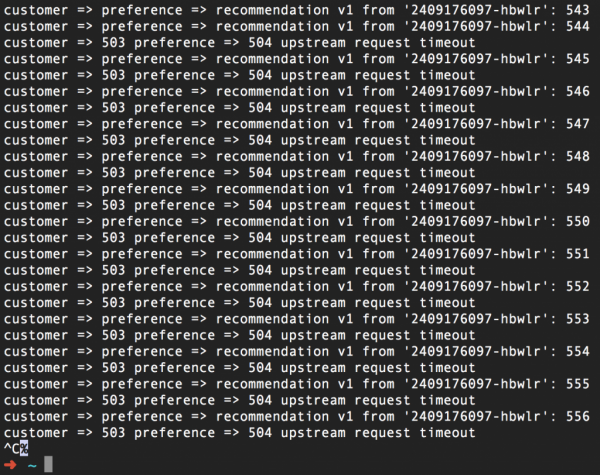
Once again, we reiterate, but the timeout can be set without touching the source code. An additional bonus here is that now you can modify your code to respond to the timeout and easily test these enhancements using Istio.
And now everything together
Introducing a bit of chaos with Istio is a great way to test your code and the reliability of your system as a whole. Fallback, bulkhead, and circuit breaker patterns, along with mechanisms for creating artificial failures and delays, as well as retries and timeouts, will be extremely useful when building resilient cloud systems. Combined with Kubernetes and Red Hat OpenShift, these tools will help confidently face the future.
Source: habr.com
